Using sensors to acquire performance parameters in sport science and practice has been a developing area, with a focus on lighter and smaller devices, such as inertial measurement units (IMU). Research published in the journal Sensors investigates improvements to IMU data extraction.

Image Credit: Izf/Shutterstock.com
In sports with high speeds, such as sprints, little direct feedback is available to the athlete. As a result, scientific assistance can give detailed feedback and help to enhance future performances.
Temporal parameters such as ground contact time (GCT), step rate, and step duration are usual features of running analysis. However, even minor deviations can have a decisive role in temporal parameters and can be captured only with the help of technology.
Standard methods like video footage, timing gates, contact mats, motion capturing, or force plates are used to determine exact temporal sprint parameters.
Data from these approaches can aid running technique improvements, though significant effort and preparation are required. During field training or competition heats, where the most valuable information may be collected, such methods cannot be easily applied.
To replace these time-intensive and costly systems, the integration of IMUs for diagnostics in gait, runs, or sprinting has received much attention in the last decade. This study describes a method for extracting the stride parameter GCT from inertial sensor signals in sprinting and aims to validate the detection of GCTs for elite sprinters in the field with shoe-mounted IMUs.
Methodology
The sample consists of 1140 steps from 34 maximum 50- and 100-m sprints performed by five elite national sprinters, with three participants of the Tokyo Olympics; 889 of these steps were simultaneously measured with the photoelectric Optogait system.
Two IMUs were attached to each athlete’s shoes, positioned right above the ankle (see Figure 1). The IMUs were selected to be easily applicable, least obstructive, and light for the performance of the athletes.
The Optogait corridor was repositioned to the second 50 m sector for six sprints to obtain data for the total distance of 100 m.
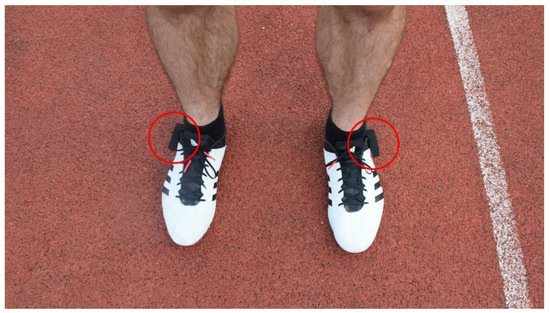
Figure 1. Sprint shoes with IMUs attached to the ankles (red circles). Image Credit: Blauberger, et al., 2021
Al raw data of both systems were exported as local text files, and personalized data was anonymized.
The automatic detection of step events was performed through two relevant episodes of a step cycle: Initial contact (IC) and terminal contact (TC).
Accelerometer and gyroscope data patterns were found to be the most beneficial.
Figure 2 illustrates the algorithmic determination of the time points for one single step of a sprint. The graphs show synchronous signals of the accelerometer and gyroscope of the IMU for one single step, together with the Optogait signal for ground contact.
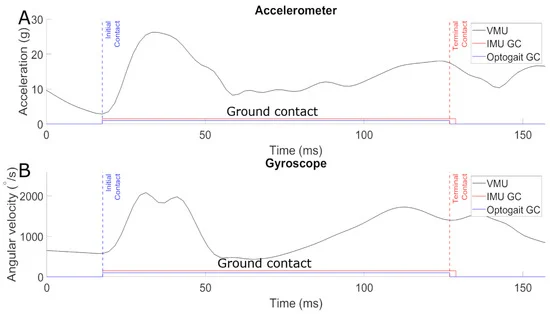
Figure 2. Vector magnitude unit (VMU) of x, y, and z acceleration (A) and angular velocity (B) throughout one single sprint step. The blue dashed line marks the initial contact event; the red dashed line the terminal contact. The solid red line indicates the resulting ground contact period for the inertial measurement unit (IMU). The photo-electric-measured (Optogait) ground contact time is represented by the solid blue line. Image Credit: Blauberger, et al., 2021
Results of the entire sample include all steps, which were performed by at least two athletes. This discrepancy arises from the different step lengths of the athletes tested, resulting in a maximum of 50 steps for any 100-m sprint.
Results
The algorithm accurately detected 863 of 889 ground contact events, with a false detection rate of 2.92%; 13.33% of the last five steps, and 6.47% of the first five steps of the respective sprint were detected inaccurately. The remaining sprint steps were detected inaccurately in 0.56% of the cases.
The IMUs detected a mean GCT of 119.95 ± 22.51 ms for all simultaneously measured steps, and Optogait detected 117.13 ± 24.03 ms. The step-wise average relative time difference between Optogait-GCT and IMU-GCT was 3.55 ± 6.16 ms, translating to an average deviation of GCT of 3.03%.
The measured mean absolute time difference was 5.46 ± 4.55 ms (4.66% deviation). The deviation of each step leads to a total root mean square error of 7.97 ms. Figure 3 illustrates measurement errors for the detected GCT as a Bland-Altman plot.
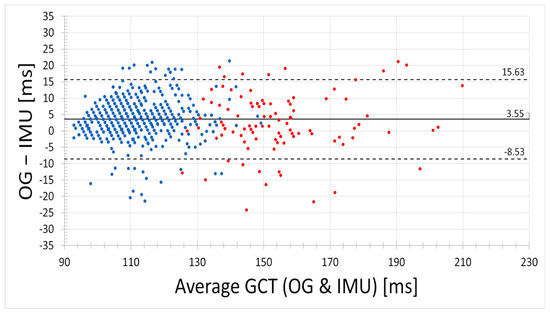
Figure 3. Bland-Altman-Plot of IMU- and Optogait (OG) measured ground contact time (GCT). Dashed lines show Limits of Agreement (2∗SD): −8.53 ms and 15.63 ms, the dotted line the mean: 3.55 ms. Red data points represent steps 1–5 at the beginning of the sprint. Blue-colored dots indicate all other steps (i.e., steps 6–50). Image Credit: Blauberger, et al., 2021
The average step-wise measured GCT with Optogait (blue) and IMUs (red) is shown in Figure 4.
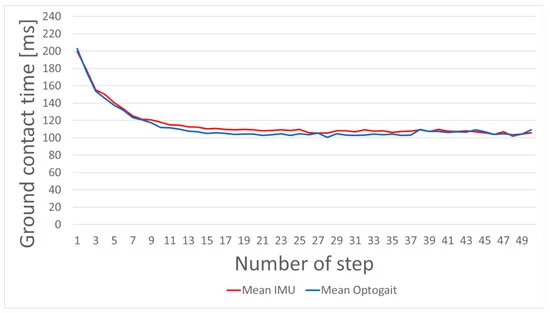
Figure 4. Average GCT of Optogait (blue) and IMU (red) measurements. Only these steps are included, which at least two different athletes performed. All measured data points are summarized to one value for the respective step in the sprint. Image Credit: Blauberger, et al., 2021
The distribution of GCT throughout step ranges of 5 and 10 steps is depicted in Table 1.
Table 1. Mean IMU measured ground contact time (GCT), and its relative and absolute percentage deviation to the reference system for various step ranges of all 100-m sprints. The first and last intervals are summarized into five steps. All other intervals combine ten steps. The last five steps showed the lowest percentage difference. Source: Blauberger, et al., 2021
| Step |
GCT ± SD |
% Diff ± SD |
Absolute % Diff ± SD |
| ine 1-5 |
163.45 |
1.17% |
4.33% |
| |
24.73 |
1.77% |
0.36% |
| ine 6-15 |
118.43 |
3.28% |
4.61% |
| |
9.45 |
1.52% |
0.78% |
| ine 16-25 |
109.32 |
4.28% |
4.98% |
| |
6.40 |
0.52% |
0.69% |
| ine 26-35 |
107.12 |
5.14% |
5.72% |
| |
9.12 |
2.18% |
1.27% |
| ine 36-45 |
107.86 |
4.24% |
5.86% |
| |
9.01 |
2.27% |
1.13% |
| ine 46-50 |
104.80 |
0.22% |
2.13% |
| |
6.71 |
1.26% |
1.11% |
Figure 5 illustrates two separate sprints of the same athlete. Blue represents the first and red the second sprint chronologically.
On average, the difference between the GCT of both runs is 0.48 ms per step. An average decrease of 27.36% in both runs for steps 1–5 is evident.
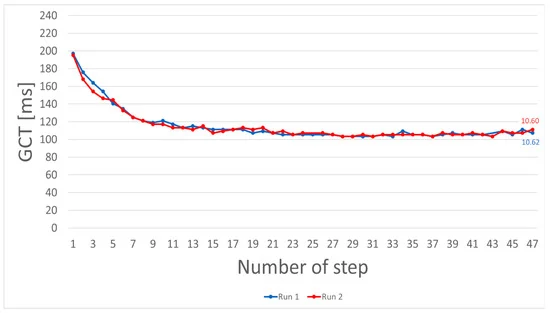
Figure 5. IMU-measured GCT of two 100 m sprints of the same athlete. Run 1 (blue) was conducted approximately 30 min before Run 2 (red). The graph illustrates reliable intra-subject results. Image Credit: Blauberger, et al., 2021
Figure 6 illustrates a comparison of GCTs of a female and male sprinter, which shows the possibilities of this method. A dot on the respective line represents each ground contact.
For the male sprinter, the time between the last and the first step of this 100-m dash was 10.66 seconds, and for the female sprinter, it was 11.12 seconds. For the female athlete, the number of steps altered with 50 steps, and for the male athlete, it altered with 47 steps. No gender-dependent differences were noticed in the top speed phase of the run.
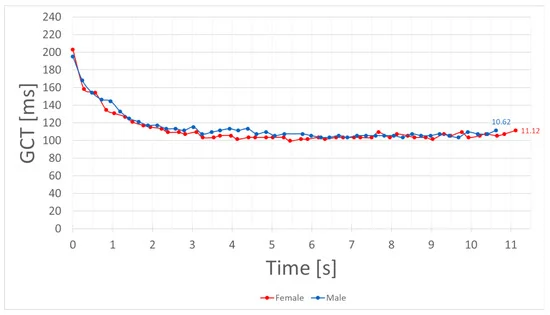
Figure 6. IMU-measured GCT of a female (red) and a male (blue) sprinter over 100 m. The marked dots on each line represent ground contacts. The connecting line between the dots is added for better visual separation. The time of the last contact represents the total period between the first and the last step of the respective sprint. Image Credit: Blauberger, et al., 2021
Discussion
The GCT results illustrated in Figure 6 should be compared further with inter-subject and intra-subject results.
As more inaccurately detected steps were found during the first five (6.47%) and last five (13.33%) steps, researchers note the importance of improving the used algorithm.
In recent years, the methodology of pattern detection from IMU signals has been a fast-developing topic; for example, the early steps of a sprint (see Figure 3) reveal greater discrepancies.
When compared to Optogait, the mean overestimation of 3.55 ms of IMU-based GCT detection points towards a systematic bias (see Figure 3). In contrast, Figure 4 illustrates low differences at the beginning and end of the sprints, which can also be observed in Table 1.
The lower deviations of step range 1–5 and 45–50 pinpoint that an adaptive GCT recognition could help. The first five steps are specifically crucial because huge relative changes can be noticed in this timespan (see Figure 5). These indications must be considered in a prospective correction procedure.
Figures 5 and 6 illustrate individual runs for application purposes. The temporal resolution of GCT facilitates the detection of even minor differences in a single run. The illustration of a female and a male sprinter in Figure 6 does not support a general gender comparison.
Conclusions
The step detection rate with the IMU data showed high reliability. The early and late stages of the sprints tended to have lower deviations between IMU and Optogait measured GCT.
This analysis can help enhance knowledge about performance on the highest levels, and findings encourage the implementation of IMU-based measurements in high-level sprint competitions.
Continue reading: Helmet Sensors to Monitor Head Injuries.
Journal Reference:
Blauberger, P., Horsch, A., Lames, M. (2021) Detection of Ground Contact Times with Inertial Sensors in Elite 100-m Sprints under Competitive Field Conditions. Sensors, 21(21), p. 7331. Available at: https://www.mdpi.com/1424-8220/21/21/7331/htm
References and Further Reading
- Rimmer, E & Sleivert, G (2000) Effects of a Plyometrics Intervention Program on Sprint Performance. Journal of Strength and Conditioning Research, 14, p. 295. Available at: https://paulogentil.com/pdf/Effects%20of%20a%20Plyometrics%20Intervention%20Program%20on%20Sprint%20Performance.pdf.
- Lockie, R. G., et al. (2013) Influence of sprint acceleration stance kinetics on velocity and step kinematics in field sport athletes. Journal of Strength and Conditioning Research, 27, pp. 2494–2503. https://doi.org/10.1519/JSC.0b013e31827f5103.
- Coh, M., et al. (2001) Morphologic and kinematic characteristics of elite sprinters. Collegium Antropologicum, 25, pp. 605–610.
- Di Michele, R & Merni, F (2014) The concurrent effects of strike pattern and ground-contact time on running economy. Journal of Science and Medicine in Sport, 17, pp. 414–418. doi.org/10.1016/j.jsams.2013.05.012.
- Morin, J. B., et al. (2012) Mechanical determinants of 100-m sprint running performance. European Journal of Applied Physiology, 112, pp. 3921–3930. doi.org/10.1007/s00421-012-2379-8.
- Mattes, K., et al. (2014) A longitudinal study of kinematic stride characteristics in maximal sprint running. Journal of Human Sport and Exercise, 9, pp. 686–699. doi.org/10.14198/jhse.2014.93.02.
- Seidl, T., et al. (2021) Assessment of Sprint Parameters in Top Speed Interval in 100 m Sprint—A Pilot Study Under Field Conditions. Frontiers in Sports and Active Living, 3, p. 165. doi.org/10.3389/fspor.2021.689341.
- Dunn, M & Kelley, J (2015) Non-invasive, Spatio-temporal Gait Analysis for Sprint Running Using a Single Camera. Procedia Engineering, 112, pp. 528–533. doi.org/10.1016/j.proeng.2015.07.237.
- Nagahara, R., et al. (2014) Kinematics of transition during human accelerated sprinting. Biology Open, 3, pp. 689–699. doi.org/10.1242/bio.20148284.
- Purcell, B., et al. (2006) Use of accelerometers for detecting foot-ground contact time during running. In: BioMEMS and Nanotechnology II; Nicolau, D.V., Ed.; International Society for Optics and Photonics: Bellingham, WA, USA; Volume 6036, p. 603615.
- Linke, D., et al. (2018) Validation of electronic performance and tracking systems EPTS under field conditions. PLoS ONE, 13, p. e0199519. doi.org/10.1371/journal.pone.0199519.
- Seidl, T., et al. (2017) Estimation and validation of spatio-temporal parameters for sprint running using a radio-based tracking system. Journal of Biomechanics, 65, pp. 89–95. doi.org/10.1016/j.jbiomech.2017.10.003.
- Schmidt, M., et al. (2016) IMU-based Determination of Stance Duration During Sprinting. Procedia Engineering, 147, pp. 747–752. doi.org/10.1016/j.proeng.2016.06.330.
- Machulik, M., et al. (2020) Validation of an inertial measurement unit based magnetic timing gate system during running and sprinting. Deutsche Zeitschrift für Sportmedizin, 71, pp. 69–75.
- Kim, M & Lee, D (2017) Development of an IMU-based foot-ground contact detection (FGCD) algorithm. Ergonomics, 60, pp. 384–403. doi.org/10.1080/00140139.2016.1174314.
- Dehzangi, O., et al. (2017) IMU-Based Gait Recognition Using Convolutional Neural Networks and Multi-Sensor Fusion. Sensors, 17, p. 2735. doi.org/10.3390/s17122735.
- Zhao, H., et al. (2019) Adaptive gait detection based on foot-mounted inertial sensors and multi-sensor fusion. Information Fusion, 52, pp. 157–166. doi.org/10.1016/j.inffus.2019.03.002.
- Bailey, G P & Harle, R (2014) Assessment of Foot Kinematics During Steady State Running Using a Foot-mounted IMU. Procedia Engineering, 72, pp. 32–37. doi.org/10.1016/j.proeng.2014.06.009.
- Falbriard, M., et al. (2021) Running Speed Estimation Using Shoe-Worn Inertial Sensors: Direct Integration, Linear, and Personalized Model. Frontiers in Sports and Active Living, 3, p. 585809. doi.org/10.3389/fspor.2021.585809.
- Baumgartner, T., et al. (2021) Limitations of Foot-Worn Sensors for Assessing Running Power. Sensors, 21, p. 4952. doi.org/10.3390/s21154952.
- Ammann, R., et al. (2016) Accuracy of PARTwear Inertial Sensor and Optojump Optical Measurement System for Measuring Ground Contact Time During Running. Journal of Strength and Conditioning Research, 30, pp. 2057–2063. https://doi.org/10.1519/JSC.0000000000001299.
- Falbriard, M., et al. (2018) Accurate Estimation of Running Temporal Parameters Using Foot-Worn Inertial Sensors. Frontiers in Physiology, 9, p. 610. doi.org/10.3389/fphys.2018.00610.
- Bergamini, E., et al. (2012) Estimation of temporal parameters during sprint running using a trunk-mounted inertial measurement unit. Journal of Biomechanics, 45, pp. 1123–1126. doi.org/10.1016/j.jbiomech.2011.12.020.
- Bergamini, E., et al. (2013) Trunk inclination estimate during the sprint start using an inertial measurement unit: A validation study. Journal of Applied Biomechanics, 29, pp. 622–627. doi.org/10.1123/jab.29.5.622.
- Setuain, I., et al. (2018) Sprint mechanics evaluation using inertial sensor-based technology: A laboratory validation study. Scandinavian Journal of Medicine & Science in Sports, 28, pp. 463–472. doi.org/10.1111/sms.12946.
- Macadam, P., et al. (2019) Quantification of the validity and reliability of sprint performance metrics computed using inertial sensors: A systematic review. Gait & Posture, 73, pp. 26–38. doi.org/10.1016/j.gaitpost.2019.07.123.
- Singh, P., et al. (2021) Measuring Gait Velocity and Stride Length with an Ultrawide Bandwidth Local Positioning System and an Inertial Measurement Unit. Sensors, 21, p. 2896. doi.org/10.3390/s21092896.
- Falbriard, M., et al. (2020) Hurdle Clearance Detection and Spatiotemporal Analysis in 400 Meters Hurdles Races Using Shoe-Mounted Magnetic and Inertial Sensors. Sensors, 20, p. 354. doi.org/10.3390/s20020354.
- Schmidt, M., et al. (2020) Comment on “Hurdle Clearance Detection and Spatiotemporal Analysis in 400 Meters Hurdles Races Using Shoe-Mounted Magnetic and Inertial Sensor.” Sensors, 20, p. 2995. doi.org/10.3390/s20102995.
- Gindre, C., et al. (2016) Reliability and validity of the Myotest® for measuring running stride kinematics. Journal of Sports Sciences, 34, pp. 664–670. doi.org/10.1080/02640414.2015.1068436.
- Lienhard, K., et al. (2013) Validity of the Optogait photoelectric system for the assessment of spatiotemporal gait parameters. Medical Engineering & Physics, 35, pp. 500–504. doi.org/10.1016/j.medengphy.2012.06.015.
- Alvarez, D., et al. (2017) Validation of the Photoelectric Optogait System to Measure Racewalking Biomechanical Parameters on a Treadmill. ISBS - Conference Proceedings Archive, 35, p. 253.