Metabolic disorders are often associated with typical odors that can be identified in exhaled breath, sweat, or other human excrements. Ammonia odor, which is associated with renal diseases, and acetone odor, which is associated with diabetes, are two examples.
Image Credit: mi_viri/Shutterstock.com
Advancements in materials, sensors, electronics, and signal processing technologies have led to an exponential increase in the implementation and advancement of e-noses in recent decades. In many areas of science and industry, e-noses are used to analyze, identify, distinguish, categorize, and evaluate gas components or odors, among other things, and are of interest for a variety of applications.
For instance, in the food and beverage industry, e-noses are used to track production and define the quality of the finished product, while in pharmaceutical science, e-noses are used for formulation development and quality confirmation, as well as for air quality monitoring. Furthermore, e-noses are used in agriculture, water management, medicine, security systems, and a variety of other fields.
As a result, the focus of research published in the MDPI journal Biosensors was to see if liver dysfunction is generally recognized and if the level of abnormality can be classified using a wearable semiconducting MOx gas sensor-based e-nose in the context of experimental research.
Methodology
A system called “LiverTracer” was created as part of this research. It is based on an e-nose system that identifies and categorizes changes in VOCs from exhaled breath caused by liver issues and problems. As shown in Figure 1, this system consists of a measuring head that houses the sensor array and acts as a foundation for measurement control and data analysis.
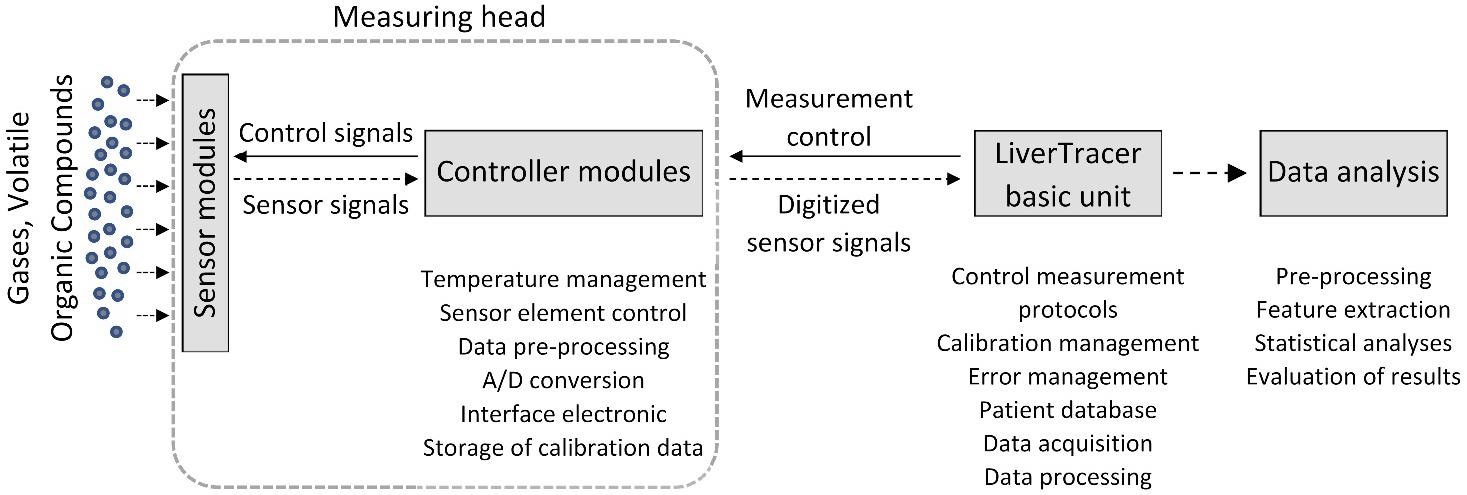
Figure 1. Setup of the electronic nose system “LiverTracer.” Image Credit: Voss, et al. 2022
The basic unit was a “SPIROSTIK COMPLETE” spirometer. It includes a computer running Windows 10. This device was altered to meet the needs of the researcher.
On the software side, sensor management, data management, operator assistance (semi-automatic patient measurement), and data analysis were developed and integrated. Whereas, on the hardware side, the pump system for rinsing and readjusting the measuring head was developed and integrated. Figure 2 depicts the measurement regime’s basic principles.
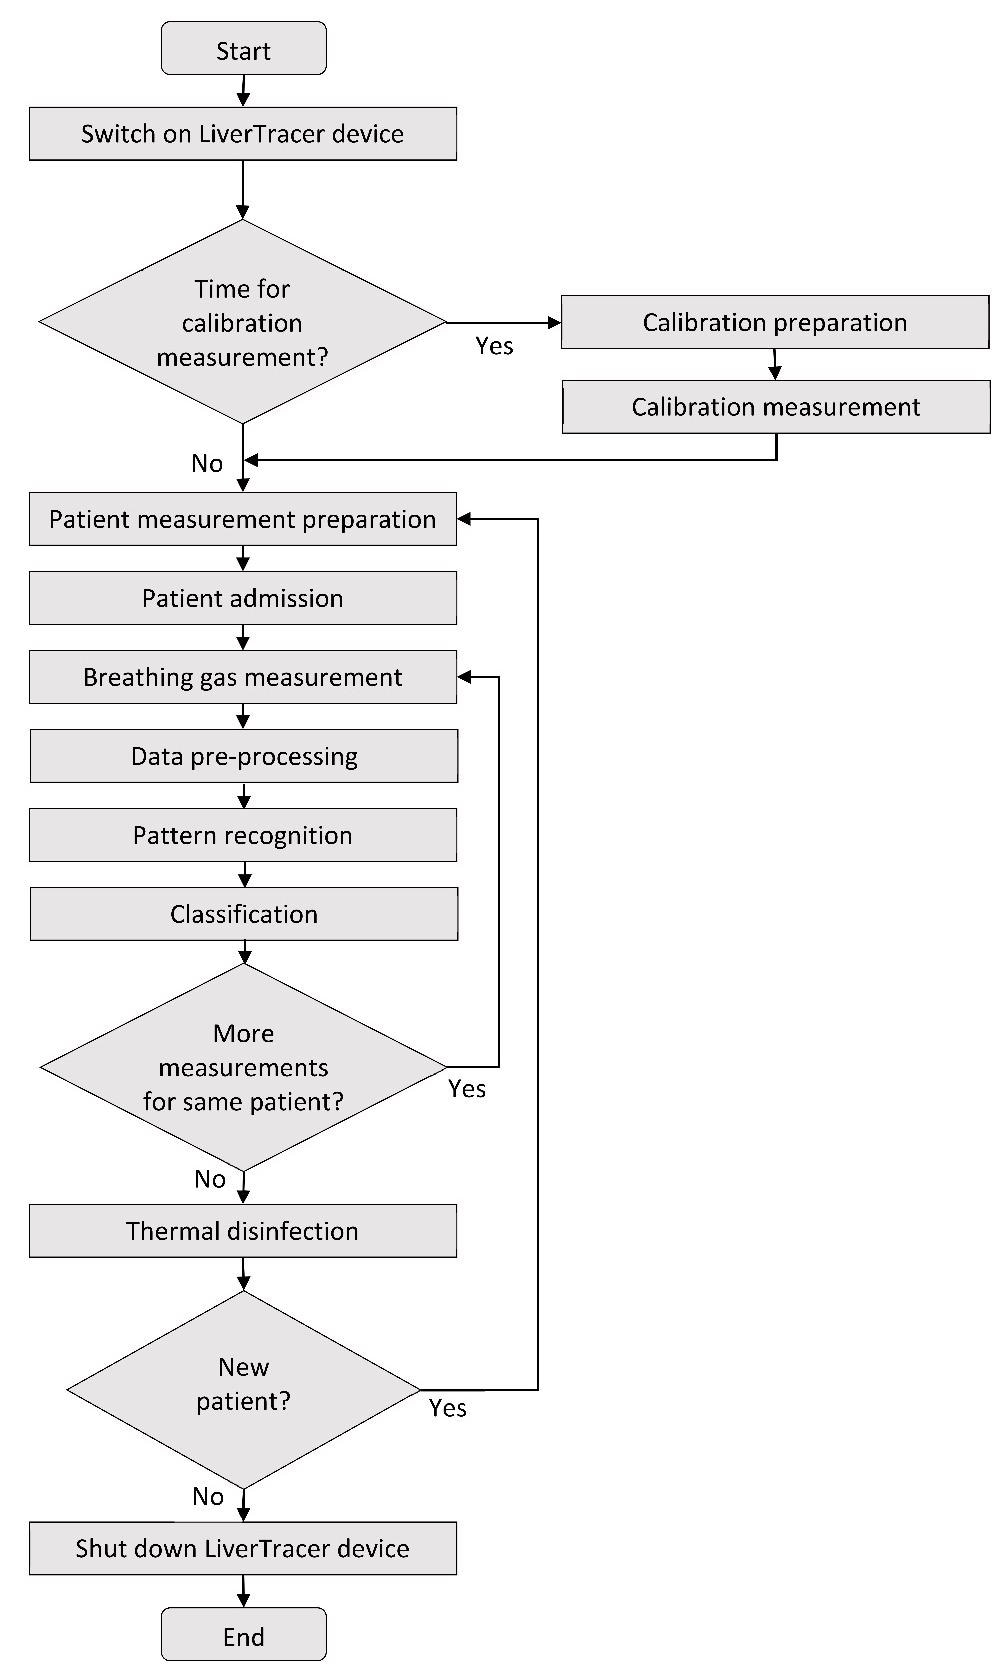
Figure 2. Flow chart of the LiverTracer measurement regime. Image Credit: Voss, et al. 2022
MATLAB R2019a was used to analyze the data. Outliers, technical issues, artifacts, and measurement errors were identified in the nine raw resistance waveforms. There were no measurements that had to be discarded. The relevant 30-second segments were derived from the measurement for the analysis of the corresponding breathing air segments, as shown in Figure 3b, and are denoted by vertical dashed lines.
This was done automatically based on the temperature measurement protocol, which clearly shows where the breath measurement begins and ends in Figure 3a, “bc1” and “bc2.”
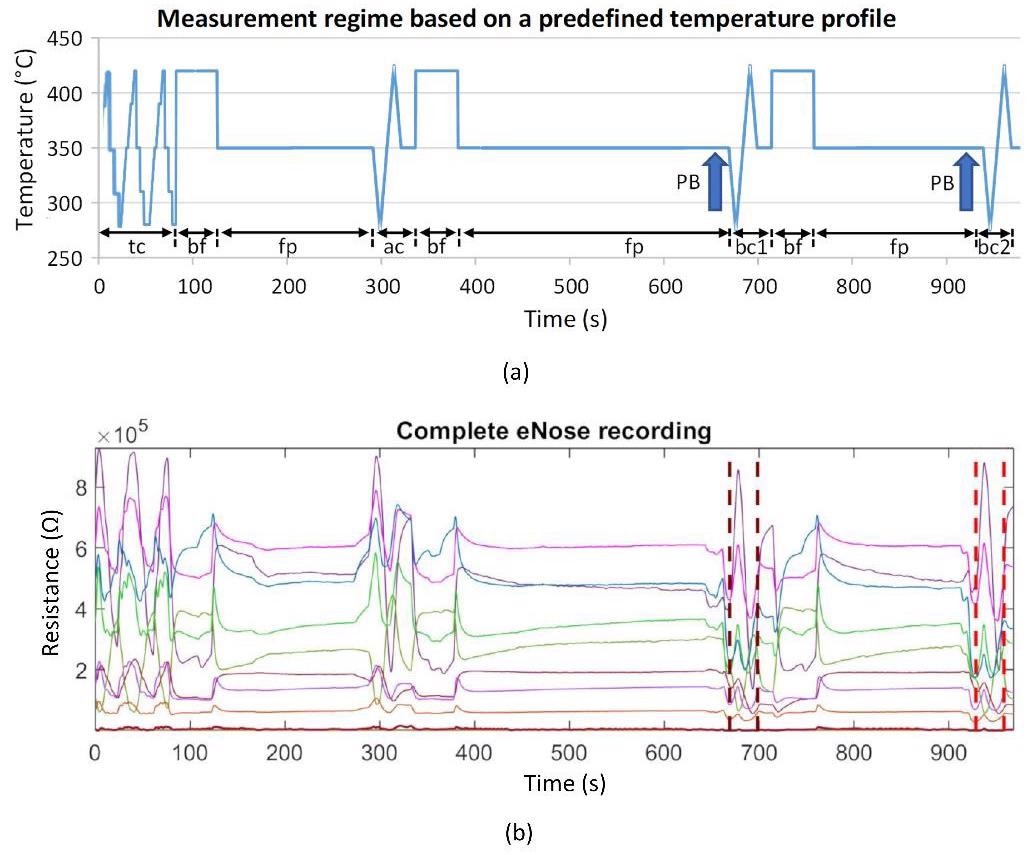
Figure 3. (a) Schematic representation of the measurement protocol based on a predefined temperature control of the sensor heater. It contains time-variable cyclic thermal cleaning cycles “tc,” burn-off cleaning phases “bf” (rectangle functions), subsequent flushing phases “fp” (horizontal lines), one ambient air measurement cycle “ac,” and two breathing gas measurement cycles “bc1” and “bc2.” The arrows mark the exhalation cycles (patient breathing: PB); (b) example of a recording of 9 sensor layer resistance curves. Vertical dashed lines mark the two breathing gas measurements. Image Credit: Voss, et al. 2022
The data analysis is on the basis of the extraction of 10 features (in the time and nonlinear dynamics domains) from the resistance time series of the derived breathing gas measurement loops for every sensor layer. Figure 4 depicts the characteristics computed in this domain.
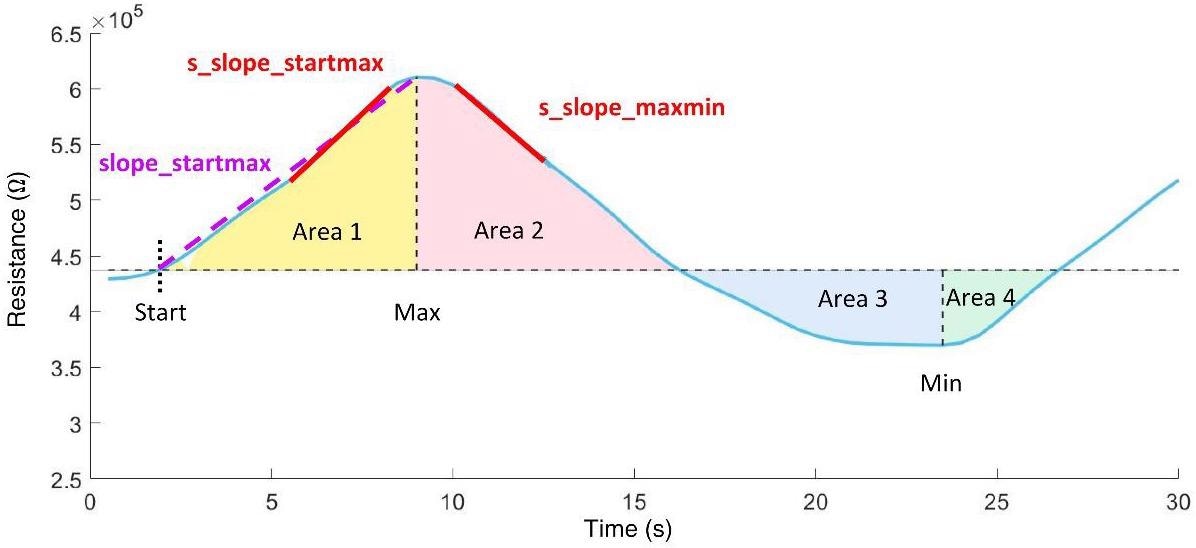
Figure 4. Time domain features extracted from the resistance curve of an exhalation cycle. Image Credit: Voss, et al. 2022
Between October 2019 and March 2020, 30 people were enrolled in the study, with 10 being healthy controls, 10 having compensated cirrhosis, and 10 having decompensated cirrhosis. The observations revealed that vital parameters at inclusion did not vary between these groups, as shown in Table 1.
Table 1. Patient data (values in parentheses represent the respective minimum and maximum values or describe percentages). Source: Voss, et al. 2022
| |
Control (n = 10) |
Compensated
Cirrhosis (n = 10) |
Decompensated
Cirrhosis (n = 10) |
p-Value |
| Sex (f/m) |
5/5 |
3/7 |
2/8 |
0.500 |
| Age (years) |
58 (51; 65) |
57 (52; 64) |
62 (56; 67) |
0.543 |
| Bodyweight (kg) |
81 (68; 96) |
94 (79; 101) |
80 (68; 97) |
0.136 |
| Height (cm) |
175 (167; 178) |
176 (167; 178) |
176 (169; 181) |
0.712 |
| Smoker (n,%) |
1 (10%) |
4 (40%) |
3 (30%) |
0.450 |
Vital signs
RR systolic (mmHg) |
135 (118; 161) |
126 (107; 155) |
122 (103; 136) |
0.266 |
| RR diastolic (mmHg) |
81 (76; 104) |
76 (61; 92) |
72 (63; 79) |
0.146 |
| Heart rate (pbm) |
78 (67; 102) |
85 (71; 88) |
92 (81; 104) |
0.212 |
| Temperature (°C) |
36.8 (3.4; 37.0) |
36.6 (36.1; 37.0) |
36.7 (36.4; 37.1) |
0.523 |
Etiology of cirrhosis (n,%)
Ethanol |
N/A |
6 (60%) |
8 (80%) |
0.628 |
| Other |
N/A |
4 (40%) |
2 (20%) |
|
Co-medication (n,%)
Lactulose |
1 (10%) |
3 (30%) |
8 (80%) |
0.009 |
| Proton pump inhibitors |
5 (50%) |
7 (70%) |
9 (90%) |
0.262 |
| B-Blocker |
5 (50%) |
4 (40%) |
5 (50%) |
0.897 |
| Antibiotics |
1 (10%) |
3 (30%) |
7 (70%) |
0.016 |
| - Rifaximin |
0 |
1 (10%) |
6 (60%) |
|
| - other |
1(10%) |
2 (20%) |
1 (10%) |
|
f—females; m—males; n—number of patients; p—significance.
Results and Discussion
Tables 2 and 3 show the classification results of the LiverTracer e-nose. The detachment of the patient groups from the controls, as shown in Table 2, was 100% successful for each case. Between the patient groups, a 95% correct classification rate was achieved, with 90% of the DECOMP group and 100% of the COMP group correctly classified.
Table 3 displays the descriptive statistics of sensor characteristics that were instantly chosen by the discriminant analysis to achieve the best detachment outcomes.
Table 2. Percentage classification rate of e-nose features. The optimal parameter set (consisting of either double or triple sets) is shown for each group comparison. Source: Voss, et al. 2022
| Group |
Features |
SENS |
SPEC |
ACC |
AUC |
| CON—COMP |
RS11_s_slope_maxmin (Ohm/s)
RS32_area3sec_9 (Ohm·s)
RS32_p00 |
1.00 |
1.00 |
1.00 |
1.00 |
| CON—DECOMP |
RS31_slope_startmax (Ohm/s)
RS32_s_slope_startmax_pos (s)
RS33_p00 |
1.00 |
1.00 |
1.00 |
1.00 |
| COMP—DECOMP |
RS32_Renyi4_entropy (bit)
RS33_area2 (Ohm·s) |
0.90 |
1.00 |
0.95 |
0.97 |
CON—control group; COMP—patients with compensated cirrhosis; DECOMP—patients with decompensated cirrhosis; RSxy—R denotes resistance measurement values of sensor layer y of sensor Sx (e.g., RS12 describes the resistance readings of sensor layer 2 of sensor S1); SENS— sensitivity; SPEC—specificity; ACC—Accuracy; AUC—area under the receiver operator characteristic curve.
Table 3. Classification results of features automatically selected by discriminant analysis (mv—mean value, sd—standard deviation). Source: Voss, et al. 2022
| Group Test |
Features |
p |
CON
mv ± sd |
COMP
mv ± sd |
DECO
MP mv ± sd |
| CON vs. |
RS11_s_slope_maxmin (Ohm/s) |
0.046 |
-86,258 ± 5225 |
-81,023 ± 5676 |
|
| COMP |
RS32_area3sec_9 (Ohm·s) |
0.038 |
1,807,616 ± 207,540 |
2,071,884 ± 309,151 |
|
| |
RS32_p00 |
0.017 |
0.336 ± 0.050 |
0.276 ± 0.045 |
|
| CON vs. |
RS31_slope_startmax (Ohm/s) |
0.029 |
8901 ± 3207 |
|
6956 ± 1845 |
| DECOMP |
RS32_s_slope_startmax_pos (s) |
0.019 |
6.250 ± 1.161 |
|
6.900 ± 0.211 |
| |
RS33_p00 |
0.041 |
0.369 ± 0.045 |
|
0.319 ± 0.056 |
| COMP vs. |
RS32_Renyi4_entropy (bit) |
0.028 |
|
1.843 ± 0.386 |
2.179 ± 0.185 |
| DECOMP |
RS33_area2 (Ohm·s) |
0.131 |
|
48,252 ± 23,296 |
34,507 ± 14,547 |
CON—control group; COMP—patients with compensated cirrhosis; DECOMP—patients with decompensated cirrhosis; RSxy—R denotes the resistance measurement values of sensor layer y of sensor Sx (e.g., RS12 describes the resistance readings of sensor layer 2 of sensor S1); p—significance value; mv ± sd—mean value ± standard deviation.
Researchers included four clinical parameters for categorization in Table 4, which are based on the Child-Pugh score and portray multiple elements of liver disease, such as two laboratory values and two clinical aspects.
Table 4. Classification rate (in %) of the clinical parameters that achieved an overall accuracy for discriminating the groups greater than 50%. Source: Voss, et al. 2022
| |
Categorized Bilirubin |
Categorized INR |
Ascites |
Hepatic Encephalopathy |
| CON |
100 |
86 |
100 |
100 |
| COMP |
10 |
40 |
70 |
100 |
| DECOMP |
90 |
60 |
50 |
50 |
| ACC |
63 |
59 |
73 |
83 |
CON—control group; COMP—patients with compensated cirrhosis; DECOMP—patients with decompensated cirrhosis; INR—international normalized ratio of blood clotting test; ACC—Accuracy.
This exploratory pilot study collected and analyzed distinctive VOC fingerprints in patients’ breath and delivers strong indications that VOC analysis using MOx sensors is a significant diagnostic technique for finding various degrees of liver failure.
The findings from the current study are very promising, indicating that the MOx multisensory signals are primarily useful in the analysis of breath changes and, thus, for the recognition of liver dysfunctions. MOx semiconductor sensors are the most common sensors used in e-noses for diagnostic purposes.
They have good sensitivity, are long-lasting, and, perhaps most notably, are reasonably priced. When considering major commercial deployment, price is an important consideration, particularly in developing countries. Furthermore, since they can operate in a broad range of relative humidity, they are ideal for outdoor usage.
Conclusion
The multisensory analyses conducted in this study using a wearable MOx sensor array demonstrated high detachment accuracies ranging from 95% to 100% between the studied groups.
It was not only useful to distinguish liver dysfunctions of varying severity from controls at 100%, but also to differentiate between the severities of liver dysfunction at 95% with 100% accurate identification of all COMP cirrhosis and 90% correct identification of all DECOMP cirrhosis.
When merged with nonlinear sensor signal processing, the wearable e-nose system for detecting disease—in this case, liver dysfunction—offers numerous advantages over traditional laboratory testing and the use of other sensor systems.
Journal Reference:
Voss, A., Schroeder, R., Schulz, S., Haueisen, J., Vogler, S., Horn, P., Stallmach, A., Reuken, P. (2022) Detection of Liver Dysfunction Using a Wearable Electronic Nose System Based on Semiconductor Metal Oxide Sensors. Biosensors, 12(2), p. 70. Available Online: https://www.mdpi.com/2079-6374/12/2/70.
References and Further Reading
- Hartman, J A (1954) possible objective method for the rapid estimation of flavors in vegetables. Proceedings of the American Society for Horticultural Science, 64, pp. 335–342.
- Wilkens, W F & Hartman, J D (1964) An Electronic Analog for the Olfactory Processes. Annals of the New York Academy of Sciences, 116, pp. 608–612. doi.org/10.1111/j.1749-6632.1964.tb45092.x.
- Dodd, G. H., et al. (1991) Odours—The stimulus for an electronic nose. In Proceedings of the NATO Advanced Research Workshop on Sensors and Sensory Systems for an Electronic Nose, Reykjavik, Iceland, 5–8 August; pp. 1–11.
- Moncrieff, R W (1961) An instrument for measuring and classifying odors. Journal of Applied Physiology, 16, pp. 742–749. doi.org/10.1152/jappl.1961.16.4.742.
- Henderson, M J (1952) Acetone in the breath; a study of acetone exhalation in diabetic and nondiabetic human subjects. Diabetes, 1, pp. 188–193. doi.org/10.2337/diab.1.3.188
- Gardner, J W & Vincent, T A (2016) Electronic Noses for Well-Being: Breath Analysis and Energy Expenditure. Sensors, 16, p. 947. doi.org/10.3390/s16070947.
- Farraia, M V (2019) The electronic nose technology in clinical diagnosis: A systematic review. Port Biomedical Journal, 4, p. e42. doi.org/10.1097/j.pbj.0000000000000042.
- Wasilewski, T., et al. (2019) Critical review of electronic nose and tongue instruments prospects in pharmaceutical analysis. Analytica Chimica Acta, 1077, pp. 14–29. doi.org/10.1016/j.aca.2019.05.024.
- Wilson, A D & Baietto, M (2011) Advances in electronic-nose technologies developed for biomedical applications. Sensors (Basel), 11, pp. 1105–1176. doi.org/10.3390/s110101105.
- Majchrzak, T., et al. (2018) Electronic noses in classification and quality control of edible oils: A review. Food Chemistry, 246, pp. 192–201. doi.org/10.1016/j.foodchem.2017.11.013.
- Tan, J & Xu, J (2020) Applications of electronic nose (e-nose) and electronic tongue (e-tongue) in food quality-related properties determination: A review. Artificial Intelligence in Agriculture, 4, pp. 104–115. doi.org/10.1016/j.aiia.2020.06.003.
- He, J., et al. (2017) A high precise E-nose for daily indoor air quality monitoring in living environment. Integration, 58, pp. 286–294. doi.org/10.1016/j.vlsi.2016.12.010.
- Karakaya, D., et al. (2020) Electronic Nose and Its Applications: A Survey. International Journal of Automation and Computing, 17, pp. 179–209. doi.org/10.1007/s11633-019-1212-9.
- Gardner, J. W., et al (1994) A brief history of electronic noses. Sensors and Actuators B: Chemical, 18, pp. 211–220. doi.org/10.1016/0925-4005(94)87085-3.
- Gupta, A., et al. (2018) MEMS sensor array-based electronic nose for breath analysis-a simulation study. Journal of Breath Research, 13, p. 016003. doi.org/10.1088/1752-7163/aad5f1.
- Wojnowski, W., et al. (2019) Electronic Noses in Medical Diagnostics. Current Medicinal Chemistry, 26, pp. 197–215. doi.org/10.2174/0929867324666171004164636.
- Wilson, A D (2015) Advances in electronic-nose technologies for the detection of volatile biomarker metabolites in the human breath. Metabolites, 5, pp. 140–163. doi.org/10.3390/metabo5010140.
- Voss, A., et al. (2014) Detecting cannabis use on the human skin surface via an electronic nose system. Sensors, 14, pp. 13256–13272. doi.org/10.3390/s140713256.
- Voss, A., et al. (2005) Smelling renal dysfunction via electronic nose. Annual Review of Biomedical Engineering, 33, pp. 656–660. doi.org/10.1007/s10439-005-1438-2.
- Wang, P., et al. (1997) A novel method for diabetes diagnosis based on electronic nose. Biosensors and Bioelectronics, 12, pp. 1031–1036. doi.org/10.1016/s0956-5663(97)00059-6.
- Dragonieri, S., et al. (2017) Electronic Nose Technology in Respiratory Diseases. Lung, 195, pp. 157–165. doi.org/10.1007/s00408-017-9987-3.
- Baldini, C., et al. (2020) Electronic Nose as a Novel Method for Diagnosing Cancer: A Systematic Review. Biosensors, 10, pp. 84. doi.org/10.3390/bios10080084.
- Capelli, L., et al. (2016) Application and Uses of Electronic Noses for Clinical Diagnosis on Urine Samples: A Review. Sensors (Basel), 16, p. 1708. doi.org/10.3390/s16101708.
- Voss, A., et al. (2012) Smelling heart failure from human skin odor with an electronic nose. Annual International Conference of the IEEE Engineering in Medicine and Biology Society, pp. 4034–4037. doi.org/10.1109/EMBC.2012.6346852.
- European Association for the Study of the Liver. EASL Clinical Practice Guidelines for the management of patients with decompensated cirrhosis. Journal of Hepatology, 69, pp. 406–460. doi.org/10.1016/j.jhep.2018.03.024.
- Moreau, R., et al. (2013) Acuteon-chronic liver failure is a distinct syndrome that develops in patients with acute decompensation of cirrhosis. Gastroenterology, 144, pp. 1426–1437. doi.org/10.1053/j.gastro.2013.02.042.
- Trebicka, J., et al. (2020) The PREDICT study uncovers three clinical courses of acutely decompensated cirrhosis that have distinct pathophysiology. Journal of Hepatology, 73, pp. 842–854. doi.org/10.1016/j.jhep.2020.06.013.
- Millonig, G., et al. (2010) Liver stiffness is directly influenced by central venous pressure. Journal of Hepatology, 52, pp. 206–210. doi.org/10.1016/j.jhep.2009.11.018.
- Kamath, P. S., et al. (2001) A model to predict survival in patients with end-stage liver disease. Hepatology (Baltimore Md.), 33, pp. 464–470. doi.org/10.1053/jhep.2001.22172.
- De Vincentis, A., et al. (2017) Breath-print analysis by e-nose may refine risk stratification for adverse outcomes in cirrhotic patients. Liver International, 37, pp. 242–250. doi.org/10.1111/liv.13214.
- Behera, B., et al. (2019) Electronic nose: A non-invasive technology for breath analysis of diabetes and lung cancer patients. Journal of Breath Research, 13, p. 024001. doi.org/10.1088/1752-7163/aafc77.
- Kiesewetter, O., et al. (2004) Arrangement for the Detection of Air Constituents and Method for Operating the Arrangement. DE102004060101 B4.
- Kiesewetter, O., et al. (2005) Assembly for Detecting Air Components. EP 1602924 B1, 02-Jun.
- Kittelmann, S., et al. (2006) Air Content Detection Arrangement for Use in e.g. Building, HAS EVALUating Unit with Evaluating Resistance That Is Connected in Parallel with Individual or Combinations of Effective Resistances of Set of Operating Layers Connected with Unit. DE 102006033528 B3, 20-July.
- Witt, K., et al. (2013) Electronic nose detects heart failure from exhaled breath. Biomed. Tech. (Berl.), 58 (Suppl. S1). doi.org/10.1515/bmt-2013-4145.
- Kurths, J., et al. (1995) Quantitative analysis of heart rate variability. Chaos, 5, pp. 88–94. doi.org/10.1063/1.166090.
- Voss, A., et al. (1996) The application of methods of non-linear dynamics for the improved and predictive recognition of patients threatened by sudden cardiac death. Cardiovascular Research, 31, pp. 419–433.
- Sturges, H A (1926) The Choice of a Class Interval. Journal of the American Statistical Association, 21, pp. 65–66. doi.org/10.1080/01621459.1926.10502161.
- Hunt, S A (2005) ACC/AHA 2005 guideline update for the diagnosis and management of chronic heart failure in the adult: A report of the American College of Cardiology/American Heart Association Task Force on Practice Guidelines (Writing Committee to Update the 2001 Guidelines for the Evaluation and Management of Heart Failure). Journal of the American College of Cardiology, 46, pp. e1–e82. doi.org/10.1016/j.jacc.2005.08.022.
- Patel, A. R., et al. (2019) Global Initiative for Chronic Obstructive Lung Disease: The Changes Made. Cureus, 11, p. e4985. doi.org/10.7759/cureus.4985.
- Child, C. G., et al. (1964) Surgery and portal hypertension. The Liver and Portal Hypertension. WB Saunders; Philadelphia, PA, 50-64.
- Parikh, N. D., et al. (2019) Outcomes of Patients With Cirrhosis Undergoing Orthopedic Procedures: An Analysis of the Nationwide Inpatient Sample. Journal of Clinical Gastroenterology, 53, pp. e356–e361. doi.org/10.1097/MCG.0000000000001091.
- Wong, M., et al. (2019) Surgery in Patients with Portal Hypertension. Clinical Liver Disease, 23, pp. 755–780. doi.org/10.1016/j.cld.2019.07.003.
- Germanese, D., et al. (2019) An E-Nose for the Monitoring of Severe Liver Impairment: A Preliminary Study. Sensors, 19, 3656. doi.org/10.3390/s19173656.
- Arasaradnam, R. P., et al. (2016) Breathomics--exhaled volatile organic compound analysis to detect hepatic encephalopathy: A pilot study. Journal of Breath Research, 10, p. 016012. doi.org/10.1088/1752-7155/10/1/016012.
- Qin, T., et al. (2010) The screening of volatile markers for hepatocellular carcinoma. Cancer Epidemiology, Biomarkers & Prevention, 19, pp. 2247–2253. doi.org/10.1158/1055-9965.EPI-10-0302.
- De Vincentis, A., et al. (2019) Exhaled breath analysis in hepatology: State-of-the-art and perspectives. World Journal of Gastroenterology, 25, pp. 4043–4050. doi.org/10.3748/wjg.v25.i30.4043.
- De Vincentis, A., et al. (2016) Breath-print analysis by e-nose for classifying and monitoring chronic liver disease: A proof-of-concept study. Scientific Reports, 6, p. 25337. doi.org/10.1038/srep25337.
- Esfahani, S., et al. (2020) Development of a Tuneable NDIR Optical Electronic Nose. Sensors, 20, p. 6875. doi.org/10.3390/s20236875.
- Ruffer, D., et al. (2018) New Digital Metal-Oxide (MOx) Sensor Platform. Sensors, 18, 1052. doi.org/10.3390/s18041052.
- Padilla, M., et al. (2010) Drift compensation of gas sensor array data by Orthogonal Signal Correction. Chemometrics and Intelligent Laboratory Systems, 100, pp. 28–35. doi.org/10.1016/j.chemolab.2009.10.002.
- Wilson, A D (2018) Application of Electronic-Nose Technologies and VOC-Biomarkers for the Noninvasive Early Diagnosis of Gastrointestinal Diseases (dagger). Sensors, 18, p. 2613. doi.org/10.3390/s18082613.