With a surface area of 1.5–2 m2, the skin is the largest organ in the human body, making it more accessible as a diagnostic organ. As a result, it has been used as a matrix for multiple wearable sensing technologies to date. The stratum corneum (SC) is the epidermis’ outer layer, which has a diverse variety of biomarkers as well as a high metabolic activity.

Image Credit: Geinz Angelina/Shutterstock.com
Quantifying the quantities of various biomarkers found in skin fluid matrices, including interstitial fluid (ISF) and perspiration, can reveal important information about a person’s health.
ISF, for example, is being evaluated as a viable alternative to blood for obtaining disease-related systemic biomarkers. ISF contains small chemicals, such as lactate, glucose, cortisol, and urea, and examining their concentrations and flow patterns can reveal details about individual disorders.
Microneedles (MNs) were created recently to extract and collect ISF from the skin. However, since the studies were only conducted on mice, and human participant testing is still needed, this strategy is far from being therapeutically viable.
Sweat is a more easily accessible skin matrix that can be sampled without intrusive procedures. It can provide information about human health in a similar way to ISF by analyzing the biomarkers it carries. The SWEATCH wearable platform, which was built to gather and evaluate salt concentration in sweat in real-time, is a great example of this.
New research expands on the previous study by looking into the wearable sensor’s capacity to reliably detect skin surface pH, as well as the numerous elements that influence the measurement, such as gender, body site, measurement time, and topical skin therapy.
Methodology
A previously reported methodology was used to make the colorimetric sol-gel solution.
Before usage, 0.5 μL of BCG sol-gel solution were dropped as a single spot onto a 10% acetate cellulose thin-layer chromatography (TLC) plate (3 × 2 cm) and dried in a vacuum desiccator.
The RGB values of the individual spots were measured using ImageJ after the colorimetric sensor was built, scanned, and the RGB values of the individual spots were evaluated. The sensor was glued to the lid of a plastic petri dish (0.04 L) with Blu-Tack to evaluate the reaction of the sensor spots to ammonia.
The wearable platform was composed of a stainless steel woven wire mesh that defined the headspace (4 × 3 cm) and a cellulose substrate with six replicate BCG sensor locations on top.
As illustrated in Figure 1a, the sensor locations were coated with a polyethylene terephthalate (PET) film (5 × 4 cm) and the entire platform was sealed.
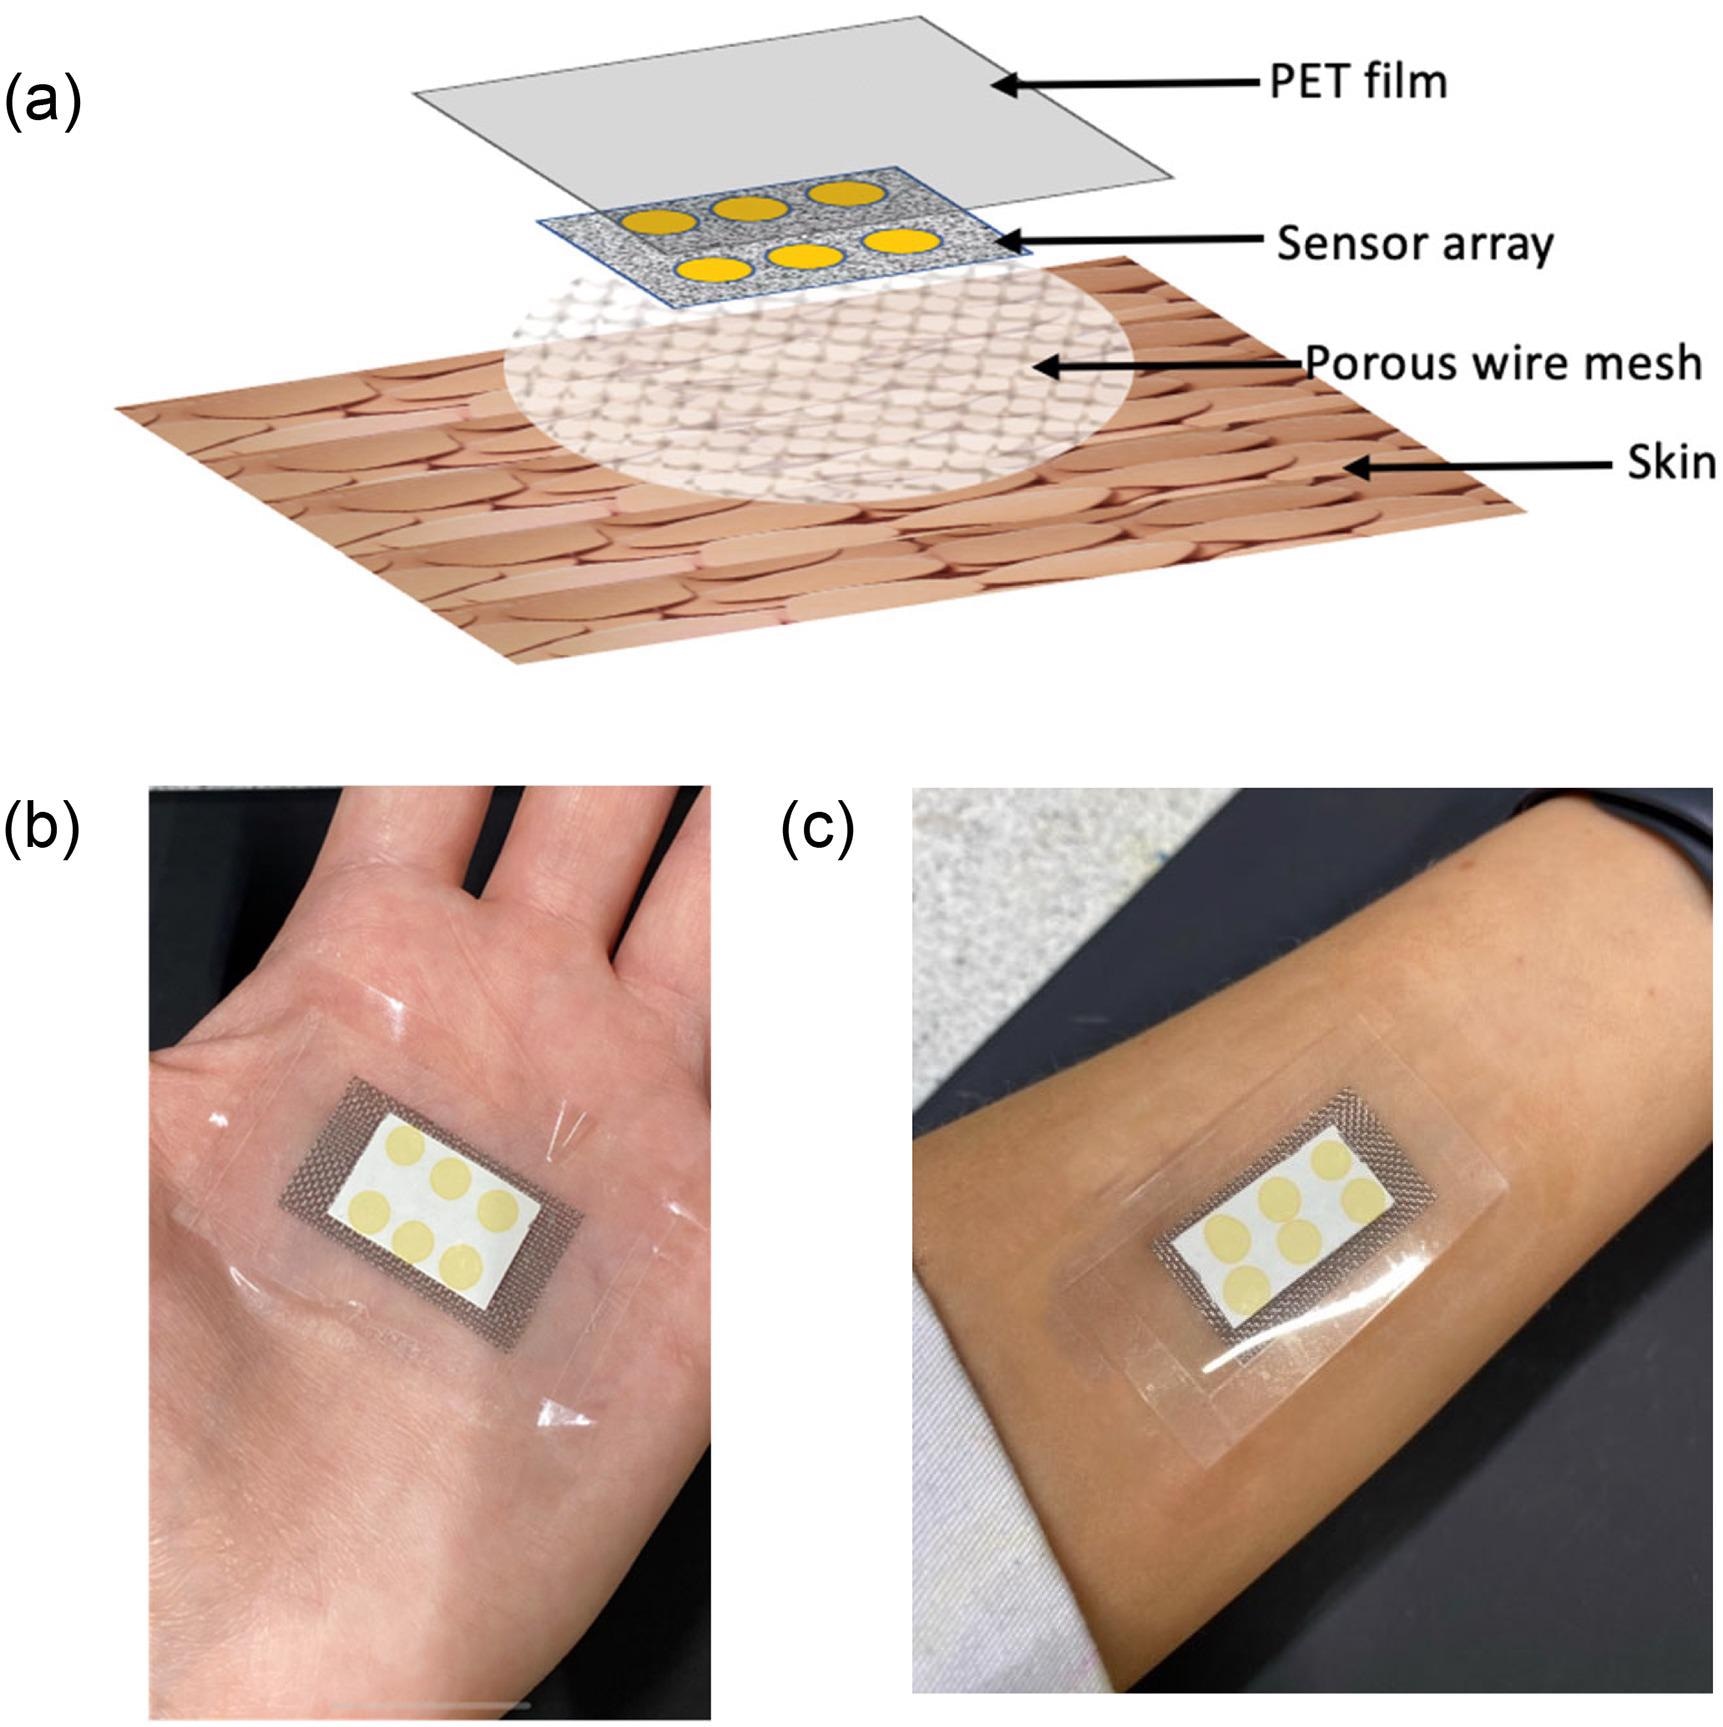
Figure 1. (a) Schematic of the different layers comprising the wearable platform applied to the skin surface; (b) image of wearable platform worn on palm; and (c) on the forearm. Image Credit: Shetewi, et al. 2021
This study enlisted ten healthy participants (five females and five males, ages 20–45). On the days of sample collection, volunteers were not allowed to use scents or beauty products on their bodies.
The study’s goal and objective were explained to participants, and they were requested to provide informed written consent.
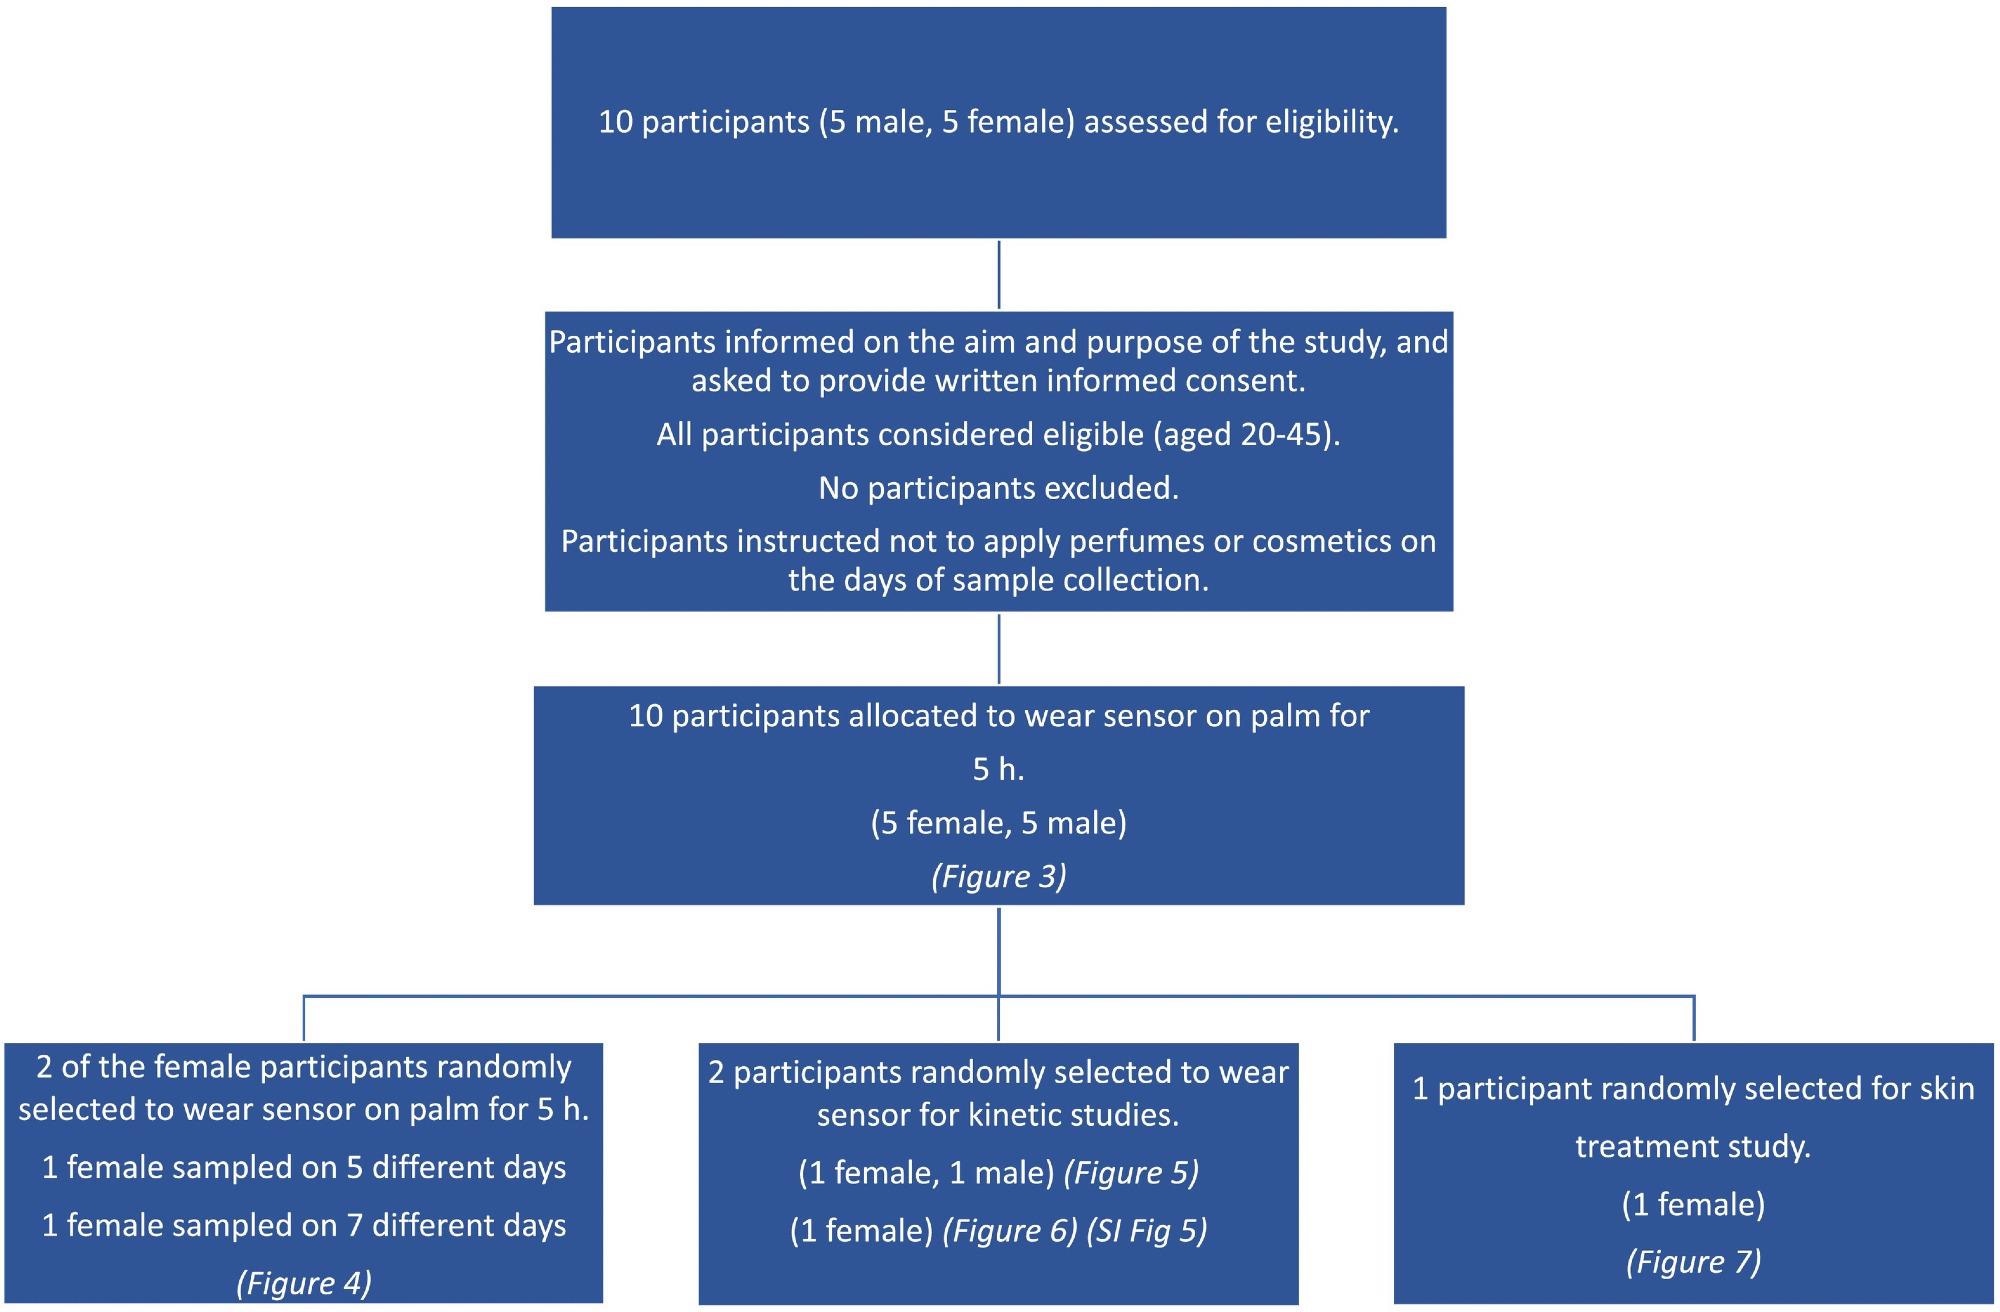
Scheme 1. Consort diagram showing the flowchart for the different aspects of the participant study. Image Credit: Finnegan, et al., 2022
Results and Discussion
The reaction behavior of sensor spots containing an integrated pH-sensitive dye as sensor spots worn just above the surface of the skin aiming for skin volatile emission, with the purpose of employing it to detect skin surface pH, was explored in this study.
To evaluate the dyes sensitivity to variations in pH over the necessary range, a test of the colorimetric response of produced BCG sol-gel solutions was carried out, as shown in Figure 2a.
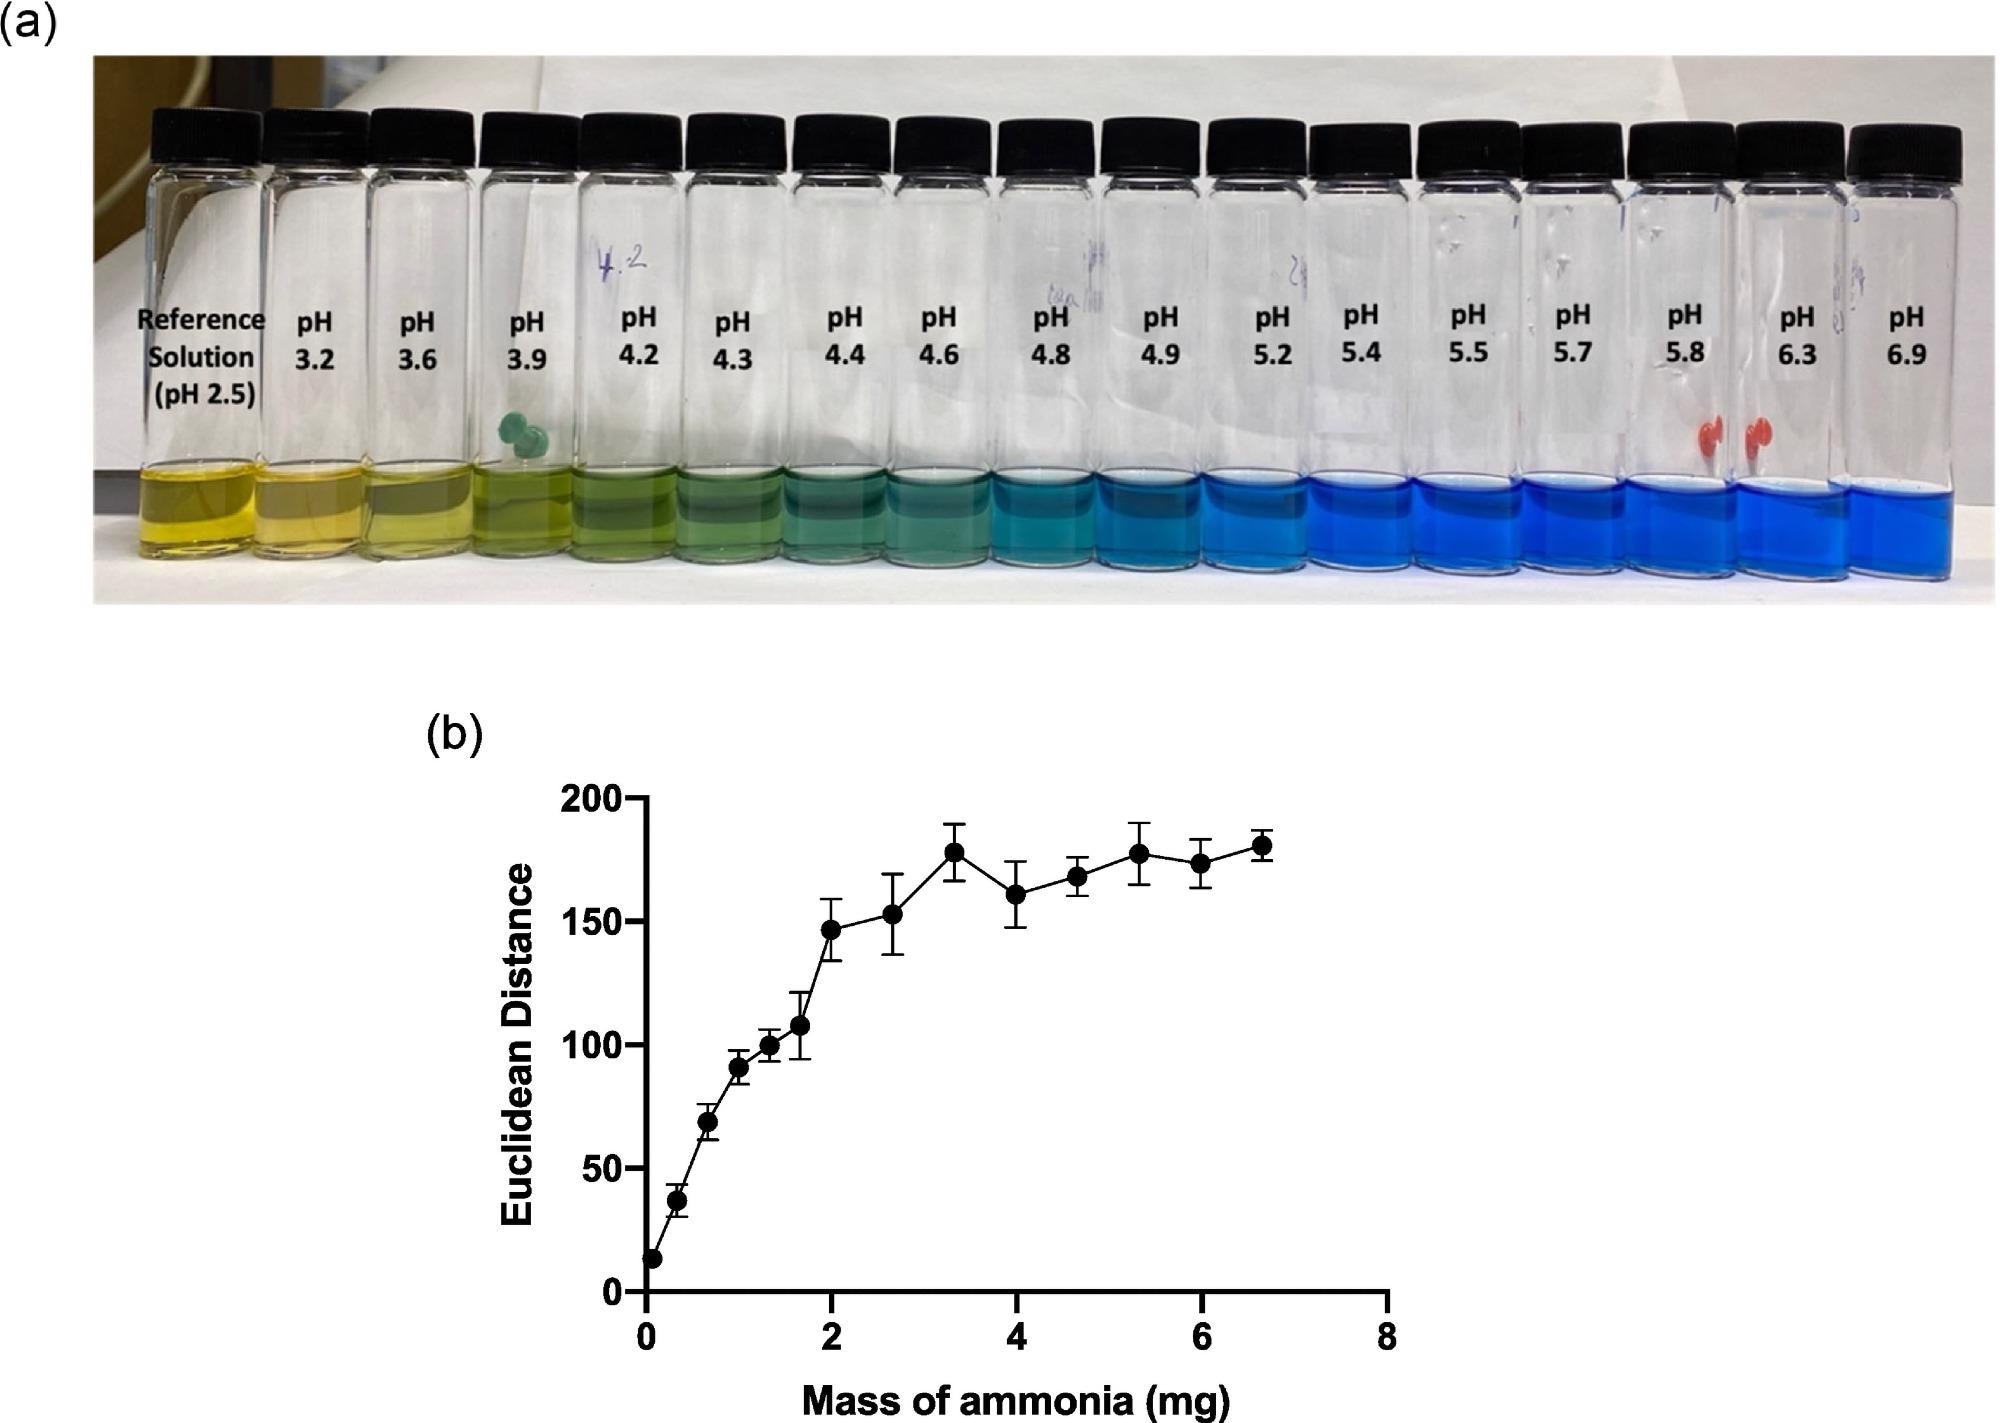
Figure 2. (a) Image of BCG sol-gel solutions across the pH range 2.5–6.9, and (b) graph showing average ED response as a function of mass of ammonia (mg) added to the HS that the sensor was exposed to. Error bars represent standard deviation in ED response from n = 6 sensor spots on a single substrate. Image Credit: Finnegan, et al., 2022
As illustrated in Figure 2b, a quantitative ammonia calibration plot was created based on sensor ED response, in connection with ED response detected up to a mass of approximately 2.5 mg ammonia.
Figure 3a illustrates the average color of the BCG sensor spots after being worn on the skin by five different female and five different male subjects with various skin surface pHs.
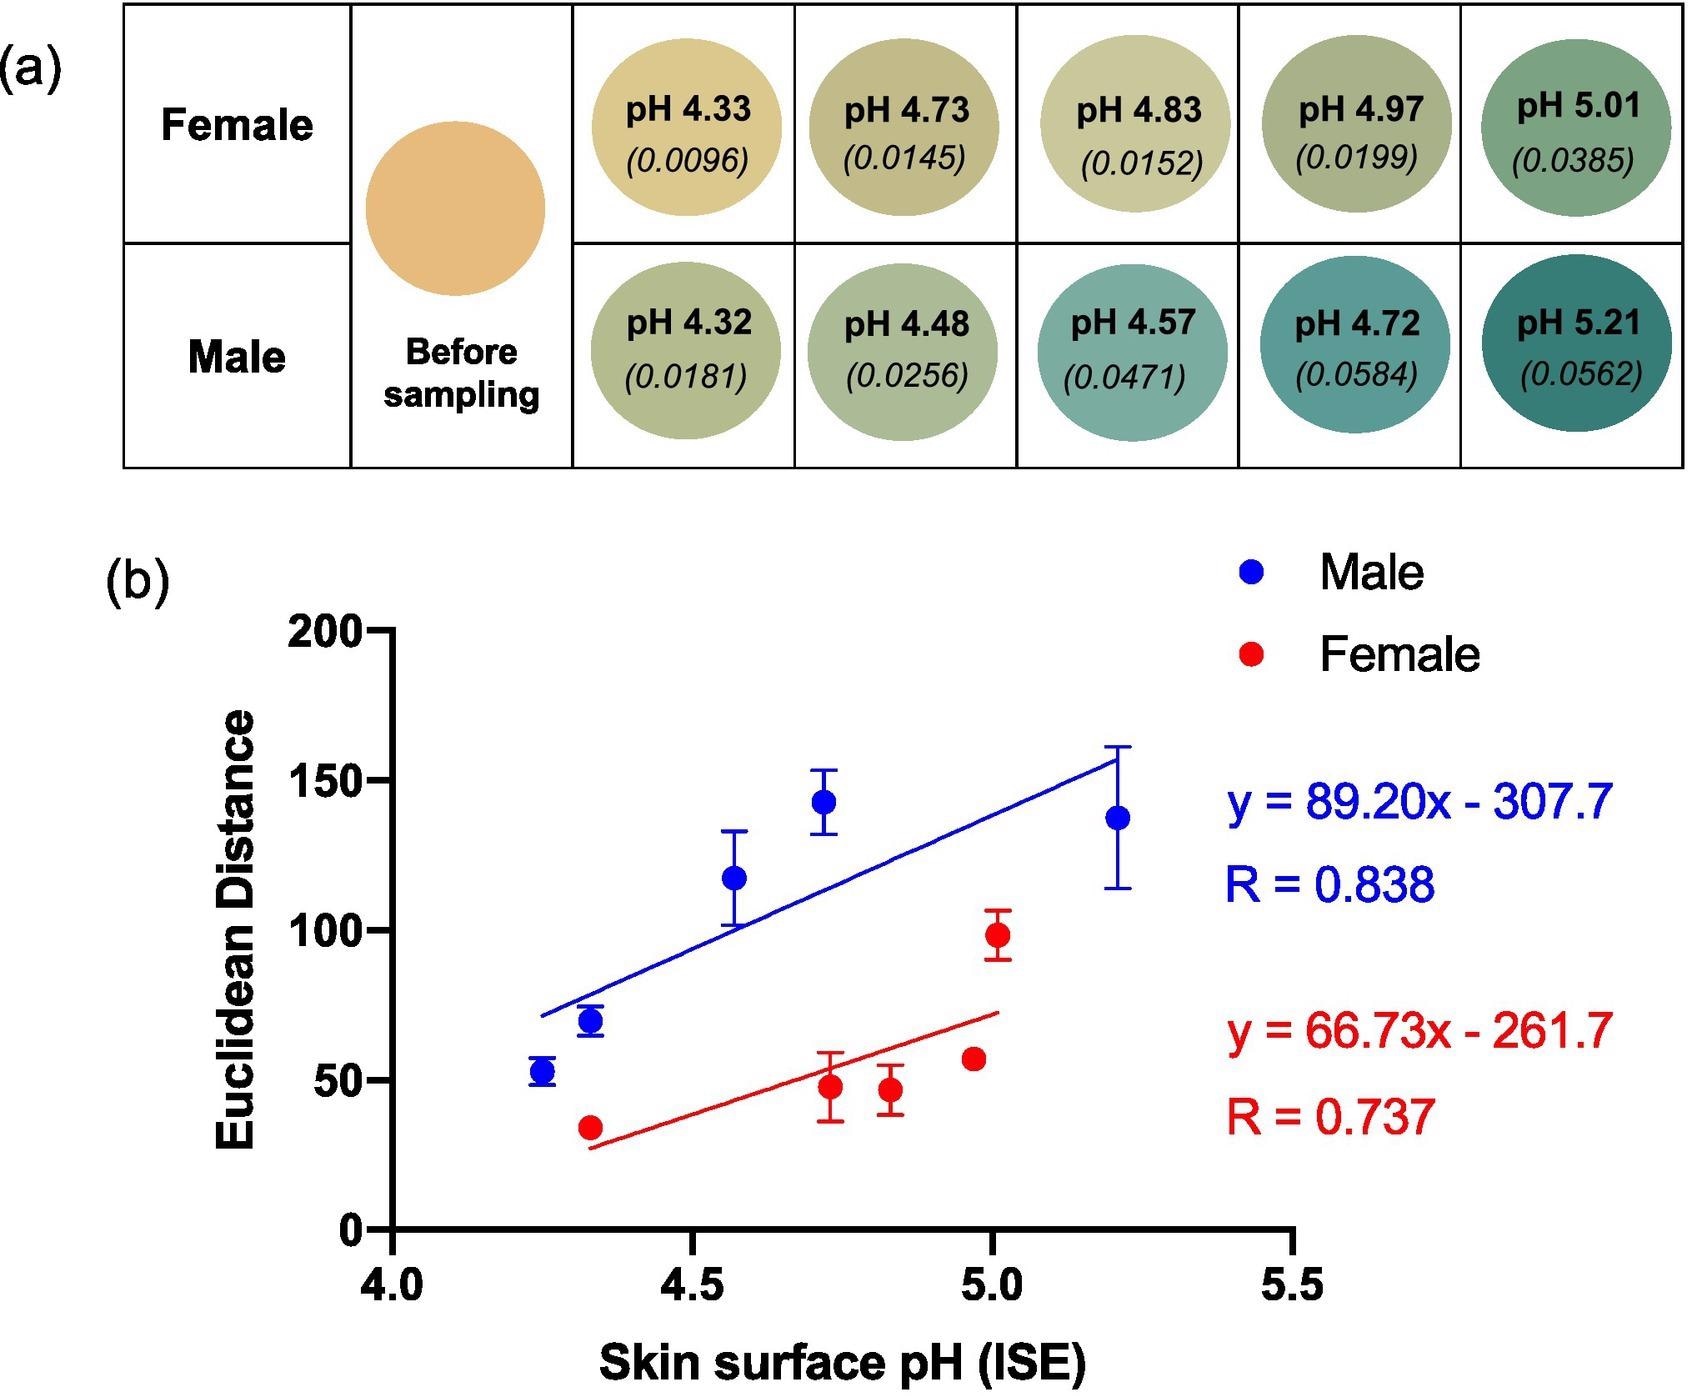
Figure 3. (a) Reproduced average ED color response from wearable platform (6 replicate BCG sensor spots) after being worn on 5 females and 5 males (left palm, 5 h); the corresponding skin surface pHs as measured by a calibrated ISE (bold text) and estimated ammonia flux in mg h−1 cm−2 (italicised text in parenthesis) also given. (b) ED value from (a) plotted as a function of skin surface pH. Error bars represent standard deviation in ED response from n = 6 sensor spots within a single wearable platform. Note: See SI Table 1 for tabulated data. Image Credit: Finnegan, et al., 2022
Single participant information was analyzed on numerous days to evaluate the impact of inter-person variation on sensor response. Figure 4 shows that ED interacts with pH as predicted and that the connection between ED response and skin surface pH for a single participant is substantially higher than in Figure 3, which plotted data from numerous individuals against skin surface pH.
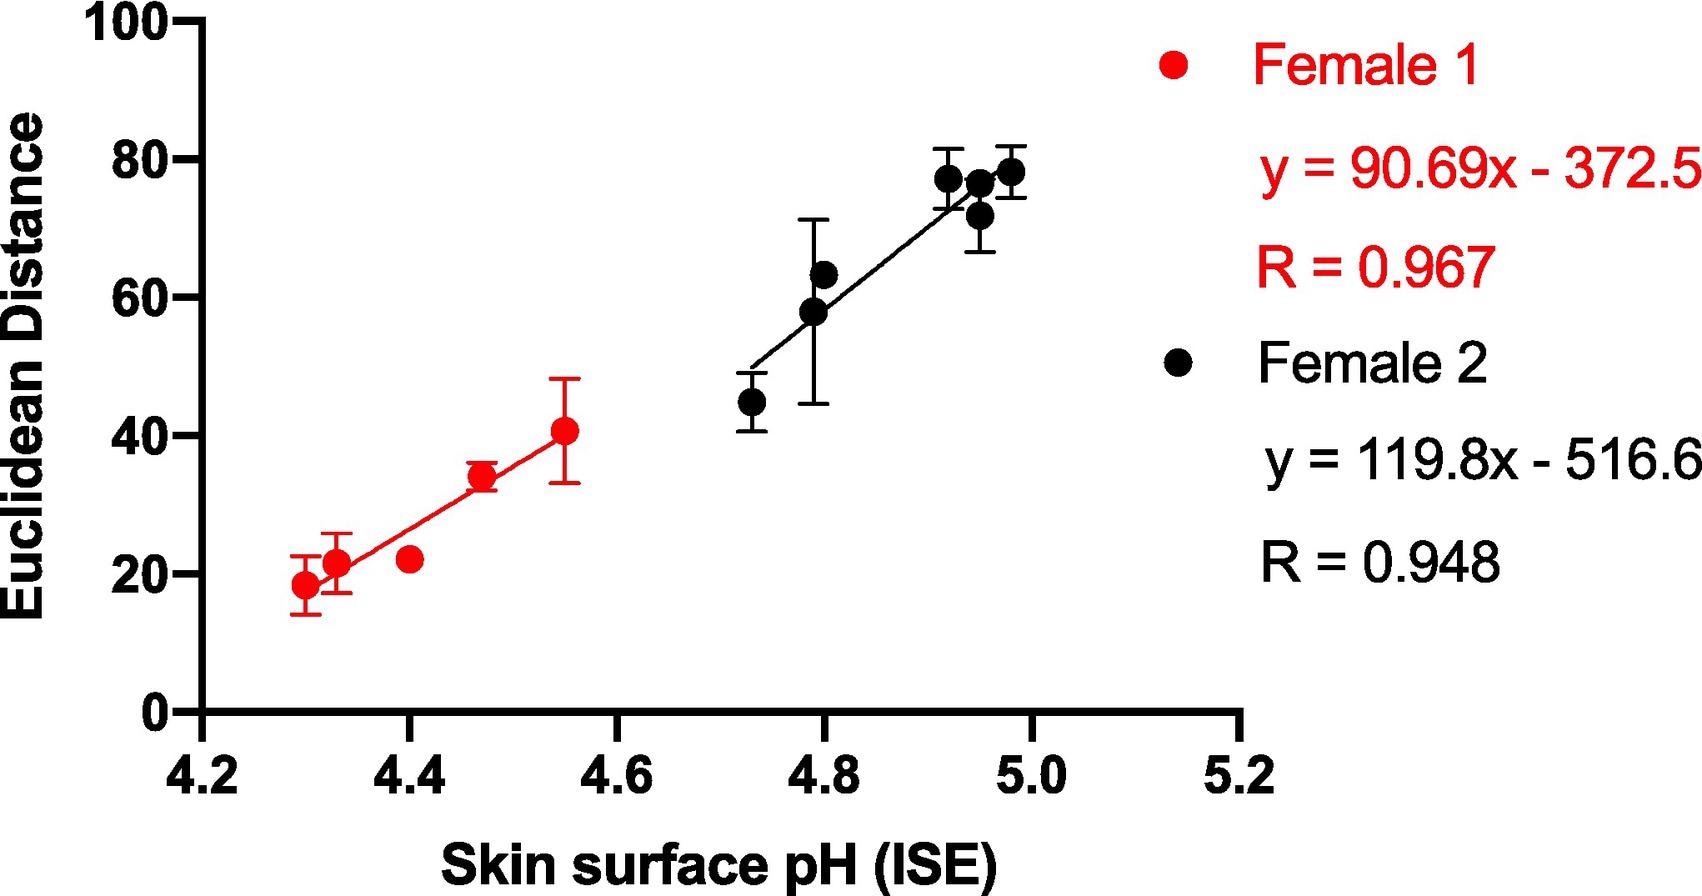
Figure 4. Average ED response from wearable platform (6 replicate BCG sensor spots) after being worn on Female 1 and Female 2 for 5 hours (left palm used for sampling) plotted against skin surface pH (measured using a calibrated ISE). Error bars represent standard deviation in ED response from n = 6 sensor spots within a single wearable platform. Image Credit: Finnegan, et al., 2022
The pH of the skin surface did not change during the measuring period (Figure 5 a-d), showing that the ammonia emission flow from the skin stayed stable over the time period studied.
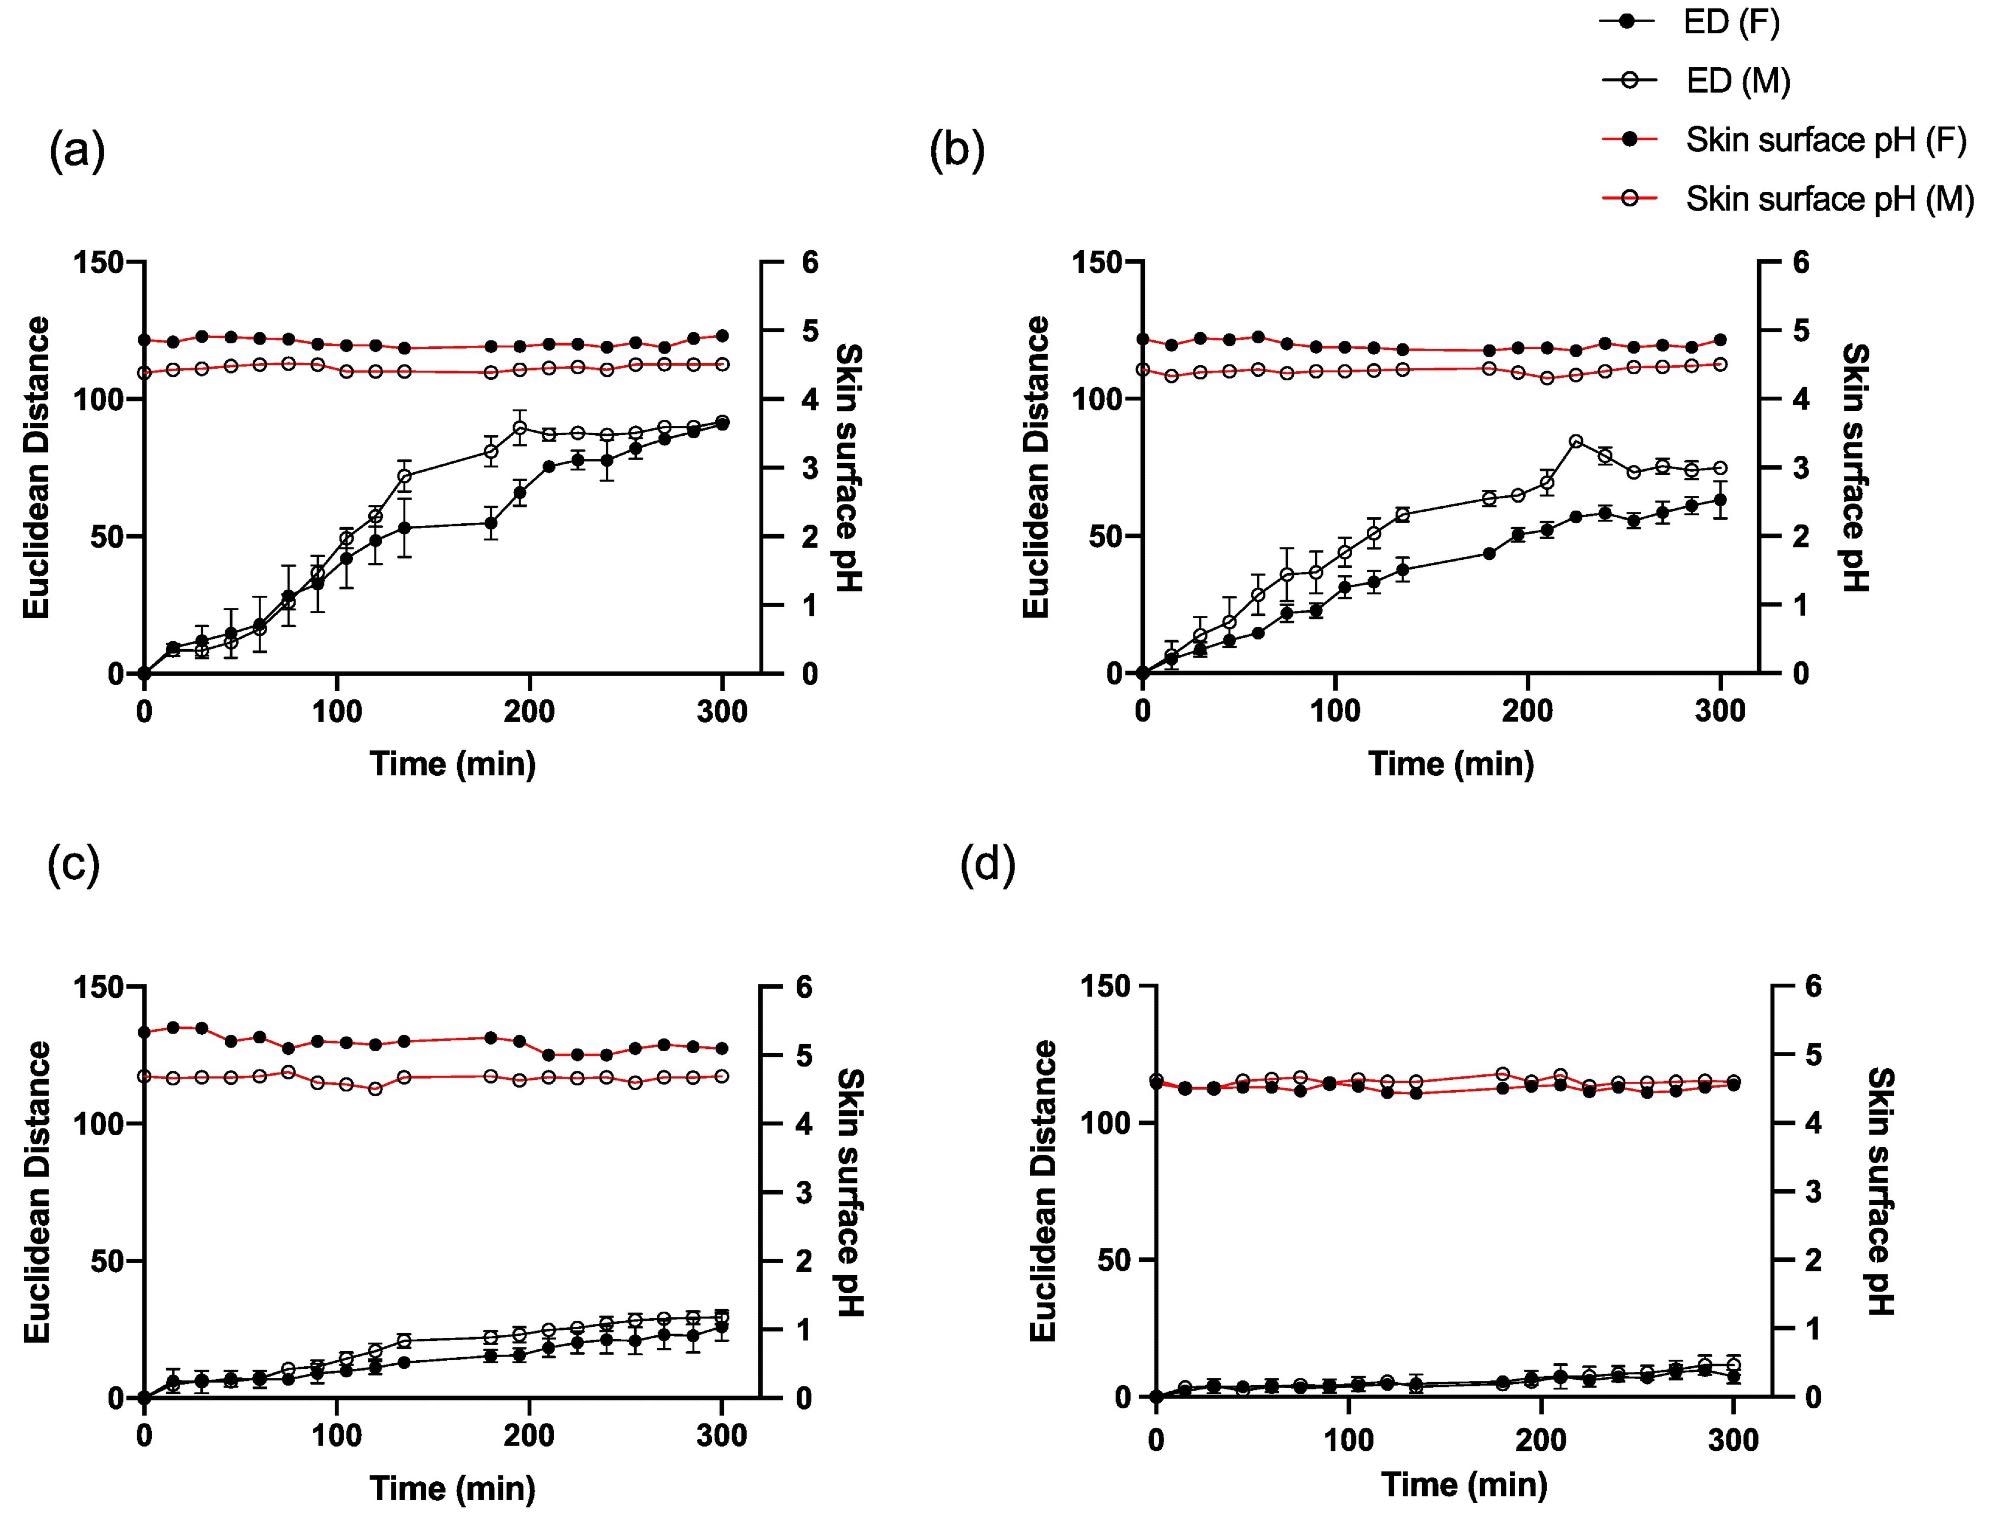
Figure 5. Average ED color response from wearable platform (6 replicate BCG sensor spots) over time on one female and one male participant and corresponding skin surface pH values for (a) palm, (b) foot, (c) abdomen and (d) forehead. Error bars represent standard deviation in ED response from n = 6 sensor spots within a single wearable platform. Image Credit: Finnegan, et al., 2022
The wearable platform was worn constantly on the palm for different set lengths of time up to 270 minutes to explore sensor spot response over time for periods of constant wear, and the sensor spots were scanned in the normal manner, as shown in Figure 6.
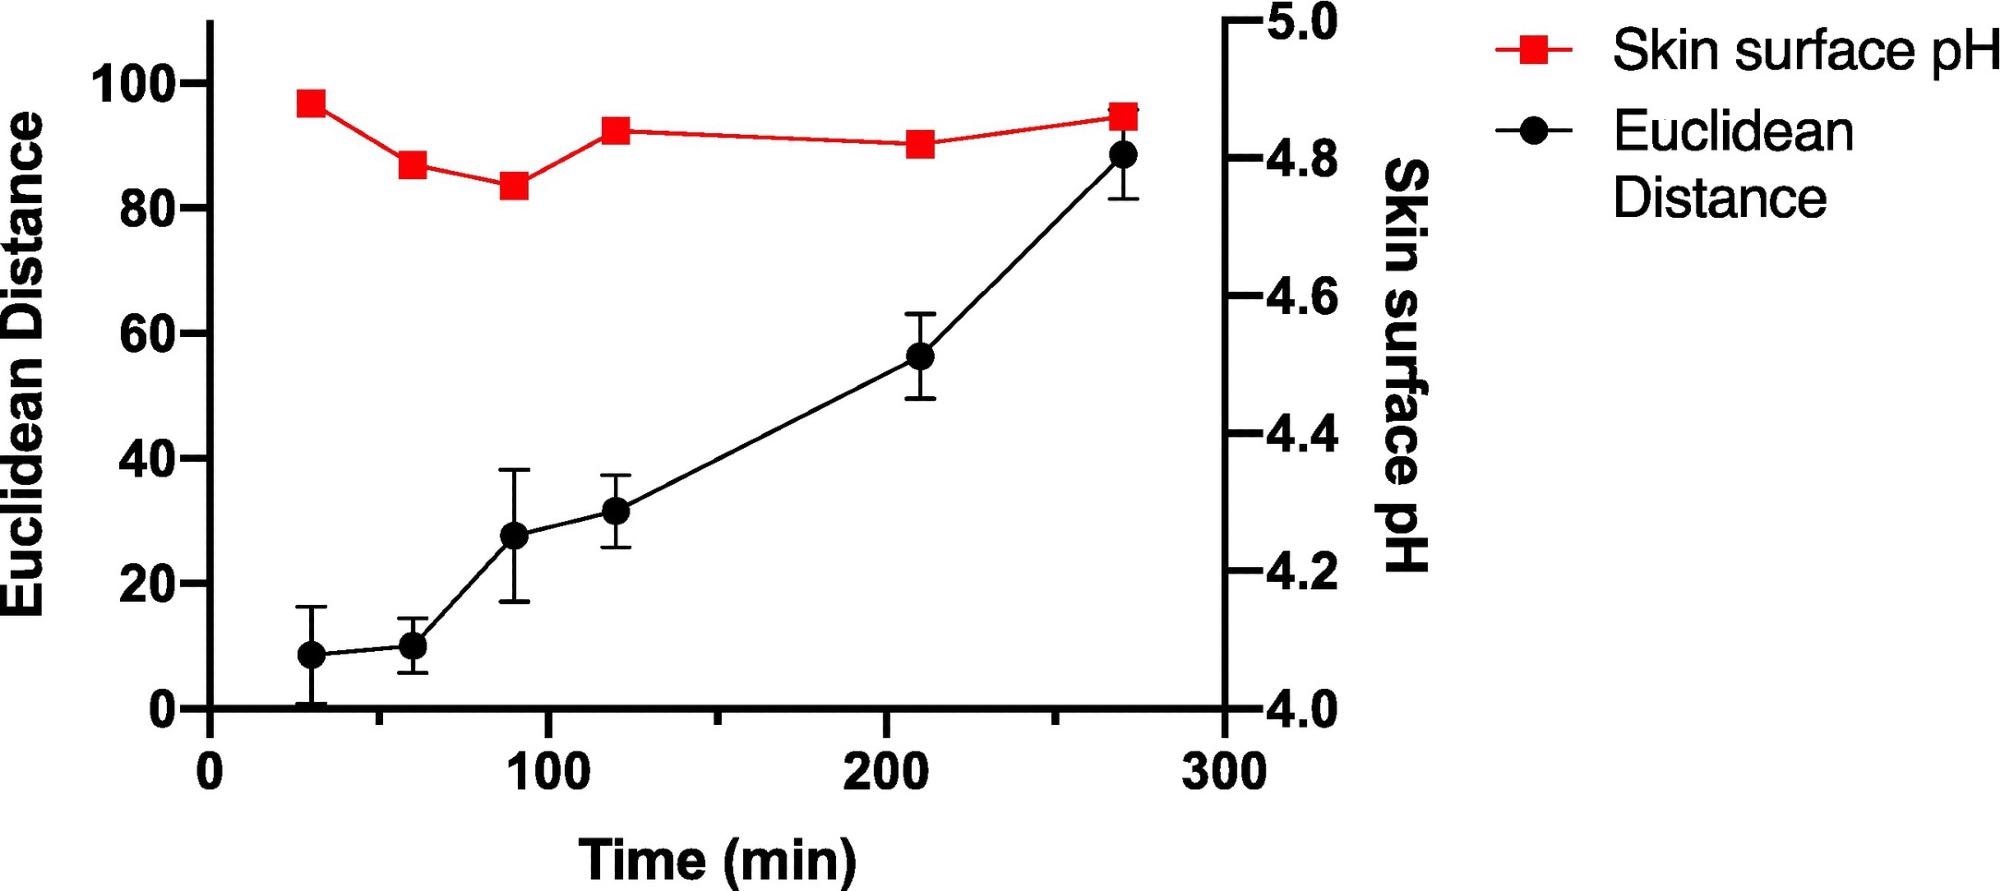
Figure 6. Average ED color response from wearable platform (6 replicate BCG sensor spots) worn for different periods of time by a single participant, (female; left palm; average skin surface pH = 4.82 ± 0.05). Error bars represent standard deviation in ED response from n = 6 sensor spots within a single wearable platform. Image Credit: Finnegan, et al., 2022
To understand the sensitivity and connection of sensor in response to skin surface pH values, a larger number of sensors were worn by a single person over numerous days for varying wear times to help comprehend the time dependence on the sensor spot ED response.
Table 1. 1-D linear regression parameters for regression lines fitted to ED color response as a function of skin surface pH for wearable platforms (6 replicate BCG sensor spots) worn by a single participant collected for continuous sampling times between 30 and 270 minutes. Source: Finnegan, et al., 2022
Time
(min) |
Skin surface pH range |
No. of measurements |
Average ED response |
Slope
(ED/pH unit) |
y-intercept |
R |
| 30 |
4.78–5.09 |
7 |
8.72 |
20.63 |
-92.88 |
0.526 |
| 60 |
4.61–5.18 |
7 |
17.90 |
20.82 |
-85.00 |
0.689 |
| 90 |
4.67–4.85 |
7 |
29.57 |
84.14 |
-371.20 |
0.609 |
| 120 |
4.84–5.13 |
7 |
46.07 |
86.32 |
-381.70 |
0.814 |
| 210 |
4.67–5.31 |
7 |
83.01 |
93.75 |
-369.00 |
0.767 |
| 270 |
4.78–5.29 |
7 |
95.58 |
93.53 |
-375.00 |
0.849 |
Note: see SI Fig. 5 for ED data and 1-D linear regression analysis of data.
Figure 7 depicts the sensor spots’ color changes after every treatment, as well as the ED response shown as a function of skin surface pH after treatment.
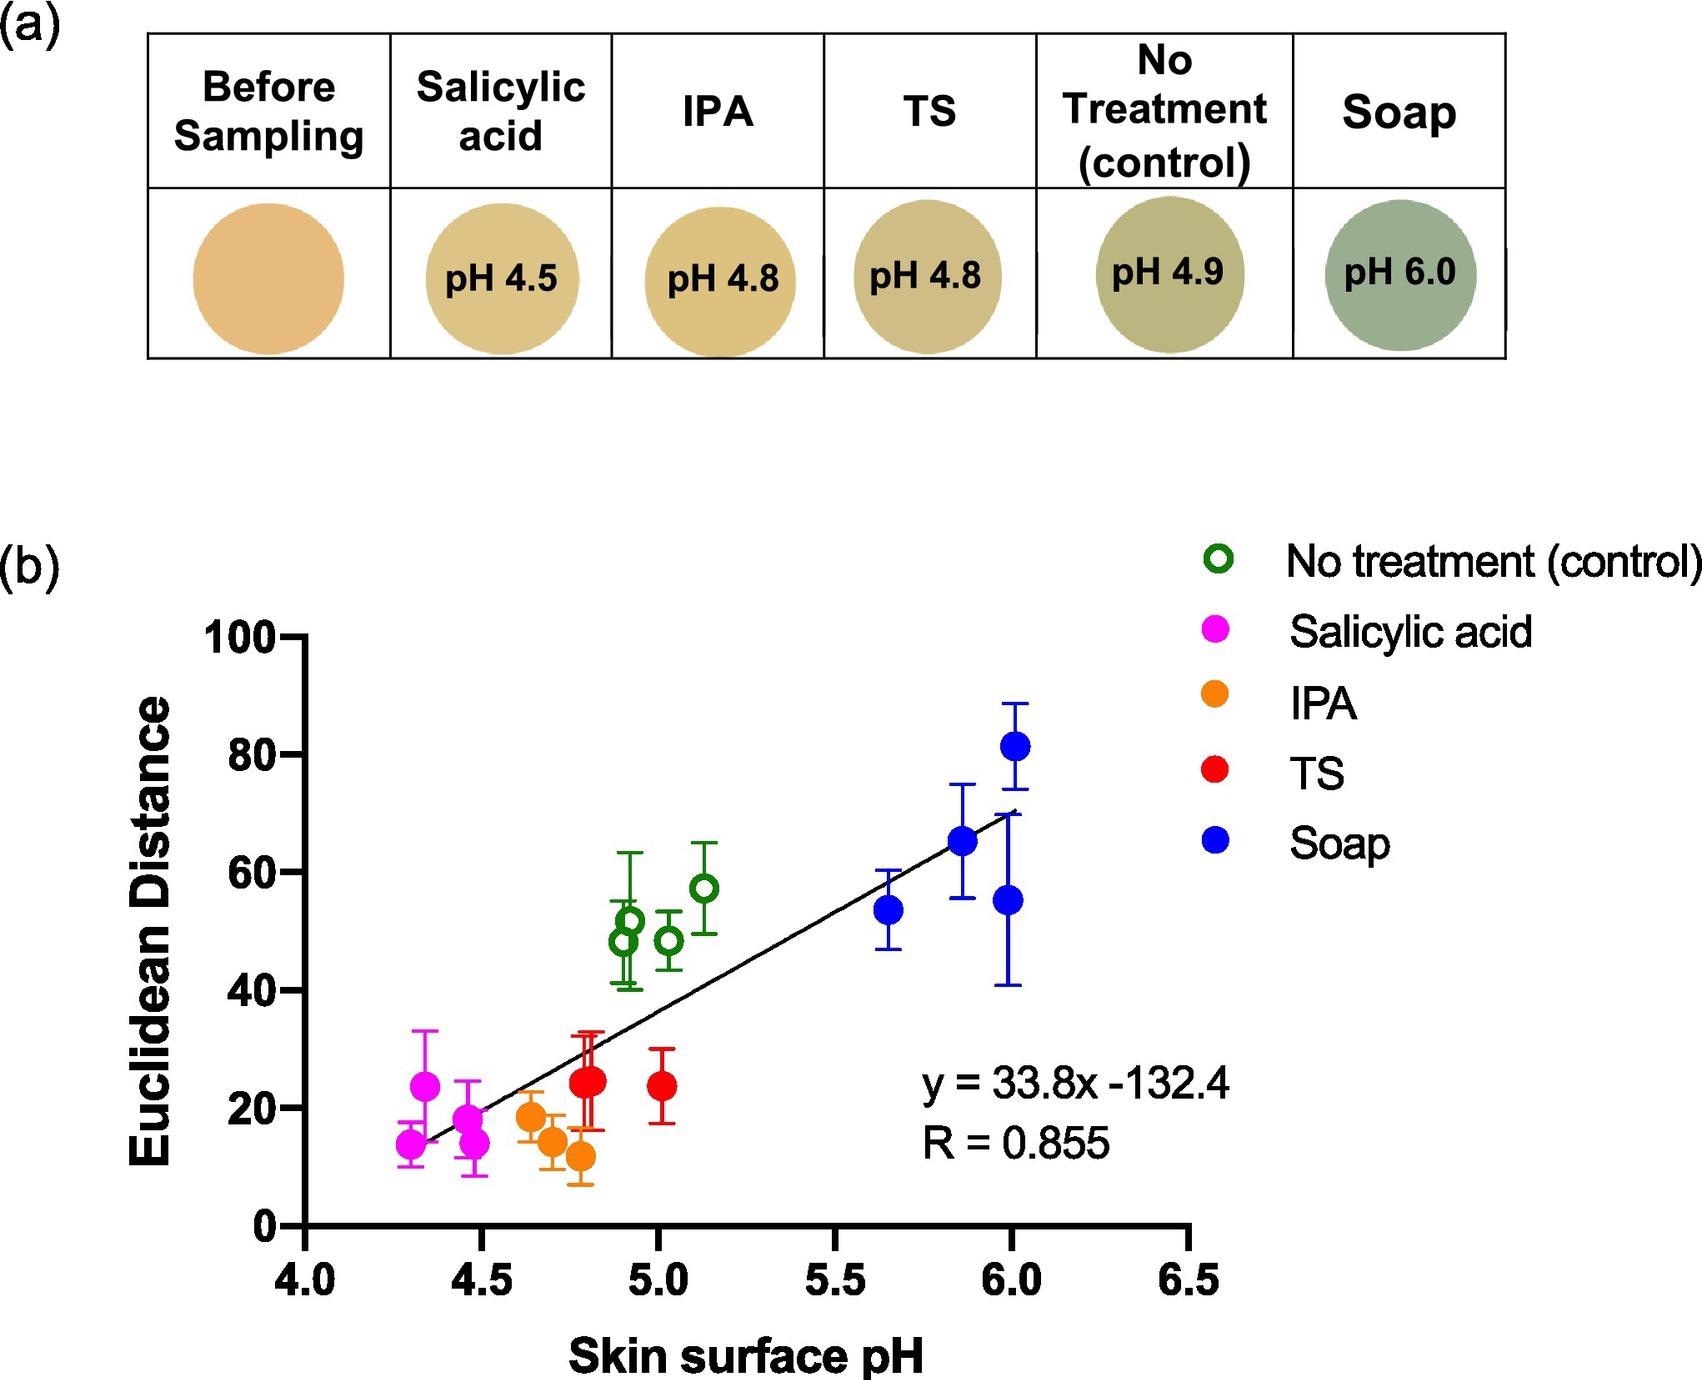
Figure 7. Average ED color response from wearable platform (6 replicate BCG sensor spots) worn for different periods of time by a single participant, (female; left palm; average skin surface pH = 4.82 ± 0.05). Error bars represent standard deviation in ED response from n = 6 sensor spots within a single wearable platform. Image Credit: Finnegan, et al., 2022
Conclusion
In a healthy participant investigation, the use of a simple wearable platform with pH-responsive sensor spots for measuring skin surface pH via volatile ammonia emission from the skin was described.
The findings show that wearable colorimetric sensor platforms may be utilized to precisely monitor target elements of skin volatile emission, and that they are a reasonable alternative to skin fluid collection and examination.
This investigation also highlights problems connected with the technique, such as inter-person heterogeneity in the sensor ED response. Also, the effects of wearables obstructing the skin must be considered, as this might cause the skin to sweat, possibly interfering with sensor response.
In the future, the advancement of simple color-based wearable sensing techniques could be useful in individualized general medical screening as well as self-management of chronic diseases linked with volatile biomarkers.
Journal Reference:
Finnegan, M., Duffy, E., Morrin, A. (2022) The determination of skin surface pH via the skin volatile emission using wearable colorimetric sensors. Sensing and Bio-Sensing Research, p. 100473. Available Online: https://www.sciencedirect.com/science/article/pii/S2214180422000022.
References and Further Reading
- Drislane, C & Irvine, A D (2020) The role of filaggrin in atopic dermatitis and allergic disease. Annals of Allergy, Asthma & Immunology, 124(1), pp. 36–43. doi.org/10.1016/j.anai.2019.10.008.
- Piro, B., et al. (2019) Recent advances in skin chemical sensors. Sensors, 19(20), p. 4376. doi.org/10.3390/s19204376.
- Duffy, E &Morrin, A (2019) Endogenous and microbial volatile organic compounds in cutaneous health and disease. TrAC Trends in Analytical Chemistry, 111, pp. 163–172. doi.org/10.1016/j.trac.2018.12.012
- Heikenfeld, J., et al. (2019) Accessing analytes in biofluids for peripheral biochemical monitoring. Nature Biotechnology, 37, pp. 407–419. doi.org/10.1038/s41587-019-0040-3
- Joseph, J I (2021) Review of the long-term implantable senseonics continuous glucose monitoring system and other continuous glucose monitoring systems. Journal of Diabetes Science and Technology, 15(1), pp. 167–173. doi.org/10.1177%2F1932296820911919
- Ghaffari, R., et al. (2021) Recent progress, challenges, and opportunities for wearable biochemical sensors for sweat analysis. Sensors and Actuators B: Chemical, 332, p. 129447. doi.org/10.1016/j.snb.2021.129447.
- Heikenfeld, J., et al. (2018) Wearable sensors: modalities, challenges, and prospects. Lab on a Chip, 18, pp. 217–248. doi.org/10.1039/C7LC00914C.
- Escobedo, P., et al. (2021) Wireless wearable wristband for continuous sweat pH monitoring. Sensors and Actuators B: Chemical, 327, p. 128948. doi.org/10.1016/j.snb.2020.128948.
- Kim, J., et al. (2018) Wearable non-invasive epidermal glucose sensors: a review. Talanta, 177, pp. 163–170. doi.org/10.1016/j.talanta.2017.08.077.
- Bandodkar, A. J., et al. (2015) Tattoo-based noninvasive glucose monitoring: a proof-of-concept study. Analytical Chemistry, 87(1), pp. 394–398. doi.org/10.1021/ac504300n.
- Jia, W., et al. (2013) Electrochemical tattoo biosensors for real-time noninvasive lactate monitoring in human perspiration. Analytical Chemistry, 85(14), pp. 6553–6560. doi.org/10.1021/ac401573r.
- Shitanda, I., et al. (2021) Continuous sweat lactate monitoring system with integrated screen-printed MgO-templated carbon-lactate oxidase biosensor and microfluidic sweat collector. Electrochimica Acta, 368, p. 137620. doi.org/10.1016/j.electacta.2020.137620.
- Sempionatto, J. R., et al. (2017) Eyeglasses based wireless electrolyte and metabolite sensor platform. Lab on a Chip, 17, pp. 1834–1842. doi.org/10.1039/C7LC00192D.
- Bong Kim, S., et al. (2020) Soft, skin-interfaced microfluidic systems with integrated enzymatic assays for measuring the concentration of ammonia and ethanol in sweat. Lab on a Chip, 20, pp. 84–92. doi.org/10.1039/C9LC01045A.
- Sonner, Z., et al. (2015) The microfluidics of the eccrine sweat gland, including biomarker partitioning, transport, and biosensing implications. Biomicrofluidics, 9, p. 031301. doi.org/10.1063/1.4921039.
- Corrie, S. R., et al. (2015) Blood, sweat, and tears: developing clinically relevant protein biosensors for integrated body fluid analysis. Analyst, 140, pp. 4350–4364. doi.org/10.1039/C5AN00464K.
- Kashaninejad, N., et al. (2021) Microneedle arrays for sampling and sensing skin interstitial fluid. Chemosensors, 9(4), p. 83. doi.org/10.3390/chemosensors9040083.
- Goud, K. Y., et al. (2021) Wearable electrochemical microneedle sensor for continuous monitoring of Levodopa: toward Parkinson management. ACS Sensors, 4(8), pp. 2196–2204. doi.org/10.1021/acssensors.9b01127.
- Glennon, T., et al. (2016) ‘SWEATCH’: A wearable platform for harvesting and analysing sweat sodium content. Electroanalysis, 28(6), pp. 1283–1289. doi.org/10.1002/elan.201600106.
- Pirovano, P., et al. (2020) A wearable sensor for the detection of sodium and potassium in human sweat during exercise. Talanta, 219, p. 121145. doi.org/10.1016/j.talanta.2020.121145.
- Bandodkar, A. J., et al. (2019) Battery-free, skin-interfaced microfluidic/electronic systems for simultaneous electrochemical, colorimetric, and volumetric analysis of sweat. Science Advances, 5(1) p. (eaav3294). doi.org/10.1126/sciadv.aav3294.
- Martín, A., et al. (2017) Epidermal microfluidic electrochemical detection system: enhanced sweat sampling and metabolite detection. ACS Sensors, 2(12), pp. 1860–1868. doi.org/10.1021/acssensors.7b00729.
- Dormont, L., et al. (2013) Human skin volatiles: a review. Journal of Chemical Ecology, 39, pp. 569–578. doi.org/10.1007/s10886-013-0286-z.
- Drabińska, N., et al. (2021) A literature survey of all volatiles from healthy human breath and bodily fluids: the human volatilome. Journal of Breath Research, 15(3), p. 034001. doi.org/10.1088/1752-7163/abf1d0.
- Penn, D. J., et al. (2007) Individual and gender fingerprints in human body odour. Journal of the Royal Society Interface, 4(13), pp. 331–340. doi.org/10.1098/rsif.2006.0182.
- Grabowska-Polanowska, B., et al. (2017) Development of sampling method and chromatographic analysis of volatile organic compounds emitted from human skin. Bioanalysis, 9(19), pp. 1465–1475. doi.org/10.4155/bio-2017-0128.
- Roodt, A. P., et al. (2018) Human skin volatiles: passive sampling and GC × GC-ToFMS analysis as a tool to investigate the skin microbiome and interactions with anthropophilic mosquito disease vectors. Journal of Chromatography B, 1097–1098, pp. 83–93. doi.org/10.1016/j.jchromb.2018.09.002.
- Zhang, Z. M., et al. (2005) The study of fingerprint characteristics of the emanations from human arm skin using the original sampling system by SPME-GC/MS. Journal of Chromatography B, 822(1-2), pp. 244–252. doi.org/10.1016/j.jchromb.2005.06.026.
- Duffy, E., et al. (2017) Probing skin physiology through the volatile footprint: discriminating volatile emissions before and after acute barrier disruption. Experimental Dermatology, 26(10), pp. 919–925. doi.org/10.1111/exd.13344.
- Duffy, E., et al. (2017) Non-invasive assessment of skin barrier properties: investigating emerging tools for in vitro and in vivo applications. Cosmetics, 4(4), p. 44. doi.org/10.3390/cosmetics4040044.
- Shetewi, T., et al. (2021) Investigation of the relationship between skin-emitted volatile fatty acids and skin surface acidity in healthy participants – a pilot study. Journal of Breath Research, 15, p. 037101. doi.org/10.1088/1752-7163/abf20a.
- Danby, S G &Cork, M J (2018) pH in Atopic Dermatitis pH of the Skin: Issues and Challenges. Probl Dermatol. Basel, Karger, 54, pp. 95–107. doi.org/10.1159/000489523.
- Knor, T., et al. (2011) Stratum corneum hydration and skin surface pH in patients with atopic dermatitis. Acta DermatovenerologicaCroatica: ADC, 19(4), pp. 242–247. Available at: https://europepmc.org/article/med/22185924.
- Proksch, E (2018) pH in nature, humans and skin. Journal of Dermatology, 45(9), pp. 1044–1052. doi.org/10.1111/1346-8138.14489.
- Nose, K., et al. (2005) Identification of ammonia in gas emanated from human skin and its correlation with that in blood. Analytical Sciences, 21(12), pp. 1471–1474. doi.org/10.2116/analsci.21.1471.
- Bulmer, M G (1957) The concentration of urea in thermal sweat. The Journal of Physiology, 137(2), pp. 261–266. doi.org/10.1113/jphysiol.1957.sp005810.
- Watabe, A., et al. (2013) Sweat constitutes several natural moisturizing factors, lactate, urea, sodium, and potassium. Journal of Dermatological Science, 72(2), pp. 177–182. doi.org/10.1016/j.jdermsci.2013.06.005.
- Martínez-Lozano, P (2009) Mass spectrometric study of cutaneous volatiles by secondary electrospray ionization. International Journal of Mass Spectrometry, 282(3), pp. 128–132. doi.org/10.1016/j.ijms.2009.02.017.
- Bernier, U. R., et al. (2000) Analysis of human skin emanations by gas chromatography/mass spectrometry. 2. Identification of volatile compounds that are candidate attractants for the yellow fever mosquito (Aedes aegypti). Analytical Chemistry, 72(4), pp. 747–756. doi.org/10.1021/ac990963k.
- Furukawa, S., et al. (2017) Simultaneous and multi-point measurement of ammonia emanating from human skin surface for the estimation of whole body dermal emission rate. Journal of Chromatography B, 1053, pp. 60–64. doi.org/10.1016/j.jchromb.2017.03.034.
- Li, M., et al. (2020) Human ammonia emission rates under various indoor environmental conditions. Environmental Science & Technology, 54(9), p. 5419–5428. doi.org/10.1021/acs.est.0c00094.
- Xiao, J., et al. (2019) Microfluidic chip-based wearable colorimetric sensor for simple and facile detection of sweat glucose. Analytical Chemistry, 91(23), pp. 14803–14807. doi.org/10.1021/acs.analchem.9b03110.
- Choi, J., et al. (2017) Thin, soft, skin-mounted microfluidic networks with capillary bursting valves for Chrono-sampling of sweat. Advanced Healthcare Materials, 6(5), p. 1601355. doi.org/10.1002/adhm.201601355.
- Koh, A., et al. (2016) A soft, wearable microfluidic device for the capture, storage, and colorimetric sensing of sweat. Science Translational Medicine, 8(366), p. (366ra165–366ra165). doi.org/10.1126/scitranslmed.aaf2593.
- Zhang, Y., et al. (2019) Passive sweat collection and colorimetric analysis of biomarkers relevant to kidney disorders using a soft microfluidic system. Lab on a Chip, 19, pp. 1545–1555. doi.org/10.1039/C9LC00103D.
- Suslick, K. S., et al. (2004) Colorimetric sensor arrays for molecular recognition. Tetrahedron, 60(49), pp. 11133–11138. doi.org/10.1016/j.tet.2004.09.007.
- Hamilton, D. F., et al. (2015) Interpreting regression models in clinical outcome studies. Bone &Joint Research, 4(9), pp. 152–153. doi.org/10.1302/2046-3758.49.2000571
- Low, P. A., (2012) Chapter 51 – Sweating. D. Robertson, I. Biaggioni, G. Burnstock, P.A. Low, J.F.R. Paton (Eds.), In: Primer on the Autonomic Nervous System (Third ed.), Academic Press, San Diego, pp. 249–251. doi.org/10.1016/B978-0-12-386525-0.00051-2
- Taylor, N. A., et al. (2013) Regional variations in transepidermal water loss, eccrine sweat gland density, sweat secretion rates and electrolyte composition in resting and exercising humans. Extreme Physiology & Medicine, 2, p. 4. doi.org/10.1186/2046-7648-2-4.
- Harker, M. (2013) Psychological sweating: a systematic review focused on aetiology and cutaneous response. Skin Pharmacology and Physiology, 26(2), pp. 92–100. doi.org/10.1159/000346930.
- SanMiguel, A &Grice, E A (2015) Interactions between host factors and the skin microbiome. Cellular and Molecular Life Sciences, 72, pp. 1499–1515. doi.org/10.1007/s00018-014-1812-z.
- Shamloul, G & Khachemoune, A (2021) An updated review of the sebaceous gland and its role in health and diseases part 1: embryology, evolution, structure, and function of sebaceous glands. Dermatologic Therapy, 34(1), p. (e14695). doi.org/10.1111/dth.14695.