Out of all cardiovascular diseases, acute myocardial infarction (AMI) has one of the highest mortality rates, accounting for 31.8% of all deaths worldwide.

Image Credit: Emily frost/Shutterstock.com
Probable causes of AMI include hypertension, obesity, hyperlipidemia, smoking, overwork, and drinking, which raises the percentage of the total population classed as a AMI high-risk group. Becasue of this, early disease detection is vital.
Lengthy, pre-diagnosis clinical procedures heavily rely on expensive instrumentation and require sophisticated procedures, several reagents, and experienced professionals in hospitals to be completed. Also, the proportion (∼70%) of atypical initial symptoms, includes shoulder pain, toothache, dizziness, stomachache, and left arm weakness, are the major impediments to the in-time diagnosis of AMI.
To help alleviate these issues, a rapid and simple diagnosis of AMI in a non-medical context is widely required, decreasing the diagnostic time and significantly lowering mortality risk.
Due to the high specificity and stability of aptamer and the high sensitivity of graphene, the aptameric graphene field-effect transistor (GFET) biosensor is considered to be the solution, and it may be used as portable or wearable devices in non-medical environments.
Despite significant advances, the great majority of aptameric GFETs are hard to achieve stable functioning in clinical applications until resolving specific difficulties, such as:
(1) Non-linear signal output with drastically varying sensitivity in different ranges.
(2) Hemocyte biofouling of graphene surfaces is another concern. Due to detection failure, biofouling would prevent them from being used in whole blood.
(3) As the surface of graphene is sensitive, surface-absorbed contaminants from living surroundings might have a major impact on the biosensor’s sensitivity, accuracy, and longevity.
In a new study, researchers present a three-dimensional affinity biosensor (3DA-biosensor) made up of a self-assembled hydrogel-aptamer hybrid layer (H-AHL) composition and GFET for ultra-sensitive, quick, and accurate detection of AMI in patient samples. The thickness of the H-AHL structure is modulated efficiently, enabling the adjustment of the 3DA-biosensor's detecting parameter, resulting in a customizable high-sensitivity detection range.
Furthermore, encapsulating aptamer and graphene within a hydrogel can dramatically increase the biosensor’s lifespan and activity. According to investigations, the 3DA-biosensor allows for quick detection of AMI biomarkers in whole blood, as well as the identification of positive or negative patient samples in less than 5 minutes with a 94% accuracy rate.
This biosensor might be used alongside modern wearable or portable circuits to detect disease and provide personalized health treatment.
Methodology
A commercial foundry provided the graphene, a monolayer sheet created by chemical vapor deposition. Following 15 minutes of room-temperature polymerization, the H-AHL structure was built in the open cavity over the graphene-conducting channel.
To eliminate unreacted monomers and aptamers, the produced H-AHL was soaked in 100 mM NaCl and 20 mM HEPES for 10 minutes.
The 3DA-biosensors with the H-AHL structure were calibrated in 1 x PBS until the signal output was constant and then recorded responses of different concentrations of cTnI (1 x 10⁻⁷ to 1 nM) within 6 minutes at room temperature for each concentration. Commercial products fetal bovine serum and EDTA anticoagulated rabbit blood were used to make the cTnI solution.
A commercial source meter is used to measure the output of the 3DA-biosensor signal (Keithley 2636B). The charge screening effect caused by nonspecific adsorption on the graphene surface was mitigated in these studies by sweeping the on-chip gate voltage from -0.3–0.3 V at a modest pace with a step of 0.001 V. For real-time measurement, the drain-source bias (Vds) was set at 0.02 V.
Results
Figure 1A shows the schematics for the manufacturing operations of the 3D biosensor with the H-AHL structure. Figure 1B shows an image of the integrated 3DA-biosensor, while the structure of H-AHL is studied using a scanning electron microscope (SEM) in Figure 1C.
The 3DA-biosensor, as shown in Figure 1D, provides quick, easy, and specific detection of the AMI biomarker in patient samples using a tailored portable analytical apparatus.
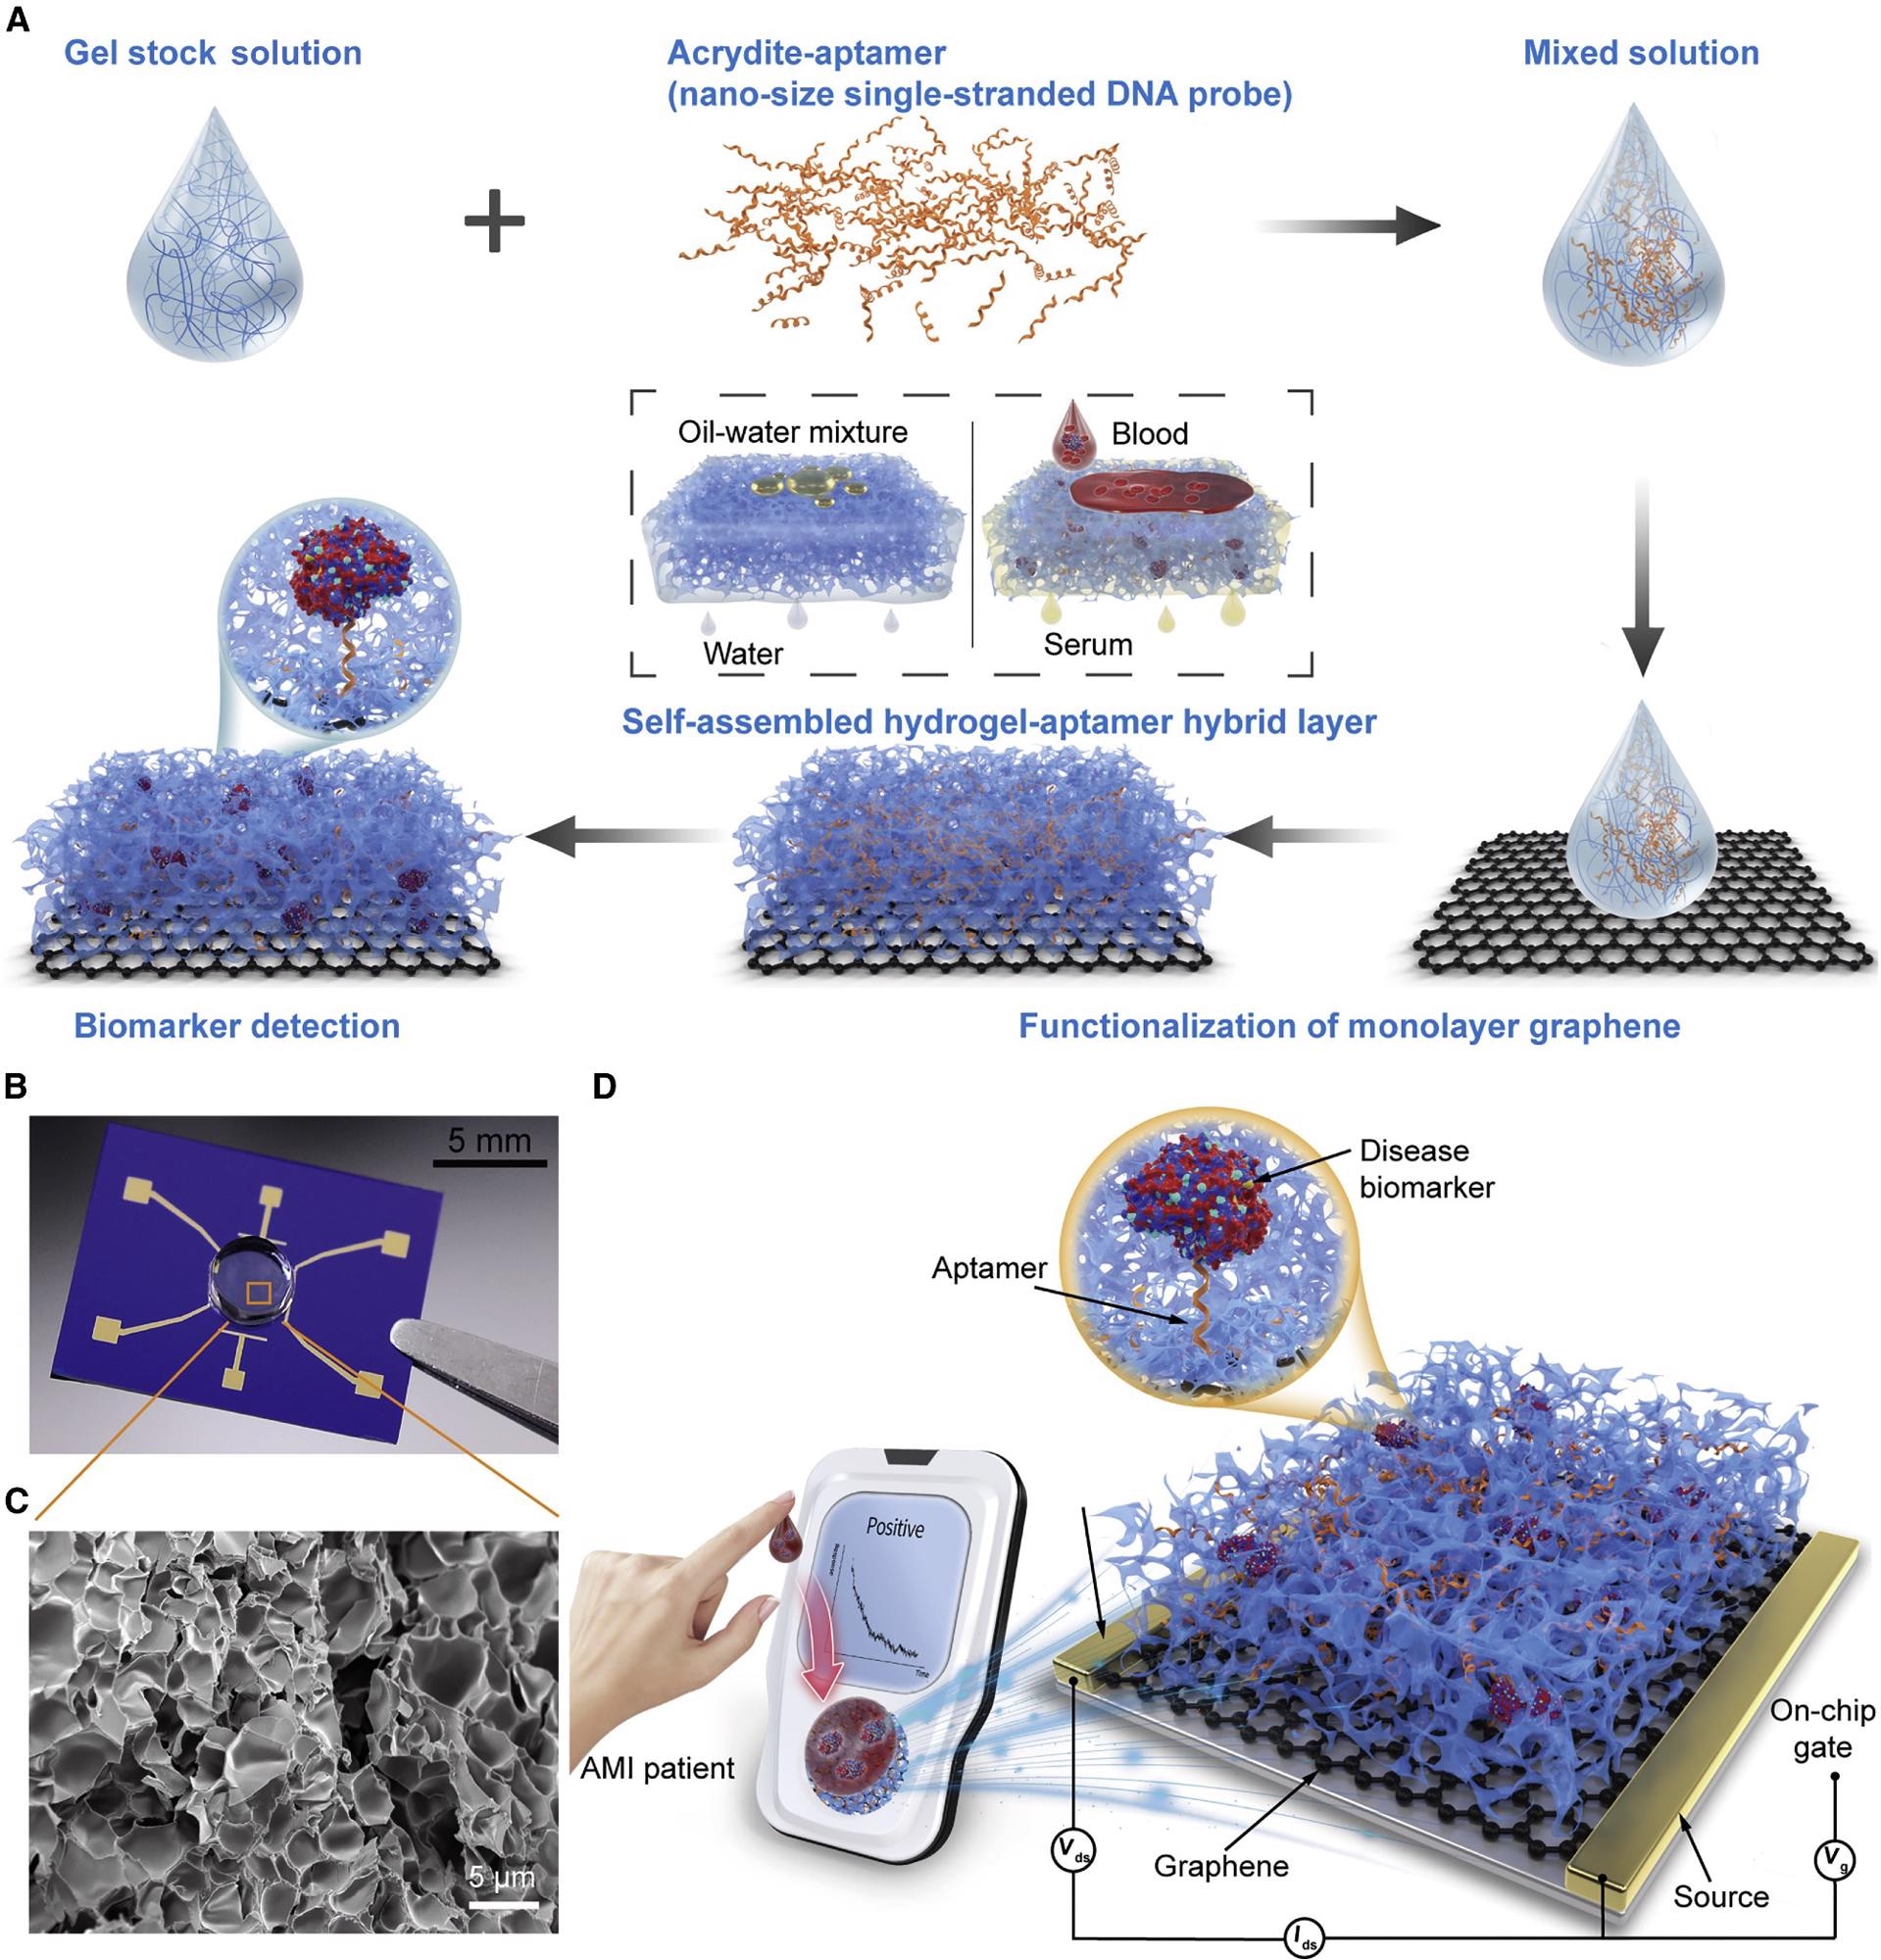
Figure 1. Schematic of the 3DA-biosensor for AMI biomarker detection. (A) Schematic of the 3DA-biosensor fabrication process. The graphene-conducting channel is modified with the mixed solution that contains gel stock solution and aptamer to form the hydrogel-aptamer hybrid layer. (B) Photograph of the fabricated 3DA-biosensor with the H-AHL structure. (C) SEM image of the H-AHL structure. A mass of nano- or microsize holes is observed in the hydrogel through the cross-section, illustrating the self-filtration capability of the biosensor. (D) 3DA-biosensor exploits the self-filtering and specific recognition capability of the H-AHL and the sensitivity of GFET to achieve detection of disease biomarkers in whole blood without pretreatment to samples. Image Credit: Wang, et al., 2022
The Dirac point (VDirac), the value of Vg at which drain-source current (Ids) achieves its lowest, was seen to fall by 0.065 V from 0.132–0.067 V when the concentration of cTnI rises from 1 x 10⁻⁷ to 1 nM. (Figure 2A).
IgG-aptamer- and insulin-aptamer-modified 3DA-biosensors had different transfer characteristic curves for rising target biomarker concentrations than cTnI-aptamer-modified devices (Figures 2B and 2C). VDirac is displayed as a function of biomarker concentrations (Figures 2D–2F), defined as ΔVDirac = VDirac - VDirac,0, while VDirac,0 is the Dirac point equivalent to the voltage recorded in 1 x PBS.
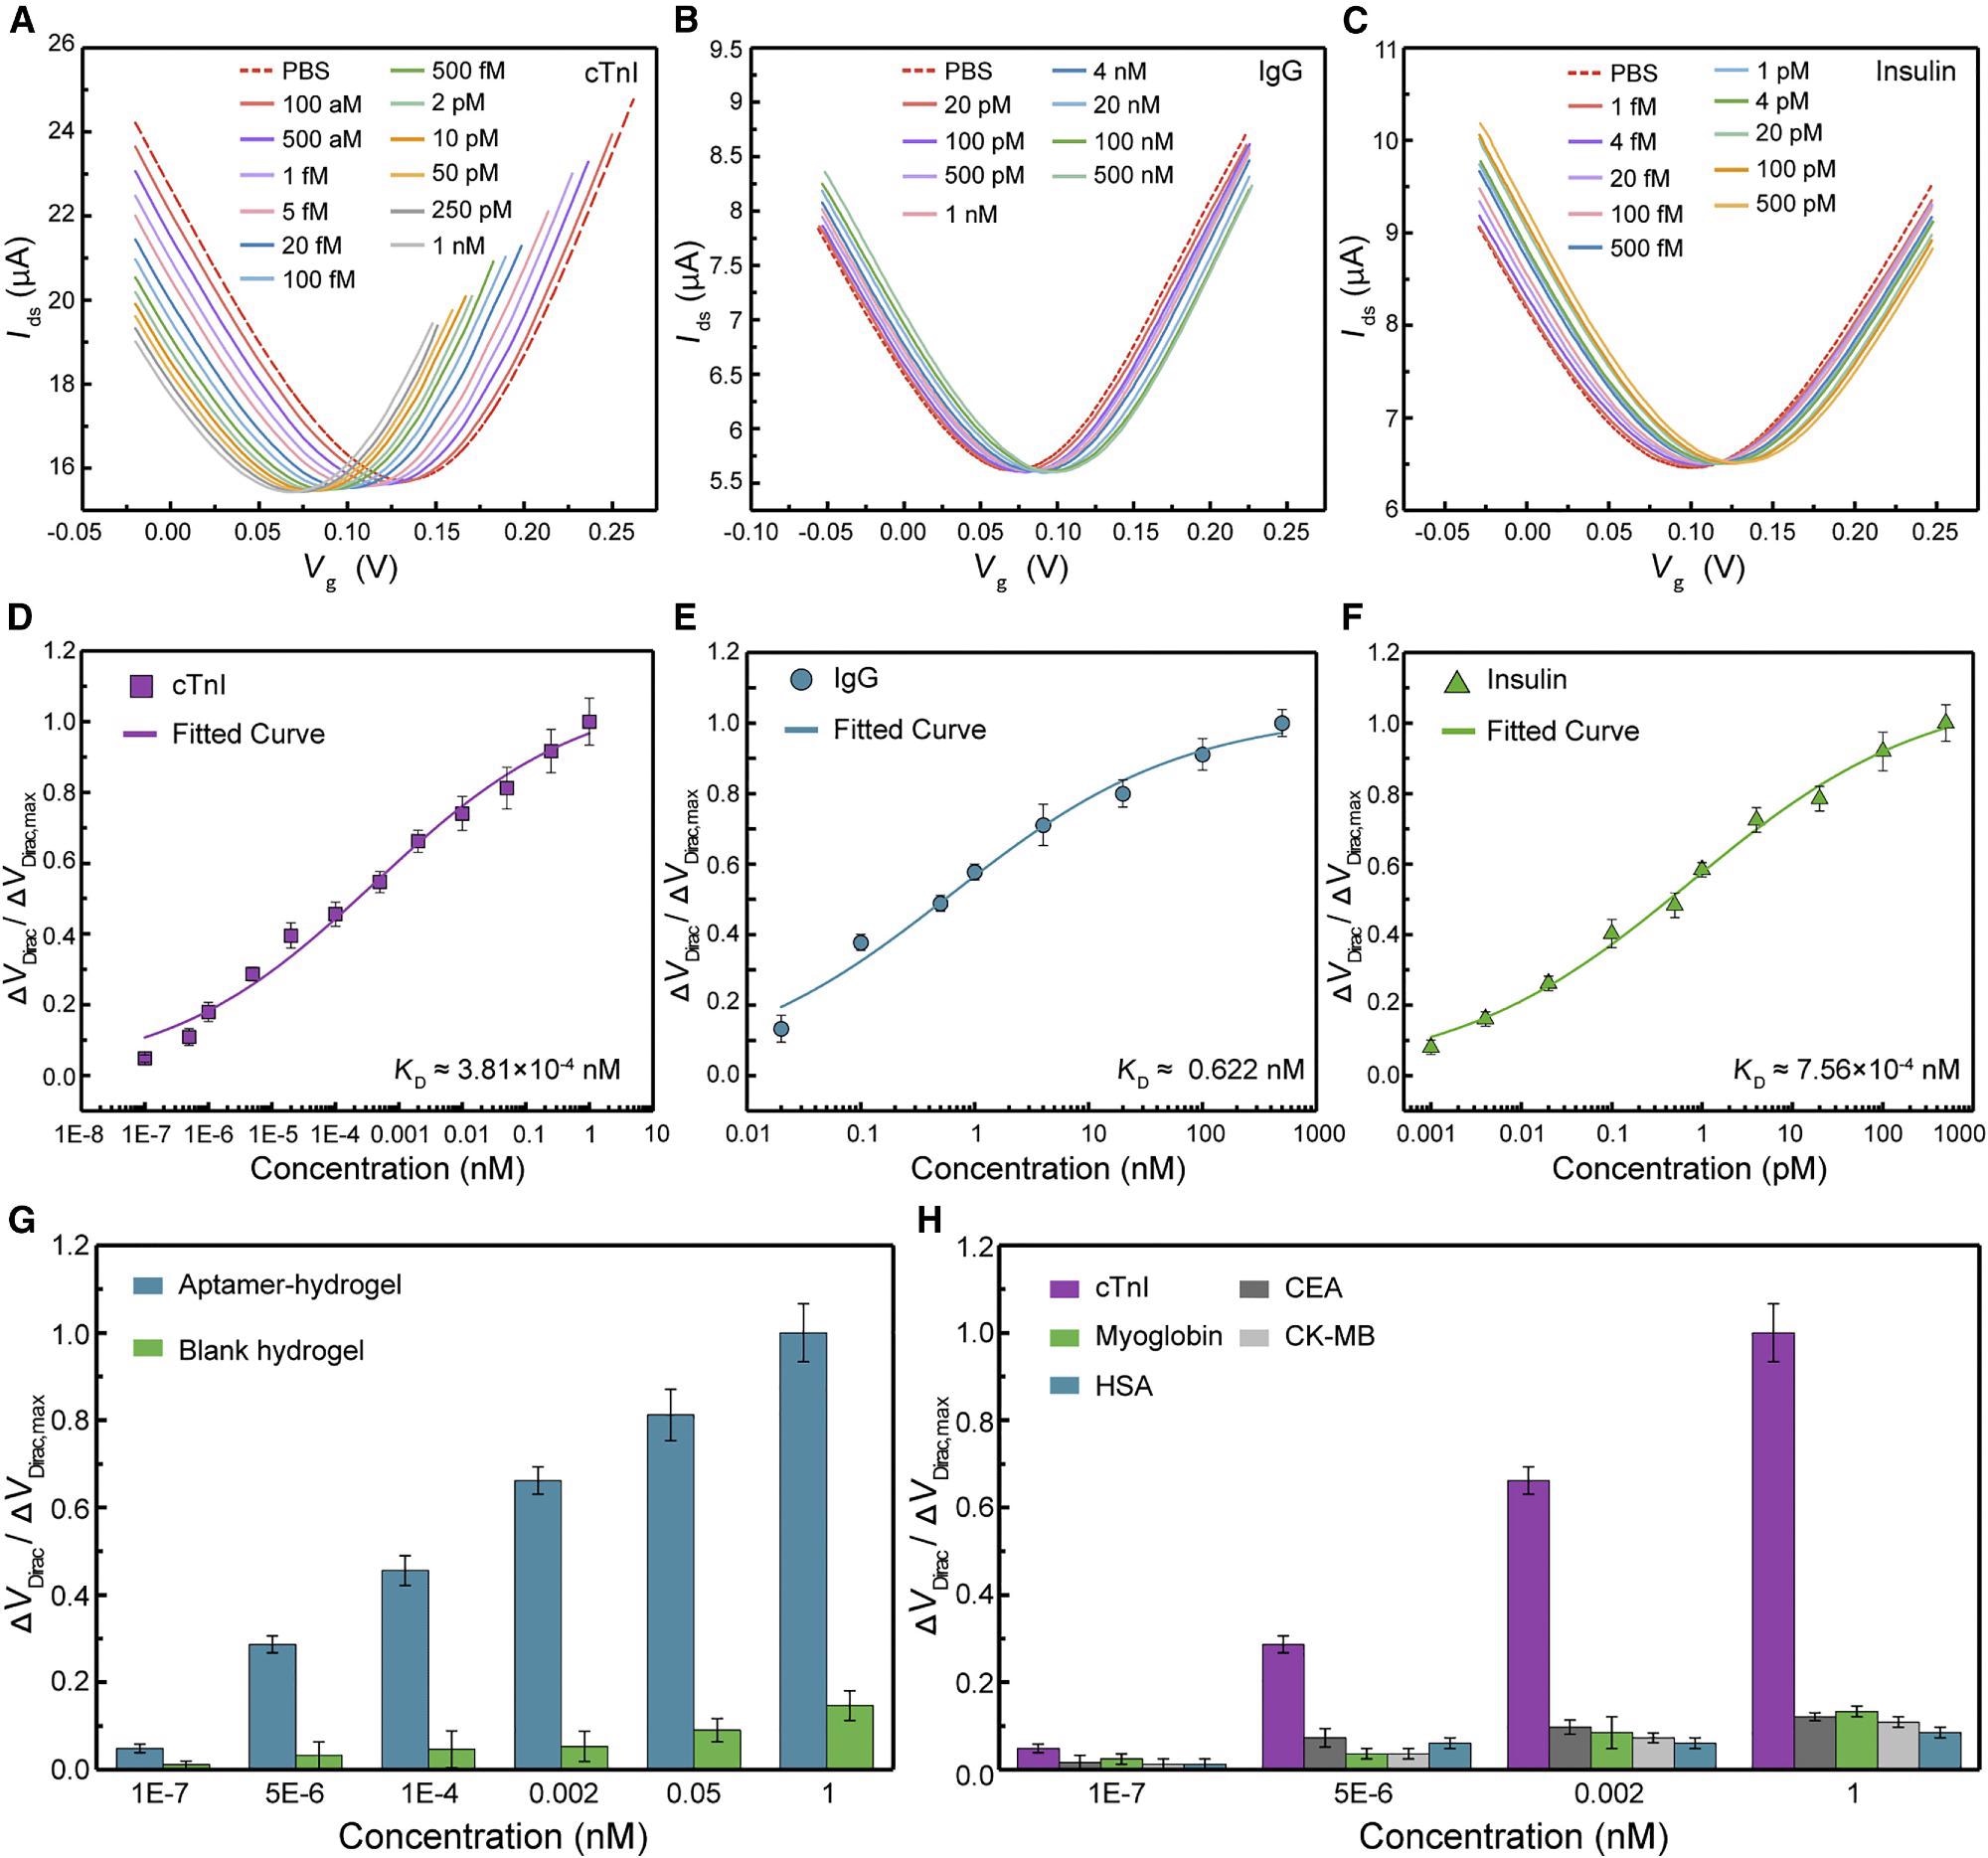
Figure 2. 3DA-biosensor selectively detects disease biomarkers in pure buffer. (A–C) After modification with corresponding aptamers, transfer characteristic curves are measured while the biosensor exposure to cTnI solution ranging from 1 × 10⁻⁷ to 1 nM (A), IgG solution ranging from 0.02 to 500 nM (B), and insulin solution ranging from 1 × 10⁻⁶ to 0.5 nM (C). (D–F) Normalized Dirac point shift ΔVDirac/ΔVDirac,max as a function of different concentrations of cTnI protein (D), IgG protein (E), and insulin (F), respectively. Each fitted curve is a least-square fit to the Hill-Langmuir binding model. Each test was repeated three times (data are represented as mean ± SD). (G) Sensing response of the 3DA-biosensor with H-AHL in the presence of the target biomarker is significantly higher than that generated by the device with the blank hydrogel. Each test was repeated three times (data are represented as mean ± SD). (H) Signal output of the 3DA-biosensor to target cTnI protein is significantly larger compared with control proteins (CEA, myoglobin, CK-MB, and HSA). Each test was repeated three times (data are represented as mean ± SD). Image Credit: Wang, et al., 2022
Figure 3A shows that as the structure thickness increased from 0–1.4 mm (0 mm for the conventional aptameric GFET), the ΔVDirac,max, which can be considered the sensing system gain, increased significantly to a maximum value of 0.069 V, accompanied by a significant drop to 0.026 V as the structure thickness increased from 1.4–2.35 mm.
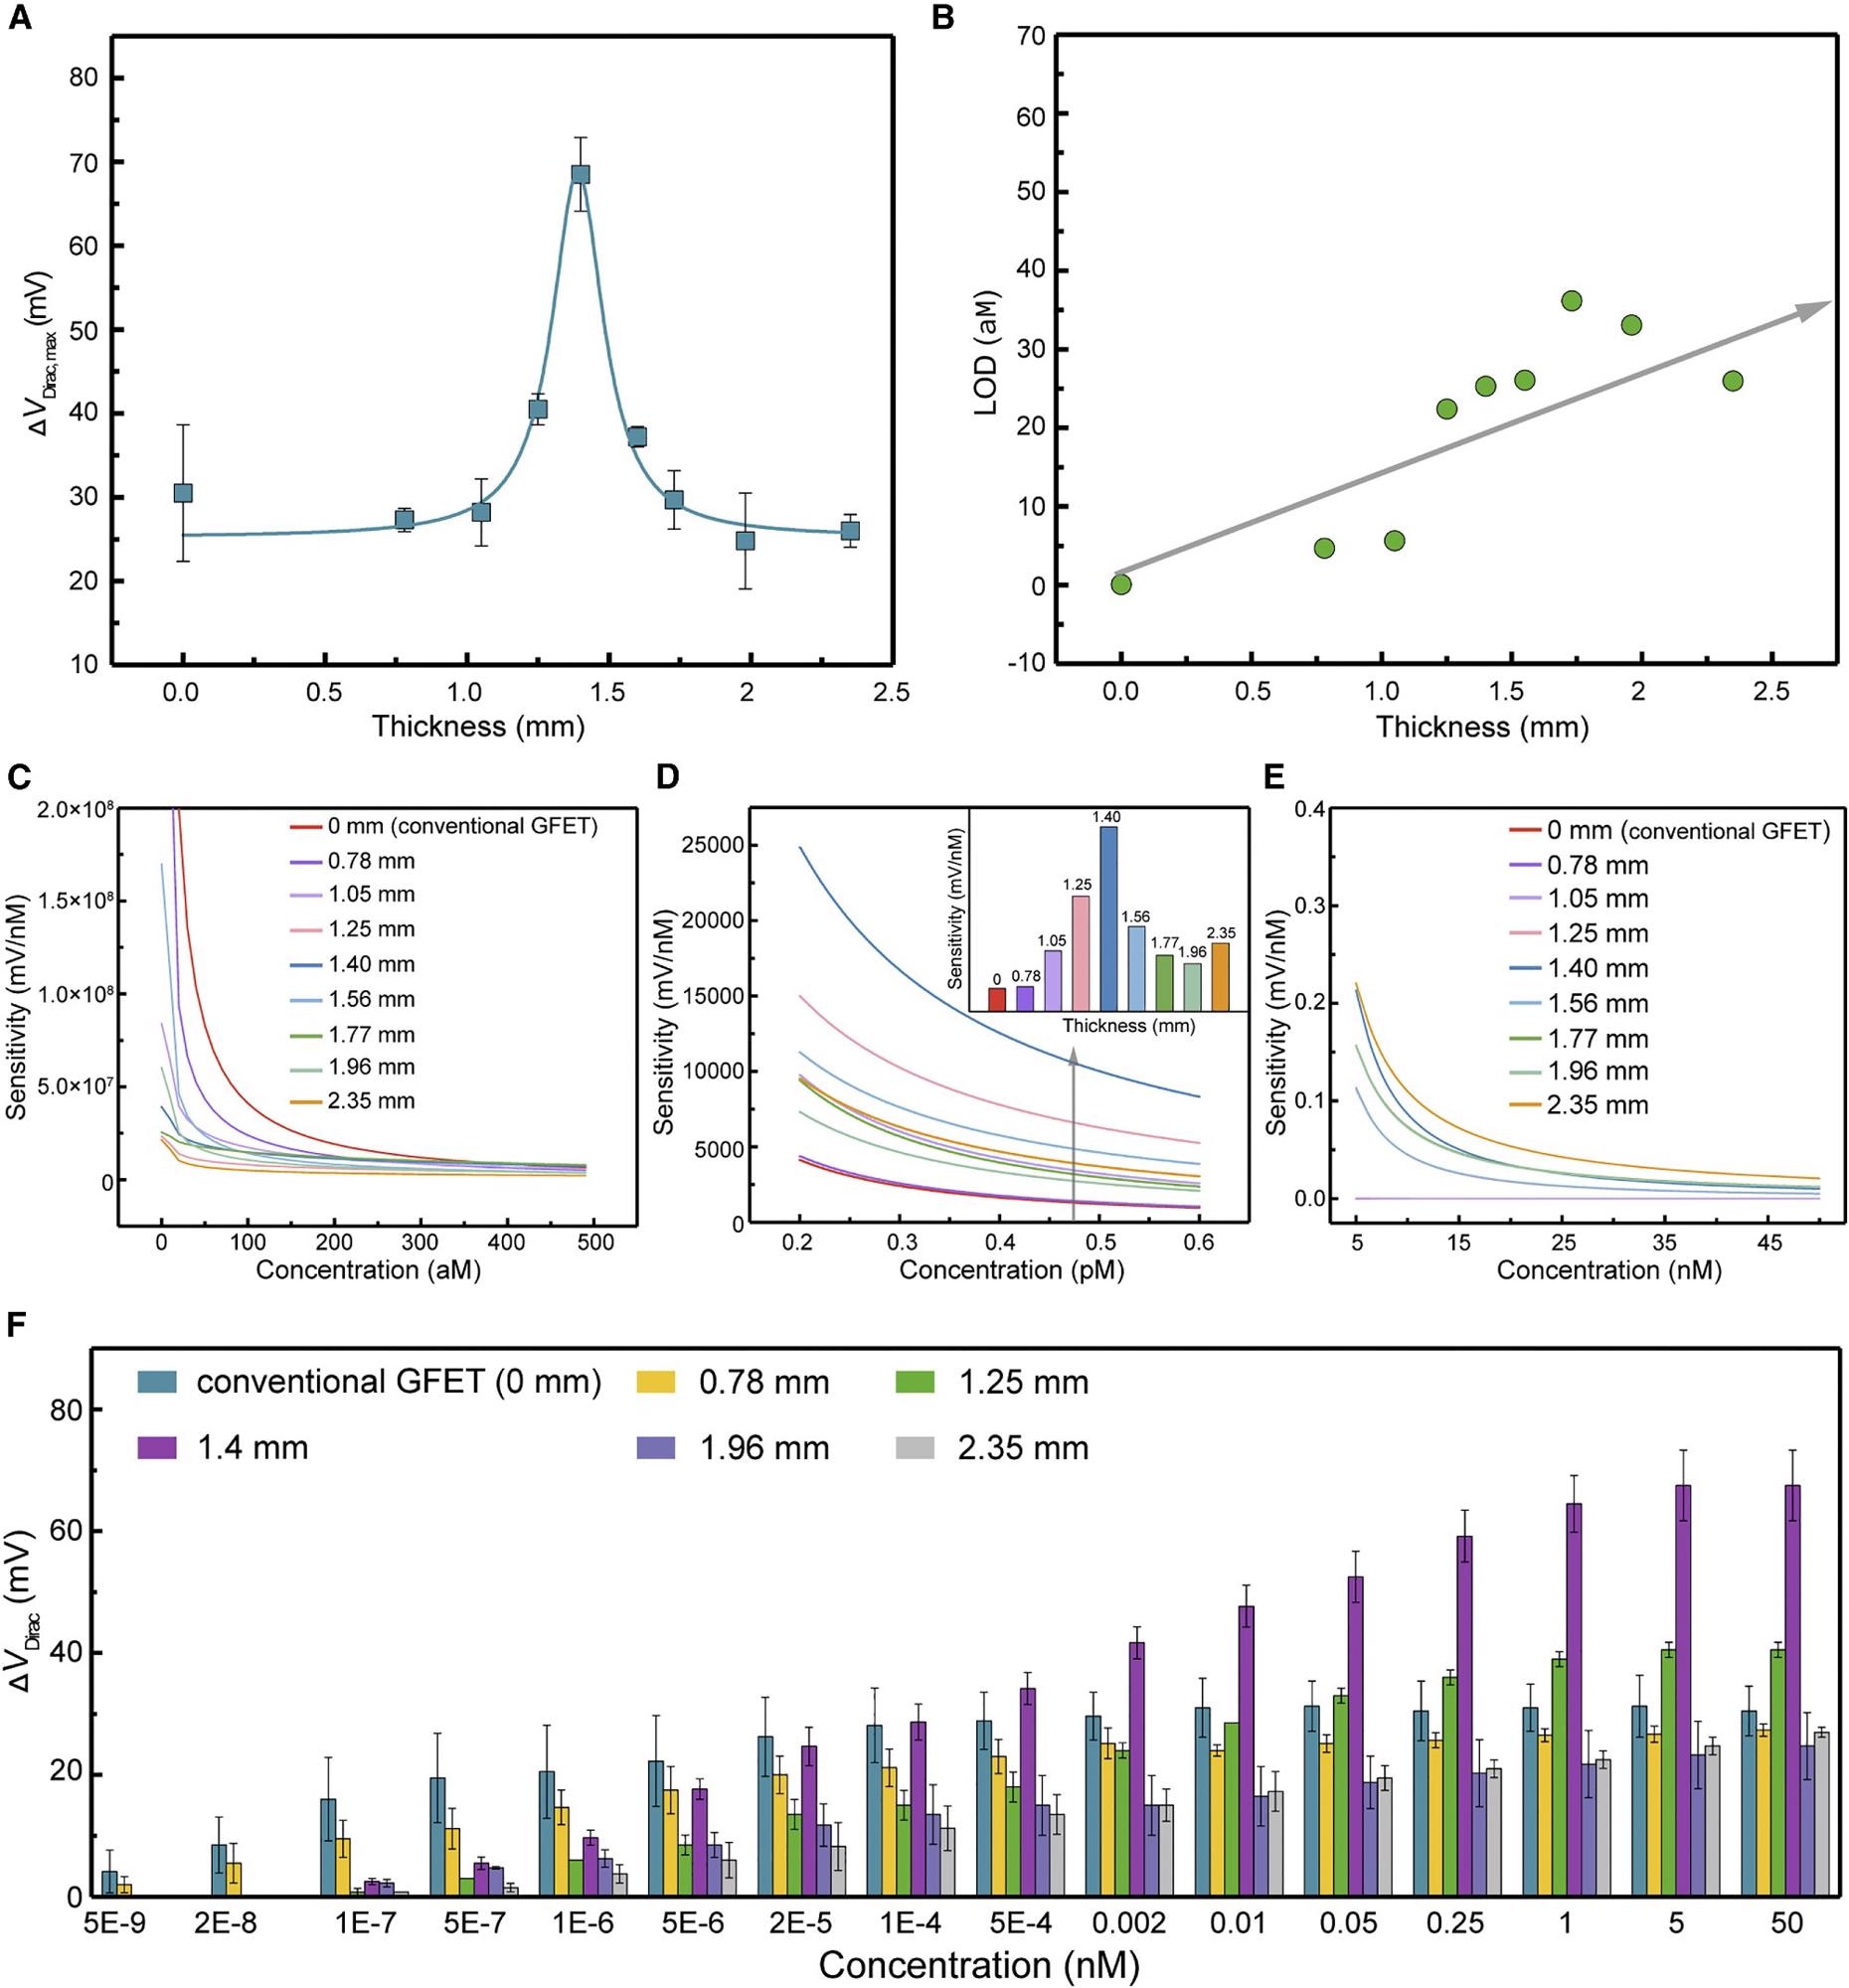
Figure 3. 3DA-biosensor with adjustable sensitivity ranges of detection. (A) The maximum Dirac point shift ΔVDirac,max of the 3DA-biosensor with various H-AHL structure thickness. Each test was repeated three times (data are represented as mean ± SD). (B) LOD of the biosensor showing the monotonical increase with the enhancement of H-AHL thickness. (C–E) 3DA-biosensor of different H-AHL thickness showing the adjustable sensitivity to various concentrations ranging from 0 to 5 × 10⁻⁷ nM (C), 2 × 10⁻⁴ to 6 × 10⁻⁴ nM (D), and 5 to 45 nM (E). (F) Sensing response of 3DA-biosensor with different thicknesses of H-AHL from 0 to 2.35 mm in the presence of cTnI concentration ranging from 5 × 10⁻⁹ to 50 nM. Each test was repeated three times (data are represented as mean ± SD). Image Credit: Wang, et al., 2022
The H-AHL retains good integrity and transparency, as demonstrated in Figure 4A, and no apparent blood infiltration is seen after a 60-minute test.
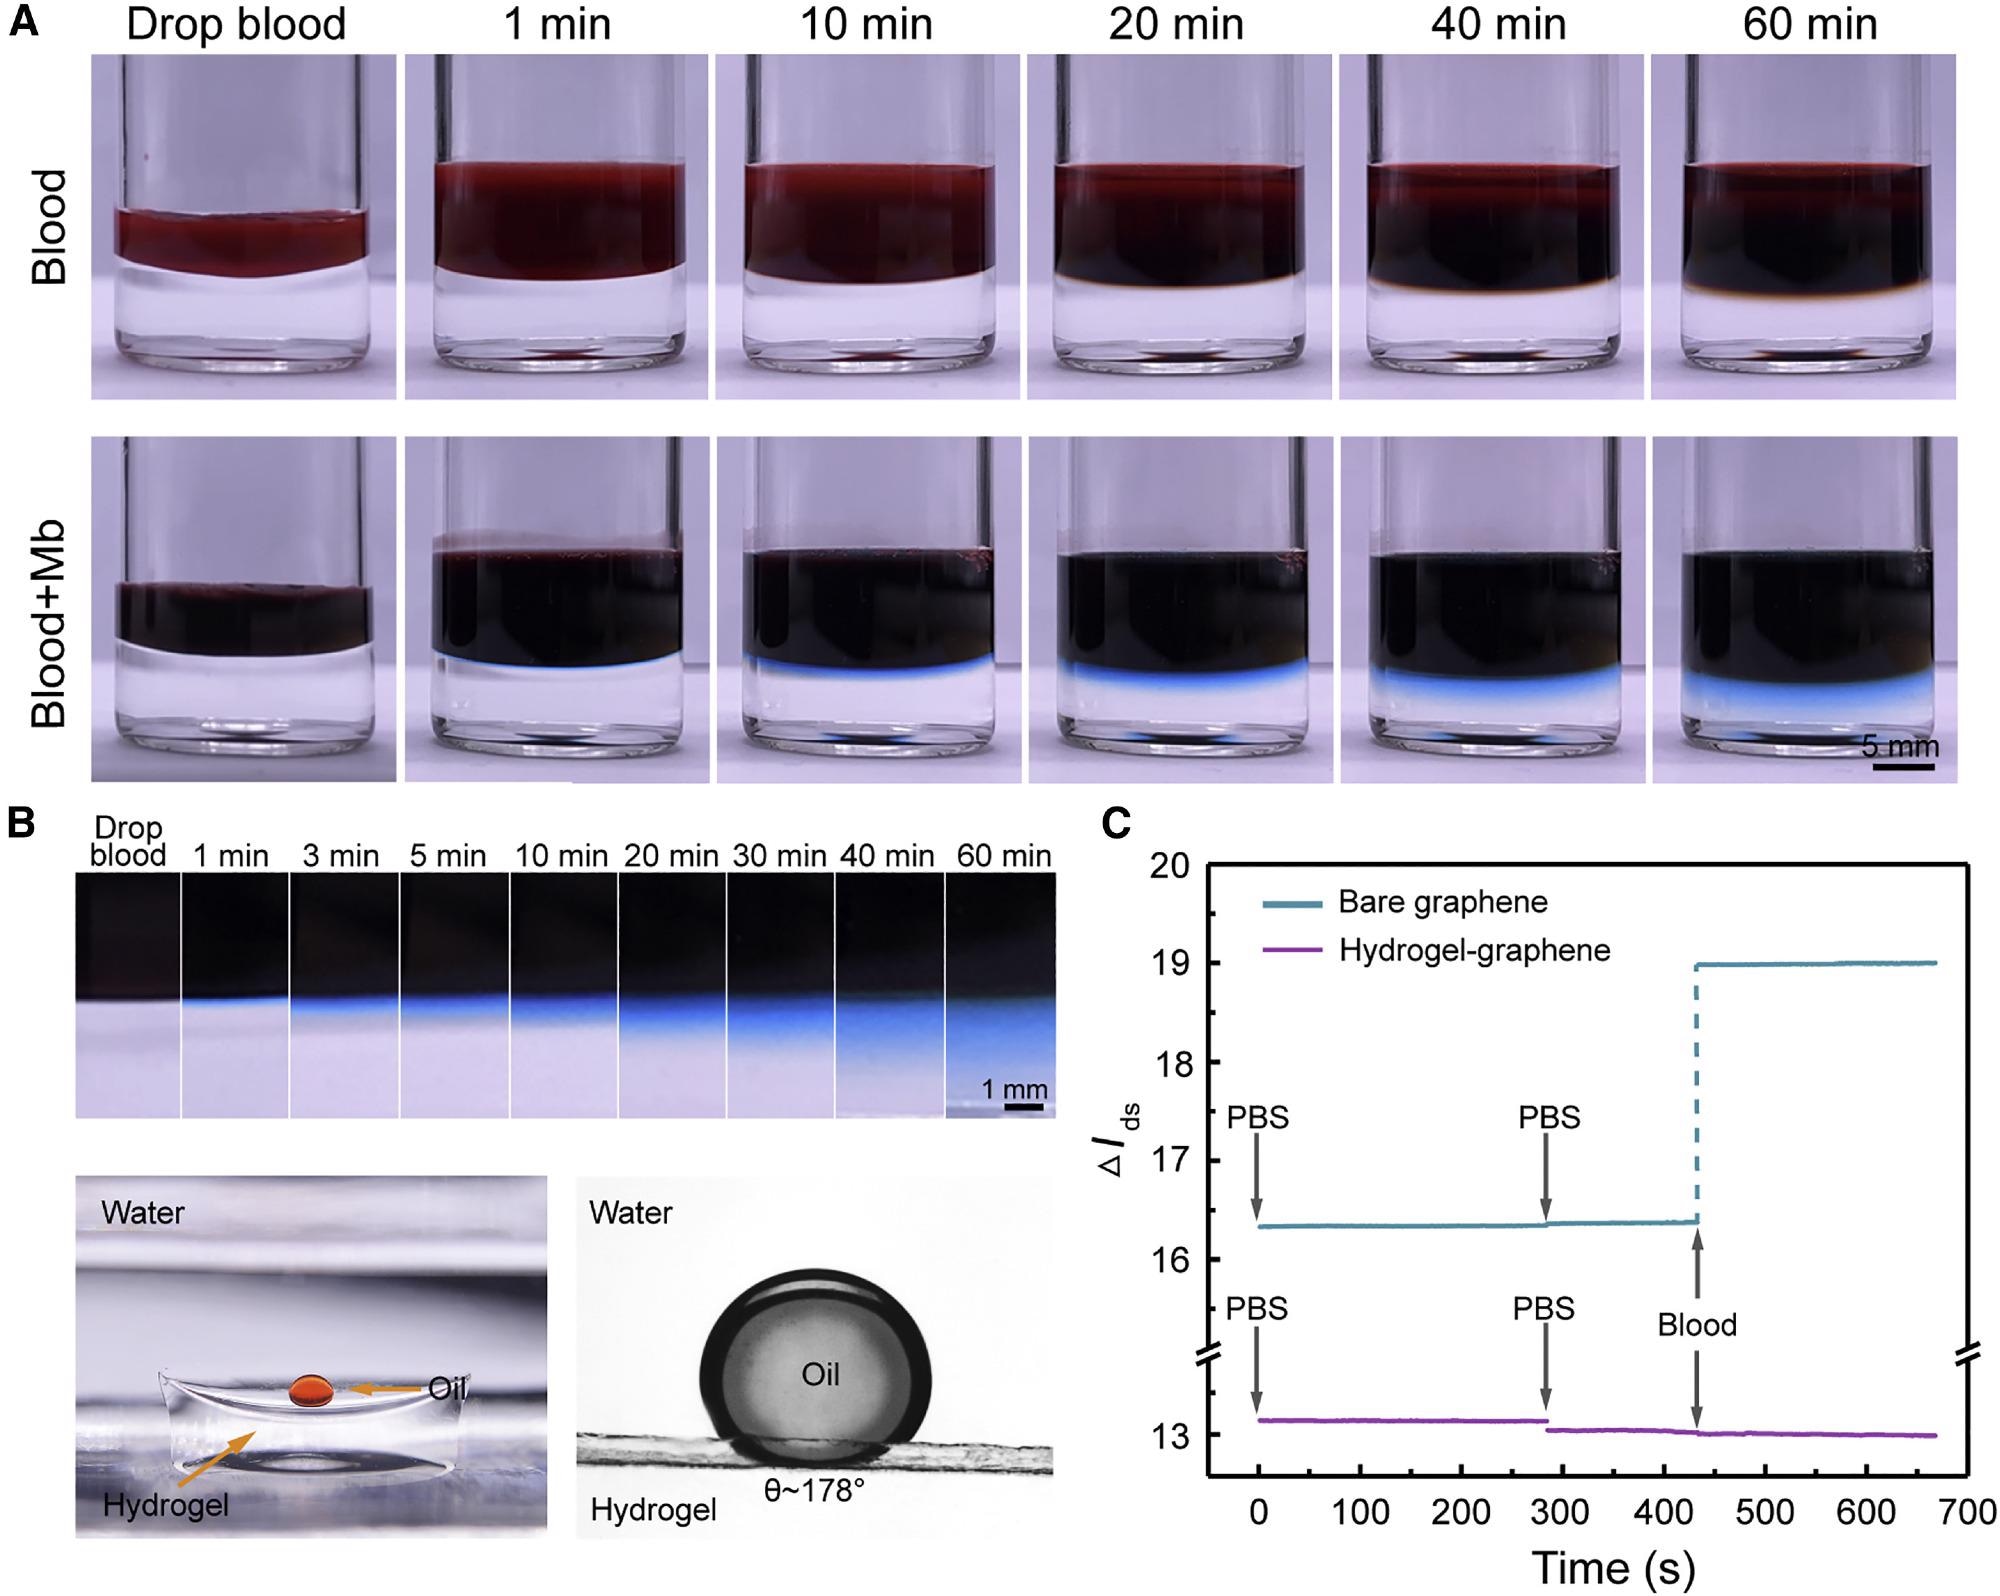
Figure 4. Characterization of the 3DA-biosensor self-filtration in whole blood. (A) Photograph of the H-AHL structure soaked in whole blood or blood with Mb from 0 to 60 min. (B) Top: serum dyed with Mb is significantly and rapidly immersed into the hydrogel. Bottom: hydrogel is super-oleophobic under the water with the contact angle about 178°. (C) Time-resolved measurement of bare graphene sensor (blue line) and the biosensor with H-AHL (purple line) in whole blood represents that the nonspecific adsorption of non-target molecules is minimized with the existence of H-AHL structure. Image Credit: Wang, et al., 2022
The VDirac changed continuously to the negative direction of the x-axis as the cTnI concentration grew from 1 x 10⁻⁷ to 1 nM, comparable to the case of the device tested in pure buffer, with a maximum VDirac value of 0.051 V in serum (Figure 5A).
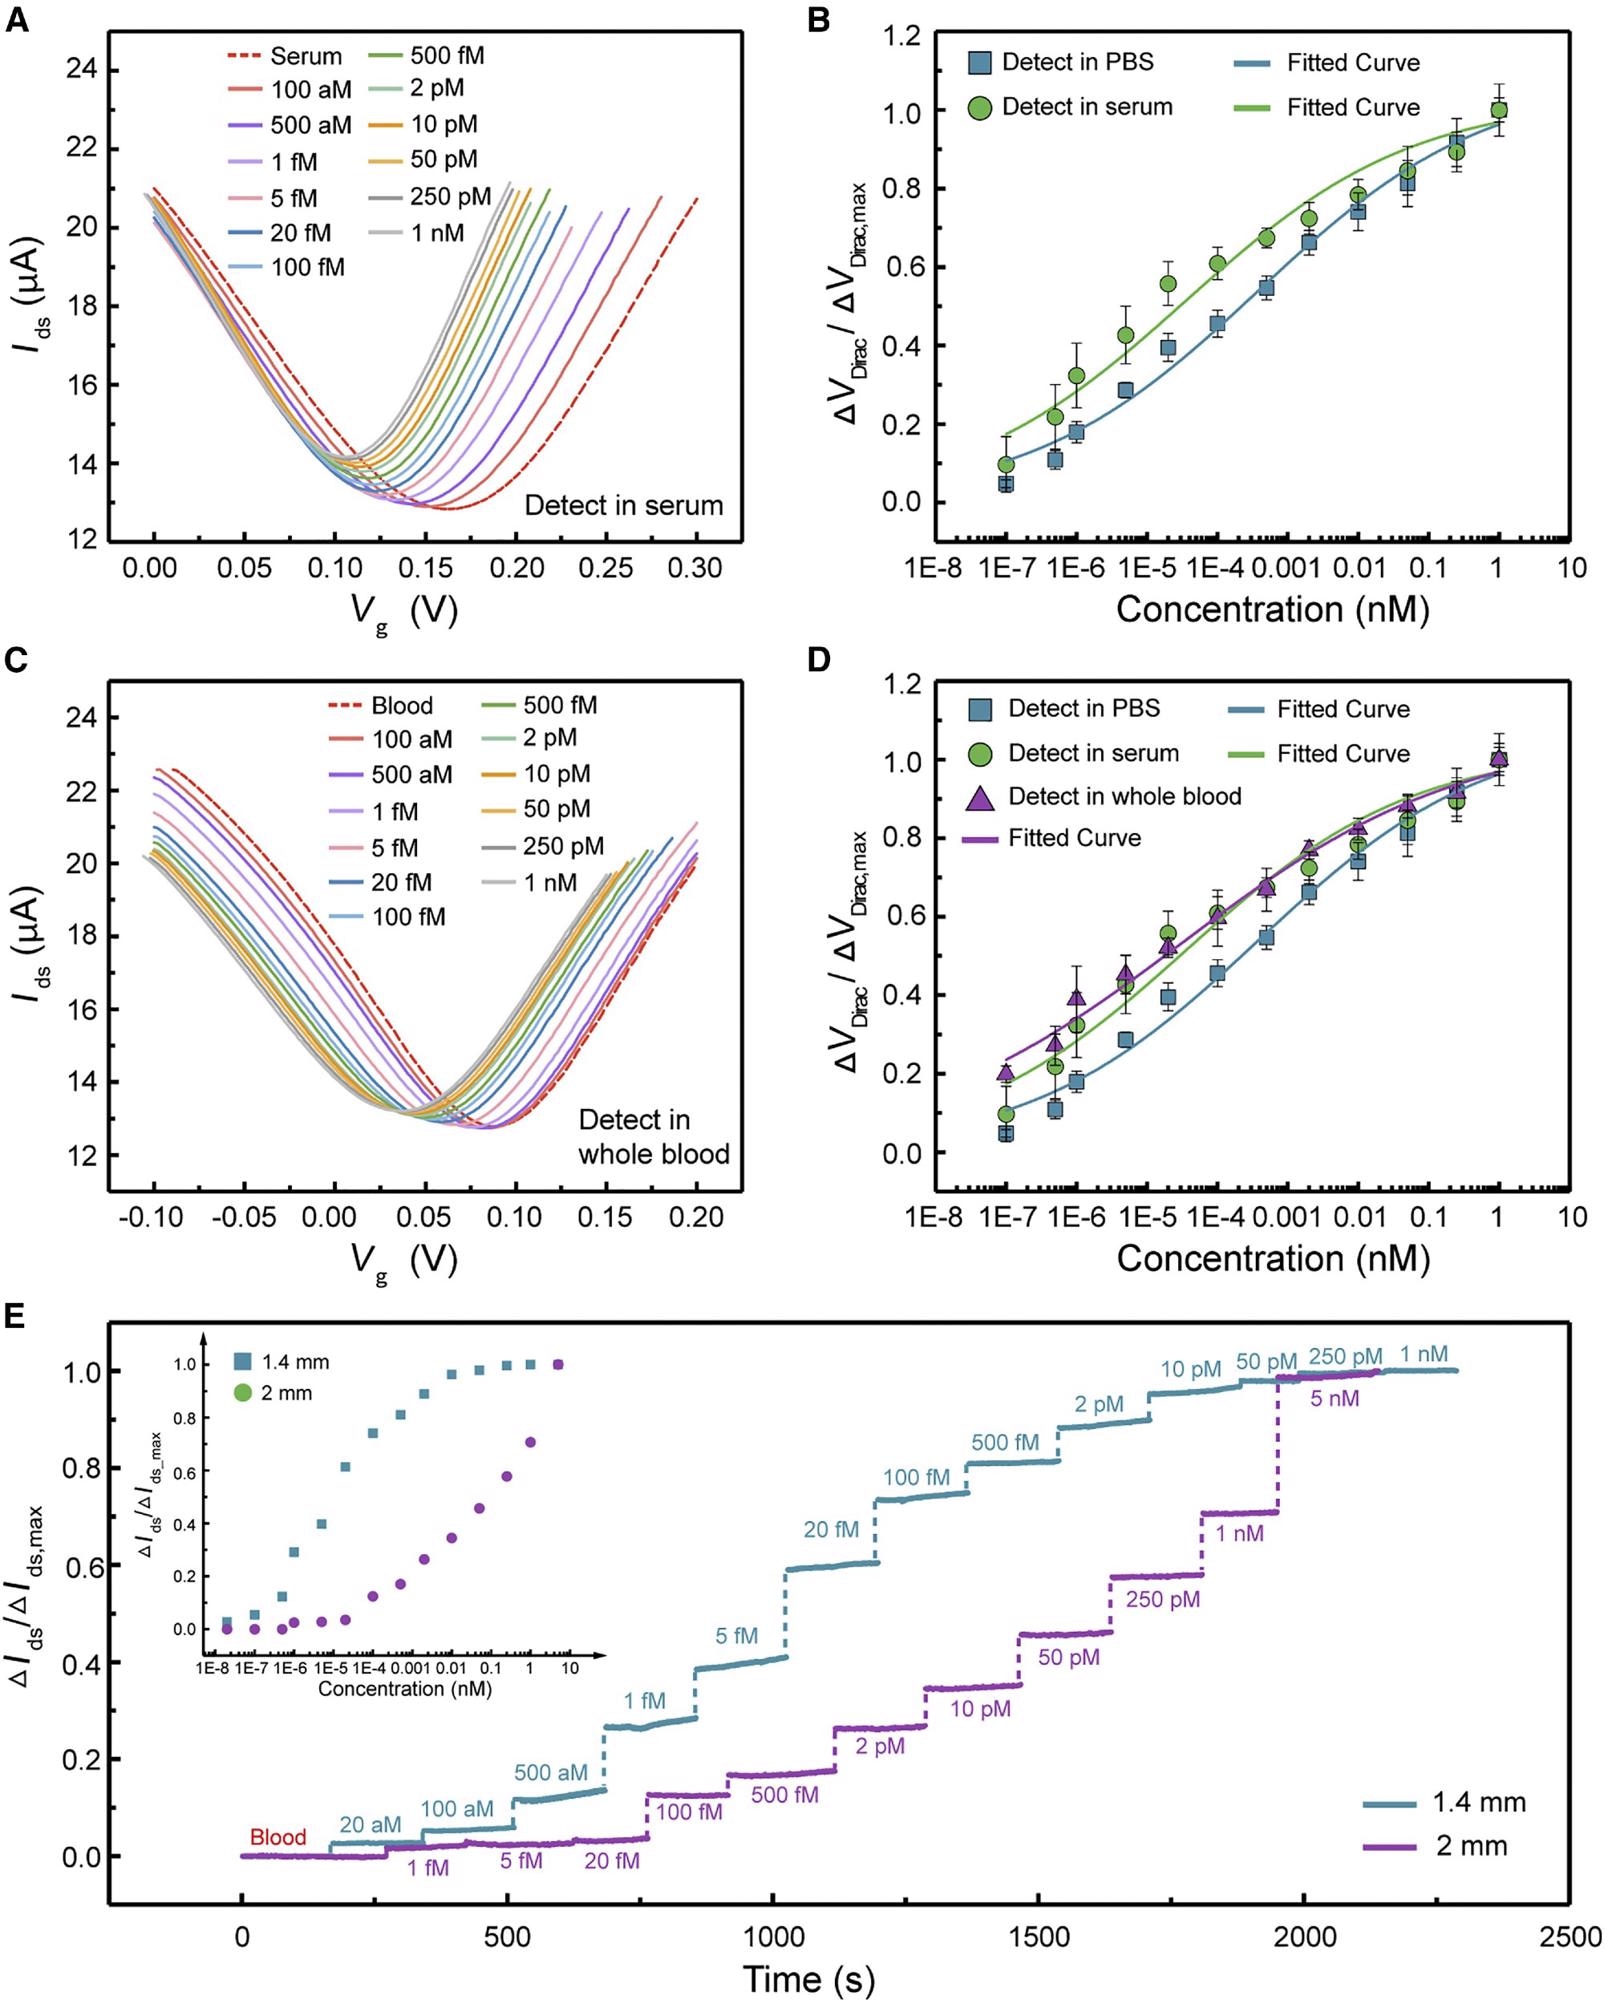
Figure 5. Biomarker detection of 3DA-biosensor in serum and whole blood. (A) Transfer characteristic curves measured when the biosensor is exposed to cTnI protein in serum ranging from 1 × 10⁻⁷ to 1 nM. (B) Normalized ΔVDirac/ΔVDirac,max as a function of different concentrations of cTnI in 1 × PBS (square) and serum (circle). Each test was repeated three times (data are represented as mean ± SD). (C) Transfer characteristic curves measured when the biosensor is exposed to cTnI protein in whole blood ranging from 1 × 10⁻⁷ to 1 nM. (D) Normalized ΔVDirac/ΔVDirac,max as a function of various cTnI concentrations in 1× PBS (square), serum (circle), and whole blood (triangle). Each test was repeated three times (data are represented as mean ± SD). (E) Real-time monitoring of cTnI in whole blood using 3DA-biosensor with 1.4 and 2 mm H-AHL structure. Inset is normalized ΔIds/ΔIds,max as a function of different cTnI concentrations in whole blood. Image Credit: Wang, et al., 2022
The hospital provided the patient’s samples, and the concentration of the target biomarker was determined in advance using medical diagnostic equipment (Figure 6A).
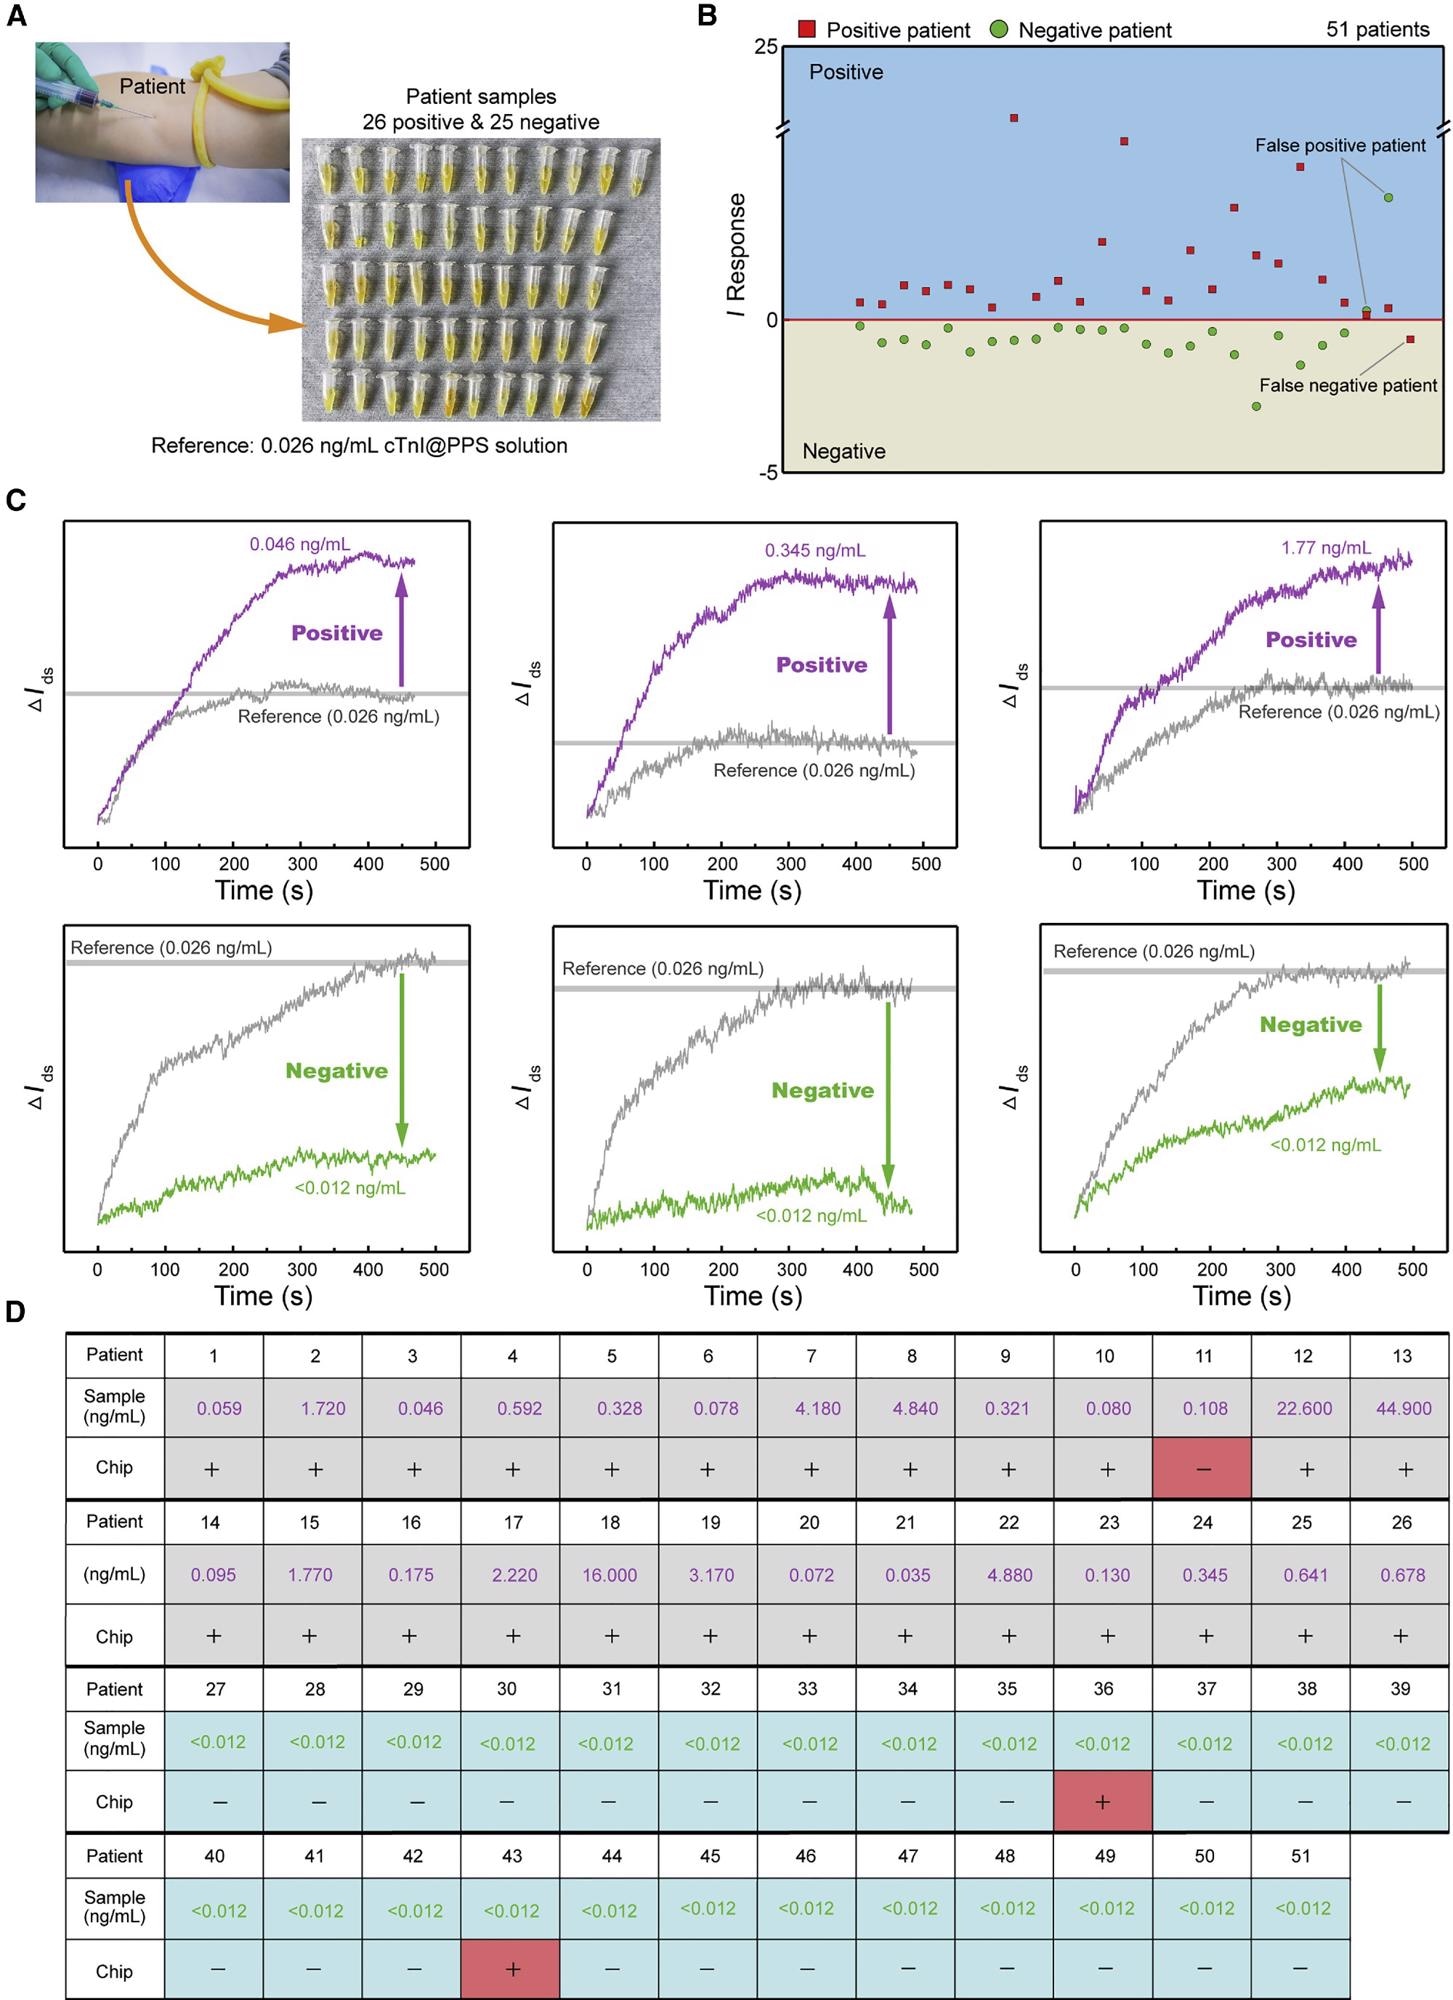
Figure 6. 3DA-biosensor analysis of patient samples for AMI detection. (A) Photograph of extraction of patient samples. (B) I response obtained by 3DA-biosensor in the presence of healthy and patient samples. I response of positive samples is greater than 0. (C) Signal outputs in real time for sample detection are compared with calibration baseline to define the positive or negative. (D) 3DA-biosensor results for the presence of healthy (<0.012 ng/mL) and AMI patient samples, as defined by I response greater than 0. Image Credit: Wang, et al., 2022
Table 1 shows a comparison of the 3DA-biosensor with earlier approaches.
Table 1. Comparison of the 3DA-biosensor with existing biosensors for cTnI detection. Source: Wang, et al., 2022
| Detection method |
Materials |
Samples |
LOD |
Reference |
| Electrochemical immunosensing |
graphene-carbon nanotube/antibody |
serum |
0.94 pg/mL |
Singal et al.53 |
| Electrochemical immunosensing |
Au nanoparticles/antibody |
PBS |
0.25 ng/mL |
Periyakaruppan et al.54 |
| Field-effect transistor |
silicon nanowire/antibody |
0.1× PBS |
0.092 ng/mL |
Kong et al.55 |
| Electrochemical immunosensing |
Pt nanoparticles/antibody |
PBS |
4.2 pg/mL |
Singal et al.56 |
| Electrochemiluminescence |
Au nanoparticles/antibody |
PBS |
2 pg/mL |
Sandil et al.57 |
| Electrochemical immunosensing |
graphene oxide/aptamer |
diluted serum |
0.07 ng/mL |
Liu et al.58 |
| Electrochemical immunosensing |
graphene oxide/aptamer |
serum |
0.6 pg/mL |
Villalonga et al.45 |
| Field-effect transistor |
graphene/hydrogel-aptamer hybrid layer |
serum, whole blood, patient samples |
28.1 ag/mL |
this work |
Conclusion
This research highlights the ultra-sensitive and quick detection of AMI in patient samples utilizing a self-assembled 3DA-biosensor. The findings enable assessments of a wide range of AMI biomarkers in whole blood, overcoming basic problems faced by almost all graphene-based sensors, such as sensitivity limitations and interference from non-target molecules.
The H-AHL structure increases the density of aptamers per projected area while also empowering the GFET’s self-filtration capabilities, allowing for high-gain and ultra-sensitive detection of cTnI in whole blood at concentrations ranging from 1 x 10⁻⁷ to 1 nM with a KD of 3.20 x 10⁻⁴ nM. Without any preprocessing, the 3DA-biosensor can determine the positive or negative for samples with an accuracy rate of more than 94%.
Researchers believe that, with further development, the 3DA-biosensor could be a very interesting approach to personalized health monitoring in people’s daily lives; it will also have a lot of applications in conjunction with artificial intelligence and big data processing.
Journal Reference:
Wang, Z., Hao, Z., Yang, C., Wang, H., Huang, C., Zhao, X. and Pan, Y. (2022) Ultra-sensitive and rapid screening of acute myocardial infarction using 3D-affinity graphene biosensor. Cell Reports Physical Science, p.100855. Available Online: https://www.sciencedirect.com/science/article/pii/S2666386422001291.
References and Further Reading
- Roth, G. A., et al. (2018) Global, regional, and national age-sex-specific mortality for 282 causes of death in 195 countries and territories, 1980–2017: a systematic analysis for the Global Burden of Disease Study 2017. Lancet,392, pp.1736–1788. doi.org/10.1016/S0140-6736(18)32203-7.
- Kazemi, T., et al. (2011) Risk factors for premature myocardial infarction: a matched case-control study. Journal of Research in Health Sciences, 11, pp. 77–82.
- Mohseni,J.,et al. (2017) A systematic review on the prevalence of acute myocardial infarction in Iran. Heart Views,18, p.125. dx.doi.org/10.4103%2FHEARTVIEWS.HEARTVIEWS_71_17.
- Teo, K. K.,et al. (2006) Tobacco use and risk of myocardial infarction in 52 countries in the INTERHEART study: a case-control study. Lancet,368, pp.647–658. doi.org/10.1016/S0140-6736(06)69249-0.
- Twig, G., et al. (2016) Body-mass index in 2.3 million adolescents and cardiovascular death in adulthood. The New England Journal of Medicine,374, pp.2430–2440. doi:10.1056/NEJMoa1503840.
- Vallabhajosyula, S.,et al. (2019) Hospital-level disparities in the outcomes of acute myocardial infarction with cardiogenic shock. The American Journal of Cardiology, 124, pp. 491–498. doi.org/10.1016/j.amjcard.2019.05.038.
- Bradley, S. M., et al. (2019) Incidence, risk factors, and outcomes associated with in-hospital acute myocardial infarction. JAMA Network Open, 2, p. e187348. doi.org/10.1001/jamanetworkopen.2018.7348.
- Čulić, V., et al. (2002) Symptom presentation of acute myocardial infarction: influence of sex, age, and risk factors. American Heart Journal, 144, pp. 1012–1017. doi.org/10.1067/mhj.2002.125625.
- Then, K. L. et al. (2001) Atypical presentation of acute myocardial infarction in 3 age groups. Heart Lung, 30, pp. 285–293. doi.org/10.1067/mhl.2001.116010.
- Wang, Z., et al. (2021) A flexible and regenerative aptameric graphene–Nafion biosensor for cytokine storm biomarker monitoring in undiluted biofluids toward wearable applications. Advanced Functional Materials, 31, p. 2005958. doi.org/10.1002/adfm.202005958.
- Hao, Z.,et al. (2021) An intelligent graphene-based biosensing device for cytokine storm syndrome biomarkers detection in human biofluids. Small, 17, p. 2101508. doi.org/10.1002/smll.202101508.
- Bai, Y., et al. (2020) Graphene-based biosensors for detection of biomarkers. Micromachines, 11, p. 60. doi.org/10.3390/mi11010060.
- Docherty, C. J., et al. (2012) Extreme sensitivity of graphene photoconductivity to environmental gases. Nature Communications, 3, pp. 1-6. doi.org/10.1038/ncomms2235.
- Nakatsuka, N., et al. (2018) Aptamer–field-effect transistors overcome Debye length limitations for small-molecule sensing. Science, 362, pp. 319–324. doi.org/10.1126/science.aao6750.
- Wang, Z., et al. (2019) Free radical sensors based on inner-cutting graphene field-effect transistors. Nature Communications, 10, p. 1544. doi.org/10.1038/s41467-019-09573-4.
- Wang, Z., et al. (2019) An ultraflexible and stretchable aptameric graphene nanosensor for biomarker detection and monitoring. Advanced Functional Materials, 29, p.1905202. doi.org/10.1002/adfm.201905202.
- Zupančič, U., et al. (2021) Graphene enabled low-noise surface chemistry for multiplexed sepsis biomarker detection in whole blood. Advanced Functional Materials, 31, p. 2010638. doi.org/10.1002/adfm.202010638.
- Sun, X. F., et al. (2015) Graphene oxide–silver nanoparticle membrane for biofouling control and water purification. Chemical Engineering Journal, 281, pp. 53–59. doi.org/10.1016/j.cej.2015.06.059.
- Bay, H. H., et al. (2019) Hydrogel gate graphene field-effect transistors as multiplexed biosensors. Nano Letters, 19, pp. 2620-2626. doi.org/10.1021/acs.nanolett.9b00431.
- Wang, L., et al. (2021) Multifunctional conductive hydrogel-based flexible wearable sensors. Trends in Analytical Chemistry, 134, p. 116130. doi.org/10.1016/j.trac.2020.116130.
- Hao, Z., et al. (2020) Modulating the linker immobilization density on aptameric graphene field effect transistors using an electric field. ACS Sensors, 5, pp. 2503–2513. doi.org/10.1021/acssensors.0c00752.
- Cui, J., et al. (2014) Super-soft hydrogel particles with tunable elasticity in a microfluidic blood capillary model. Advanced Materials, 26, pp.7295–7299. doi.org/10.1002/adma.201402753.
- Xu, T., et al. (2019) Bioinspired superwettable micropatterns for biosensing. Chemical Society Reviews, 48, pp. 3153–3165. doi.org/10.1039/C8CS00915E.
- Song, Y., et al. (2020) Mini-pillar microarray for individually electrochemical sensing in microdroplets. Biosensors and Bioelectronics, 149, p. 111845. doi.org/10.1016/j.bios.2019.111845.
- Adams 3rd, J., et al. (1993) Cardiac troponin I. A marker with high specificity for cardiac injury. Circulation, 88, pp. 101–106. doi.org/10.1161/01.CIR.88.1.101.
- Thygesen, K., et al. (2010) Recommendations for the use of cardiac troponin measurement in acute cardiac care. European Heart Journal, 31, pp.2197–2204. doi.org/10.1093/eurheartj/ehq251.
- Sarangadharan, I., et al. (2018) High sensitivity cardiac troponin I detection in physiological environment using AlGaN/GaN High Electron Mobility Transistor (HEMT) Biosensors. Biosensors and Bioelectronics, 100, pp. 282–289. doi.org/10.1016/j.bios.2017.09.018.
- Jo, H., et al. (2015) Electrochemical aptasensor of cardiac troponin I for the early diagnosis of acute myocardial infarction. Analytical Chemistry, 87, pp. 9869–9875. doi.org/10.1021/acs.analchem.5b02312.
- Wang, C., et al. (2016) High-κ solid-gate transistor configured graphene biosensor with fully integrated structure and enhanced sensitivity. Advanced Functional Materials, 26, pp. 7668–7678. doi.org/10.1002/adfm.201602960.
- Sidstedt, M., et al. (2018) Inhibition mechanisms of hemoglobin, immunoglobulin G, and whole blood in digital and real-time PCR. Analytical and Bioanalytical Chemistry, 410, pp. 2569–2583. doi.org/10.1007/s00216-018-0931-z.
- Groen, J., et al. (1952) Evidence for the presence of insulin in blood serum. A method for an approximate determination of the insulin content of blood. Journal of Clinical Investigation, 31, pp. 97–106. doi.org/10.1172/JCI102583.
- Prin, C., et al. (1995) Isoelectric restriction of human immunoglobulin isotypes. Biochimica et Biophysica Acta - General Subjects,1243, pp.287–289. doi.org/10.1016/0304-4165(94)00187-3 .
- Wintersteiner, O & Abramson, H A (1933) The isoelectric point of insulin electrical properties of adsorbed and crystalline insulin. Journal of Biological Chemistry, 99, pp. 741–753. doi.org/10.1016/S0021-9258(18)76023-7.
- Peronnet, E., et al. (2007) Isoelectric point determination of cardiac troponin I forms present in plasma from patients with myocardial infarction. Clinica Chimica Acta, 377, pp. 243–247. doi.org/10.1016/j.cca.2006.10.006.
- Dong, X., et al. (2010) Electrical detection of DNA hybridization with single-base specificity using transistors based on CVD-grown graphene sheets. Advanced Materials, 22, pp. 1649–1653. doi.org/10.1002/adma.200903645.
- Ohshima, H & Ohki, S (1985) Donnan potential and surface potential of a charged membrane. Biophysical Journal, 47, pp. 673–678. doi.org/10.1016/S0006-3495(85)83963-1.
- Hajian, R., et al. (2019) Detection of unamplified target genes via CRISPR–Cas9 immobilized on a graphene field-effect transistor. Nature Biomedical Engineering, 3, pp. 427–437. doi.org/10.1016/S0006-3495(85)83963-1.
- Lee, D., et al. (2021) Ionic contrast across a lipid membrane for Debye length extension: towards an ultimate bioelectronic transducer. Nature Communications, 12, pp. 1–9. doi.org/10.1038/s41467-021-24122-8.
- Sisavath, N., et al. (2019) Transient incomplete separation facilitates finding accurate equilibrium dissociation constant of protein–small molecule complex. Angewandte Chemie, 131, pp. 6707–6711. doi.org/10.1002/ange.201901345.
- Rajesh, Z., et al. (2016) Genetically engineered antibody functionalized platinum nanoparticles modified CVD-graphene nanohybrid transistor for the detection of breast cancer biomarker, Her3. Advanced Materials Interfaces, 3, p. 1600124. doi.org/10.1002/admi.201600124.
- Chan, D & Ng, L L (2010) Biomarkers in acute myocardial infarction. BMC Medicine, 8, p. 34. doi.org/10.1186/1741-7015-8-34.
- Aydin, S., et al. (2019) Biomarkers in acute myocardial infarction: current perspectives. Vascular Health and Risk Management, 15, pp. 1–10. doi.org/10.2147/VHRM.S166157.
- Hao, Z., et al. (2019) Graphene-based fully integrated portable nanosensing system for on-line detection of cytokine biomarkers in saliva. Biosensors and Bioelectronics, 134, pp. 16–23. doi.org/10.1016/j.bios.2019.03.053.
- Wang, S., et al. (2020) Graphene field-effect transistor biosensor for detection of biotin with ultrahigh sensitivity and specificity. Biosensors and Bioelectronics, 165, p. 112363. doi.org/10.1016/j.bios.2020.112363.
- Villalonga, A., et al. (2021) Amperometric aptasensor with sandwich-type architecture for troponin I based on carboxyethylsilanetriol-modified graphene oxide coated electrodes. Biosensors and Bioelectronics, 183, p. 113203. doi.org/10.1016/j.bios.2021.113203.
- Shen, Q., et al. (2019) Label-Free electrochemical immunosensor based on a functionalized ionic liquid and helical carbon nanotubes for the determination of cardiac troponin I. ACS Omega, 4, pp. 11888–11892. https://doi.org/10.1021/acsomega.9b01152.
- Boeddinghaus, J., et al. (2018) Clinical validation of a novel high-sensitivity cardiac troponin I assay for early diagnosis of acute myocardial infarction. Clinical Chemistry, 64, pp. 1347–1360. doi.org/10.1373/clinchem.2018.286906.
- Keller, T., et al. (2009) Sensitive troponin I assay in early diagnosis of acute myocardial infarction. The New England Journal of Medicine, 361, pp. 868–877. doi.org/10.1056/NEJMoa0903515.
- McKinley, S., et al. (2004) International comparison of factors associated with delay in presentation for AMI treatment. European Journal of Cardiovascular Nursing, 3, pp. 225–230. doi.org/10.1016/j.ejcnurse.2004.06.004.
- Xue, T., et al. (2019) Ultrasensitive detection of miRNA with an antimonene-based surface plasmon resonance sensor. Nature Communications, 10, p. 28. doi.org/10.1038/s41467-018-07947-8.
- Hu, B., et al. (2017) An automated and portable microfluidic chemiluminescence immunoassay for quantitative detection of biomarkers. Lab Chip, 17, pp. 2225–2234. doi.org/10.1039/C7LC00249A.
- Storhoff, J. J., et al. (2004) Homogeneous detection of unamplified genomic DNA sequences based on colorimetric scatter of gold nanoparticle probes. Nature Biotechnology, 22, pp. 883–887. doi.org/10.1038/nbt977.
- Singal, S., et al. (2015) Electroactive graphene-multi-walled carbon nanotube hybrid supported impedimetric immunosensor for the detection of human cardiac troponin-I. RSC Advances, 5, pp. 74994–75003. doi.org/10.1039/C5RA15449A.
- Periyakaruppan, A., et al. (2013) Label-free detection of cardiac troponin-I using carbon nanofiber based nanoelectrode arrays. Analytical Chemistry, 85, pp. 3858–3863. doi.org/10.1021/ac302801z.
- Kong, T., et al. (2012) CMOS-compatible, label-free silicon-nanowire biosensors to detect cardiac troponin I for acute myocardial infarction diagnosis. Biosensors and Bioelectronics, 34, pp. 267–272. doi.org/10.1016/j.bios.2012.02.019.
- Singal, S., et al. (2014) Pt nanoparticles-chemical vapor deposited graphene composite based immunosensor for the detection of human cardiac troponin I. Sensors & Actuators, B: Chemical, 205, pp. 363–370. doi.org/10.1016/j.snb.2014.08.088.
- Sandil, D., et al. (2017) Biofunctionalized nanostructured tungsten trioxide based sensor for cardiac biomarker detection. Materials Letters, 186, pp. 202–205. doi.org/10.1016/j.matlet.2016.09.107.
- Liu, D., et al. (2018) A novel fluorescent aptasensor for the highly sensitive and selective detection of cardiac troponin I based on a graphene oxide platform. Analytical and Bioanalytical Chemistry, 410, pp. 4285–4291. doi.org/10.1007/s00216-018-1076-9.
- Yu, Y., et al. (2020) Biofuel-powered soft electronic skin with multiplexed and wireless sensing for human-machine interfaces. Science Robotics, 5, p. eaaz7946. doi.org/10.1126/scirobotics.aaz7946.
- Yang, Y & Gao, W (2019) Wearable and flexible electronics for continuous molecular monitoring. Chemical Society Reviews, 48, pp. 1465–1491. doi.org/10.1039/C7CS00730B.
- Yang, G., et al. (2020) Screening of aptamer for human IgG Fc Fragment by capillary electrophoresis-systematic evolution of ligands by exponential enrichment. Chinese Journal of Analytical Chemistry, 48, pp. 601–607. doi.org/10.1016/S1872-2040(20)60016-0.
- Hao, Z., et al. (2017) Real-time monitoring of insulin using a graphene field-effect transistor aptameric nanosensor. ACS Applied Materials & Interfaces, 9, pp. 27504–27511. doi.org/10.1021/acsami.7b07684.
- Baeissa, A., et al. (2010) DNA-functionalized monolithic hydrogels and gold nanoparticles for colorimetric DNA detection. ACS Applied Materials & Interfaces, 2, pp. 3594–3600. doi.org/10.1021/am100780d.