Mar 22 2019
A novel free data processing tool is being made accessible by Professor Andreas Schütze and his team of experts in measurement and sensor technology at Saarland University. The tool signifies the very core of a huge number of their research projects. The software package—known simply as “Dave”—is a MATLAB toolbox that allows pattern recognition, fast assessment of signals, and data visualization when processing vast datasets. The free software allows massive volumes of data, such as those generated by contemporary sensor systems, to be processed, examined, and visually exhibited very quickly, so that scientists can enhance their measurement systems interactively.
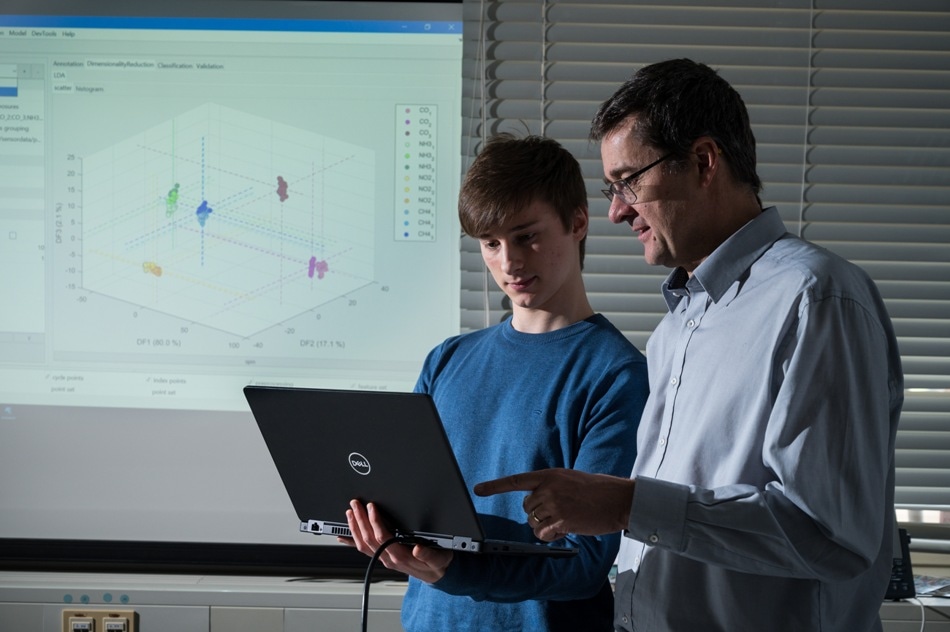 Open source software "Dave": Through visualization (example in the background), Prof. Andreas Schütze (r.) and his colleague Julian Joppich (left) make it easier to interactively optimize measuring systems. (Photo credit: Oliver Dietze)
Members of the study team will be at Hannover Messe from the 1st to the 5th of April (Hall 2, Stand B46) where they will be describing their open source software.
When engineers in research departments or research organizations perform experiments with sensor systems they gather massive amounts of data and have innumerable signals to examine—consequently, things tend to become very difficult very rapidly. Managing all of the numbers that pour in from the sensors can be tremendously challenging. One of the core tasks when setting up a sensor system is to improve the various parameters and variables so that the outcomes provide significant information. What are the settings that are truly the best ones is something that the scientists typically have to establish heuristically—and that may require some time. If the selected relationships turn out to be inappropriate, the entire number puzzle just collapses. Abruptly, those long sequences of measurements and all the following effort go to waste.
New software that has been created in Saarbrücken and has been made openly available to help scientists and companies steer through the data jungle. Instead of depending on a conventional and time-consuming trial and error method, the new software efficiently asks the question “What happens when...”.
Whenever we use our gas sensors to measure air pollutants, we are faced with the same old problem of analysing vast volumes of data and of recognizing signal patterns. If we want to continue to make our sensors more sensitive and more selective, we need to know whether very fine modifications to the sensors themselves and to the analysis actually bring about the desired improvements in sensitivity and selectivity. But there are countless ways in which sensors can be modified. We want to be able to identify the best paths as a rapidly as possible, or, equally, to quickly detect and reject the unproductive paths. Over a period of many years and over numerous research projects, we have been developing software that helps us achieve this goal. The software makes use of machine learning methodologies and enables us to identify patterns rapidly, to evaluate data cleanly and to visualize our results.
Andreas Schütze, Professor, Saarland University.
The scientists are currently circulating their software tool under a copyleft license. “Anyone may use the open source software, provided that when results are published, the authors make reference to Dave,” says Schütze.
It is possible to process any amount of sensor data using the Saarbrücken software tool. The software helps to quickly locate the ideal paths to follow.
Dave is the opposite of a black box. The software makes the calculations completely transparent. It shows the user that when they alter a particular parameter, it has a specific identifiable consequence. The visualization modules in Dave also make it easier to optimize a measurement system. The user can run through, test out and visualize different variants, and that helps the user find the most promising variants quickly and efficiently.
Manuel Bastuck, Developer of Dave Software and Research Assistant, Measurement Technology Lab.
Using Dave as a tool, we were able to rapidly achieve some widely acclaimed results in the field of condition monitoring in “Industry 4.0” applications. The results not only helped to solve the measurement problem itself, but also to configure the measuring system more simply and more cost-effectively.
Andreas Schütze, Professor, Saarland University.