A new, space-based map generated by scientists at NASA's Jet Propulsion Laboratory, Pasadena, Calif., in collaboration with the Italian Space Agency to assist in disaster response efforts shows the regions in the Philippines hit hardest by Super Typhoon Haiyan. The typhoon tore a wide swath of devastation across the island nation on Nov. 8, 2013.
The map, which depicts the storm's destruction, is available online at:
http://www.jpl.nasa.gov/spaceimages/details.php?id=PIA17687 .
 NASA-generated damage map to assist with typhoon Haiyan disaster response
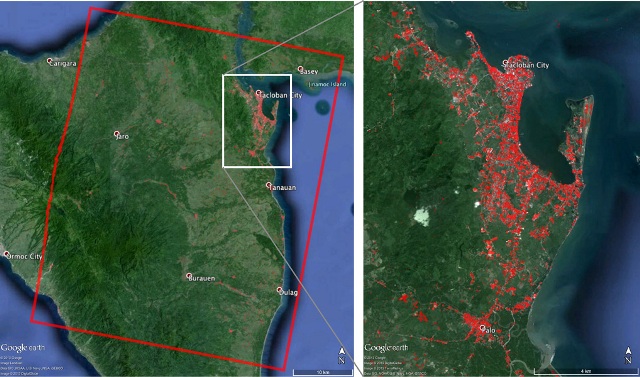
This 27-by-33-mile (43-by-53-kilometer) map covers a region near Tacloban City, where the massive storm, one of the most powerful ever recorded on Earth, made landfall. It was made from radar imagery obtained before and after the typhoon hit. It was processed by JPL's Advanced Rapid Imaging and Analysis (ARIA) team using X-band interferometric synthetic aperture radar data from the Italian Space Agency's COSMO-SkyMed satellite constellation. The technique uses a prototype algorithm to rapidly detect surface changes caused by natural or human-produced damage.
The technique is most sensitive to detecting destruction of the human-made environment. In the image, damage detected by radar is shown as an overlay on a Google Earth image. Areas in red reflect the heaviest damage to cities and towns in the storm's path. The estimated intensity of damage is proportional to the opacity of the red. When the radar observes areas that have little to no destruction, its image pixels are transparent. The satellite data used to generate the map span the time frame from Aug. 19 to Nov. 11, 2013. Each pixel in the damage map measures approximately 33 yards (30 meters) across.
ARIA is a JPL- and NASA-funded project being developed by JPL and the California Institute of Technology, Pasadena, Calif. It is building an automated system for providing rapid and reliable GPS and satellite data to support the local, national and international hazard monitoring and response communities. Using space-based imagery of disasters, ARIA data products can provide rapid assessments of the geographic region affected by a disaster, as well as detailed imaging of the locations where damage occurred.
NASA is making the data publicly available for agencies that might be responding to the event through the U.S. Geological Survey's Earth Resources Observation and Science (EROS) Data Center's Hazards Data Distribution System, as well as through NASA's ARIA website.
The ARIA team began developing and evaluating this technique using case studies from the magnitude 6.3 earthquake in Christchurch, New Zealand, in February 2011 to detect building damage, landslides and liquefaction. Following the magnitude 9.0 earthquake in Tohoku, Japan, in March 2011, the team used the technique to assess tsunami damage, as well as ground deformation from high-rate GPS network and imaging radar satellites. Those ground-deformation data were downloaded more than 1,400 times within the first two days they were available. Following last year's Hurricane Sandy, the team produced damage maps that were delivered to the International Charter 11 days after landfall and subsequently validated with crowdsourcing with the assistance of the GISCorps.
The ARIA team continues to improve its response time for generating products -- the Haiyan satellite data were available three days after landfall and were processed within 11 hours of data acquisition. The improved response time has been aided by NASA's recent joint collaboration with the Italian Space Agency, which operates four identical radar satellites.
For more information about ARIA, visit: http://aria.jpl.nasa.gov .
Source: http://www.nasa.gov