Everyone has been delayed on their way home, on their commute, or when traveling for vacations. In some cases, delays can be anticipated, and it is possible to add extra time to the duration of the trip to accommodate for these delays. But, unexpected delays can cause serious issues for travelers, shippers, and businesses. Unexpected delays can occur for a range of reasons, from adverse weather conditions and road closures to incidents.
Image Credit: SMATS Traffic Solutions Inc
Road traffic congestion is measured with annual average travel time. However, the result is often not the same as what drivers experience day to day, or as the time they recall due to unexpected delays.
As a result, other measures should be reported in conjunction with average travel time to report on levels of congestion.
Travel Time Reliability (TTR) measures help in calculating the unexpected delays.
Travel Time Reliability (TTR) Measures
Travel time reliability consists of the following measures, making up TTR’s main components.
Travel Time Index (TTI):
Travel Time Index is the ratio of the average travel time in peak hours to free-flow travel time. The TTI denotes the average extra time needed for a trip during peak hours, compared with the same trip duration in no-traffic, or free-flow, conditions. To calculate free-flow travel time, divide the road length by maximum speed limit of the road.
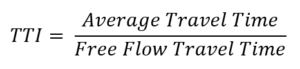
For example, if the average travel time is 5 minutes, and free-flow travel is 4 minutes, the TTI would be calculated as 1.25, showing that the trip will take 25% longer in peak hours over a journey with no congestion. It is possible to calculate TTI for different temporal grouping schemes, such as X-minute intervals, by time of the day, day of the week and month, and even for the entire year. For each of these groups, TTI can also be calculated for weekdays and weekends separately.
Buffer Index (BI):
Buffer time represents the additional time added to journeys due to unexpected delays that commuters should consider along with the average travel time. Taking BI into account can help commuters to be at their destination on time 95% of the time. The buffer index calculation is as follows:
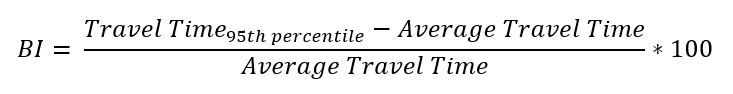
The buffer index is expressed as a percentage. For example, if the buffer index is 20% and the average travel is 10 minutes, then the buffer time would be 2 minutes. As it is calculated by 95th percentile travel time, it represents practically all worst-case delay scenarios, while also assures that travelers will be on-time for 95% of all of their trips.
Planning Time Index (PTI):
The planning time index shows the ratio of the 95th percentile to the free-flow travel time and shows the total time needed for travelers to be on time for 95% of all of their trips.
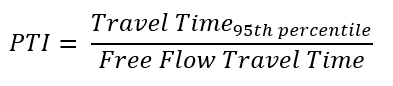
There is a difference between buffer index and planning time index: BI denotes the extra delay time that should be added to the average travel time, and PTI demonstrates the total trip time (calculated by taking the average travel time + the buffer time).
A PTI value of 2.0 suggests that travelers should spend twice as much time traveling as they would need to in free-flow conditions to arrive at their destination on-time 95% of the time. The planning time index is useful as it is possible to directly compare it to the travel time index on similar numeric scales.
Different percentile values can be used in place of the 95th percentile. This value depends on the individual’s desired level of reliability. It should be noted that the lower percentile value, the lower the reliability.
90th or 95th Percentile Travel Times
This measure is the simplest method that represents the travel time of the most congested day. It is easily understandable for drivers because the results are measured in minutes. However, it is not possible to compare different trips with the 90th or 95th percentile because of their various lengths. It is also hard to aggregate the trips’ travel time and report as a subarea or citywide average.
Percentage of Travel under Congestion (PTC)
The percentage of travel under congestion is the percentage of all vehicles’ miles traveled (VMT) in congested conditions in a specified duration. The PTC measure can be aggregated in the similar temporal fashion for TTI.
Frequency that Congestion Exceeds Some Expected Threshold
This measure gives the percentage of days or times that the congestion will exceed an expected threshold. The threshold can be set on travel time or speed data, especially when you capture the traffic data 24/7. This measure is typically reported on weekday peak hours.
The figure below shows TTR indices on a travel time distribution chart taken from SMATS iNodeTM:
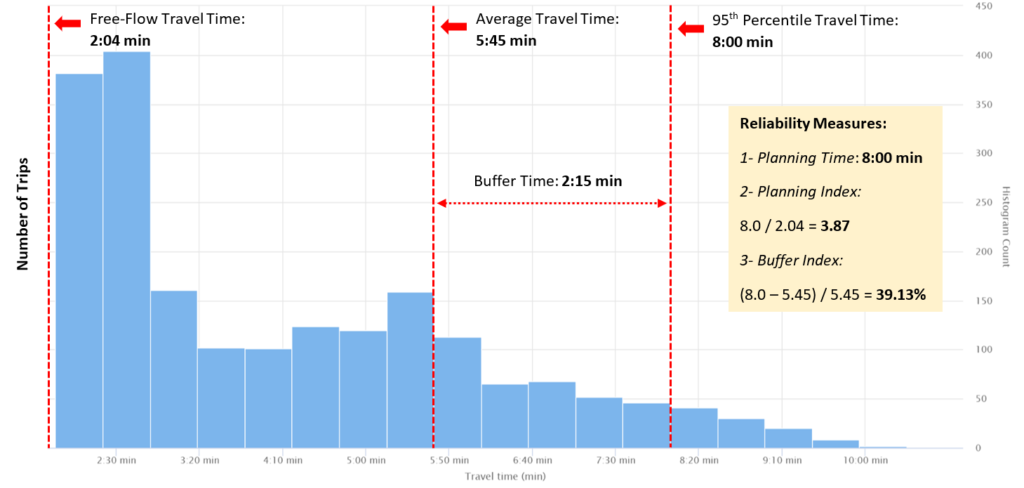
An example of travel time distribution chart in iNodeTM. Image Credit: SMATS Traffic Solutions Inc.
Source: U.S. Federal Highway Administration

This information has been sourced, reviewed and adapted from materials provided by SMATS Traffic Solutions Inc.
For more information on this source, please visit SMATS Traffic Solutions Inc.