Ultrasonic sensors are often used for a broad range of non-contact proximity, presence, or distance measuring applications. Such devices generally send a brief pulse of ultrasonic sound toward a specific target, where the sound is reflected back to the sensor.
The system subsequently quantifies the time for the echo to go back to the sensor and uses the speed of sound in the medium to calculate the distance to the target. The same transducer can be utilized to both send and receive the sound, or individual transducers can also be employed to do the same process.
Figure 1 depicts a sensor that makes use of a single transducer for sending and receiving, and Figure 2 depicts a sensor that utilizes two transducers separately to transmit and receive.
Generally, a sensor containing two transducers will have the ability to detect echoes at a closer distance to the device. This is because the low level echo signal is not obstructed by the larger signal that is still decaying from the transmitted voltage pulse.
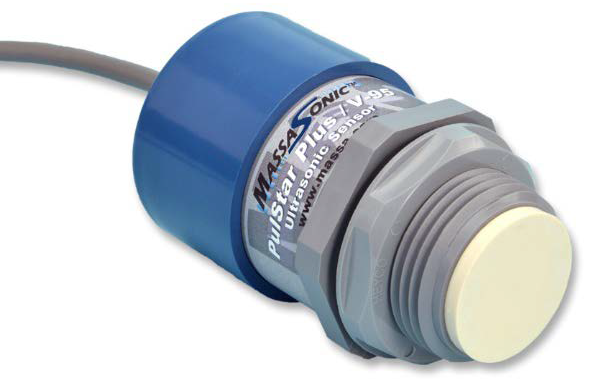
Figure 1. Photograph of a MassaSonic™ PulStar™ sensor that uses the same transducer for transmitting and receiving sound. Image Credit: Massa Products Corp.
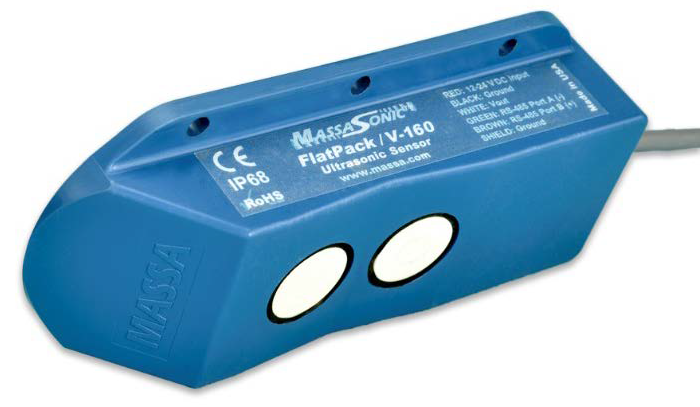
Figure 2. Photograph of a MassaSonic™ FlatPack™ sensor that uses one transducer to transmit the sound pulse and a second transducer to receive the returned echo. Image Credit: Massa Products Corp.
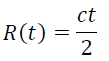
The range between the sensor and the target is calculated by using the following equation:
 |
(1) |
where R(t) stands for the distance to the target, c indicates the speed of sound, and t refers to the time from the transmission until the echo returns.
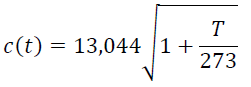
To find out the speed of sound, a majority of the sensors consider air as the transduction medium, quantify the temperature, and subsequently estimate the speed of sound by using the following equation.
 |
(2) |
where c(t) refers to the speed of sound in inches/seconds or a function of temperature, and T refers to the temperature in °C.
Figure 3 shows a curve demonstrating the speed of sound as a function of temperature using Equation (2). Figure 4 includes curves that show the time of the arrival of echo for varying distances to a target for a sensor working in the 20°C atmosphere using Equation (1).
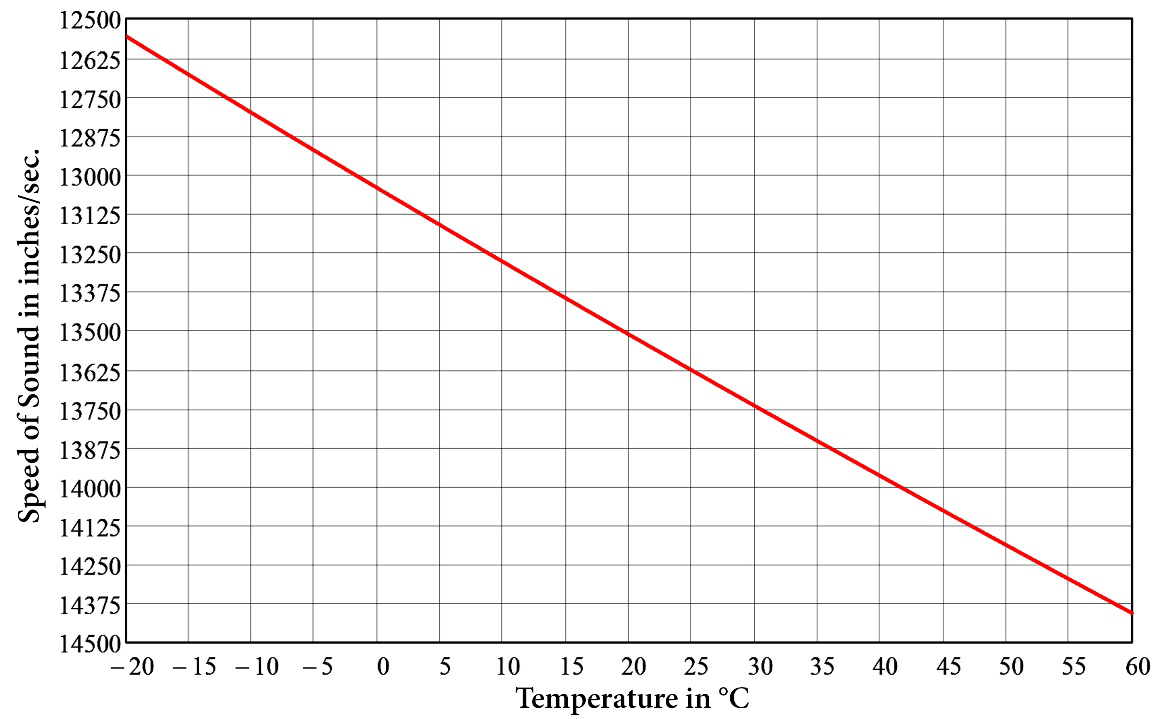
Figure 3. Speed of sound in air as a function of temperature using Equation (2). Image Credit: Massa Products Corp.

Figure 4. Echo arrival time as a function of target distance from the sensor in 20 °C air using Equation (1). Image Credit: Massa Products Corp.
Wavelength of Sound as a Function of Sound Speed and Frequency
The wavelength of sound moving in a medium is a function of the speed and frequency of the sound wave. The wavelength is calculated by:
 |
(3) |
where λ refers to the wavelength, c indicates the speed of sound, and f refers to the frequency.
In Figure 5, a plot of the wavelength of sound at room-temperature air is shown as a function of frequency.
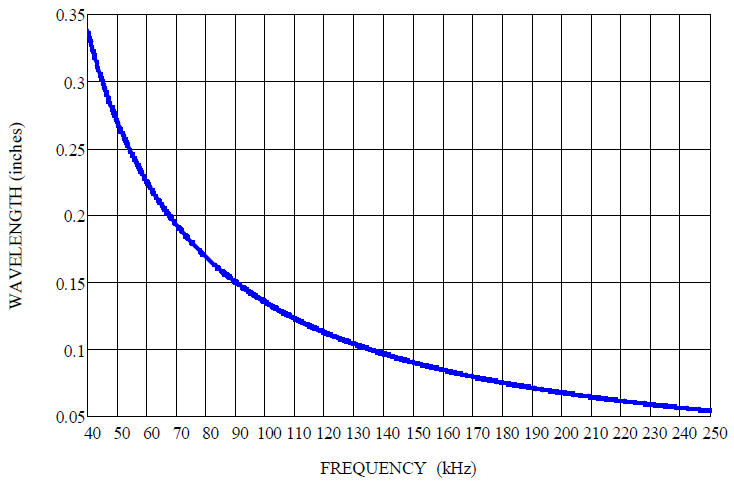
Figure 5. Plot of the wavelength as a function of frequency for air at room temperature using Equation (3). Image Credit: Massa Products Corp.
Acoustic Radiating Patterns of Sensors
Within an ultrasonic sensor, the transducers can radiate sound in various patterns. Transducers that radiate sound in a conical pattern are used by a majority of the sensors.
The beam angle of the conical pattern is the total angle covering where the sound pressure being radiated has been decreased by 3 dB on either side of the peak pressure directly generated in front of the transducer. Produced by a circular radiating surface, the beam angle is a function of the sound wavelength and the surface diameter.
The beam pattern or acoustic radiation pattern is defined as the relative sensitivity of a transducer as a function of spatial angle. Factors, like the shape, size and acoustic phase properties of the vibrating surface and the frequency of operation, determine this pattern.
The beam patterns of transducers are reciprocal in nature, which implies that the beam will remain the same regardless of using the transducer as a receiver or a transmitter. It must be noted that the beam pattern of the system is not the same as the receiving or transmitting beam pattern of the transducers, and this will be further described in the following section.
Transducers can be developed to radiate sound in several different kinds of patterns, from very narrow beams to omnidirectional beams.
In the case of a transducer that has a circular radiating surface vibrating in phase, as is generally employed in ultrasonic sensor applications, the narrowness of the beam pattern is, in fact, a function of the ratio of the diameter of the radiating surface to the wavelength of sound at the operating frequency.
If the diameter of the transducer is larger than the wavelength of sound, the sound beam will be narrower. For instance, the total beam angle will be around 30° if the diameter is double the wavelength, but the total beam angle will be decreased to around 6° if either the frequency or diameter is changed to make the ratio 10.
Since the increase in the wavelength is inversely proportional to the decrease in frequency, a transducer should have a bigger diameter to generate the same beam angle at a lower frequency. A large-sized transducer compared to the size of a wavelength not only creates a narrow main beam but also creates secondary lobes isolated by nulls.
Figure 6 depicts a 3D representation of the beam pattern generated by a transducer with a diameter larger than a wavelength. As seen in Figure 6, the beam pattern creates a narrow conical beam and several secondary lobes of decreased amplitude isolated by nulls.
Although the beam is referred to as conical, it lacks straight sides and a flat top as the term 'conical' may suggest.
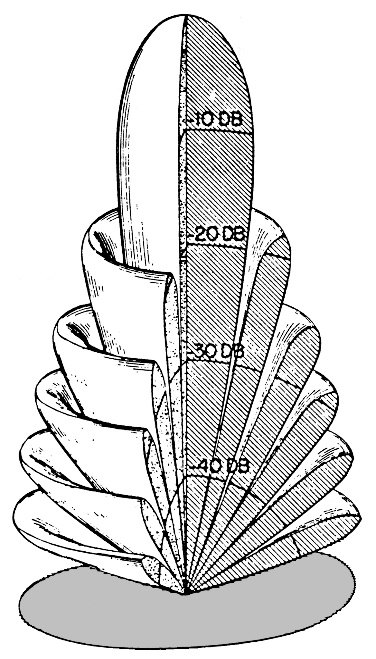
Figure 6. Three-dimensional representation of the beam pattern produced by a transducer with a diameter large compared to a wavelength. Image Credit: Massa Products Corp.
The beam angle is often described as the measurement of the total angle in which the sound pressure level of the main beam has been decreased by 3 dB on either side of the on-axis peak.
But at greater angles, the transducer continues to have the sensitivity, in the main beam as well as in the secondary lobes. The formula for the radiation pattern of a circular rigid piston in an endless baffle as a function of spatial angle is as follows:
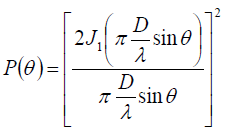 |
(4) |
where P(θ) refers to the relative sound pressure as a function of angle, θ refers to the angle of the sound pressure from an axis perpendicular to the piston center, D is the piston diameter, λ is the sound wavelength, and J1 refers to the first-order Bessel function.
Beam patterns are generally mapped on a decibel scale in which the sound pressure as a function of spatial angle is calculated as:
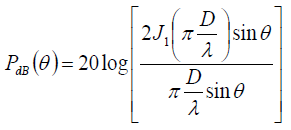 |
(4a) |
where PdB(θ) refers to the relative sound pressure in dB as a function of the spatial angle.
When it comes to explaining the beam patterns of transducers, 2D plots are generally employed. These plots reveal the relative sensitivity of the transducer versus angle in a single plane cut via the 3D beam pattern. In the case of a symmetrical conical pattern, for example, the one illustrated in Figure 6, a simple 2D plot will explain the whole 3D pattern.
Figure 7 illustrates a 2D polar plot ranging from −90° to +90° of the beam of a circular radiating piston mounted in an endless baffle with a diameter equivalent to two wavelengths of sound.
The pattern, as illustrated, is smooth as a function of angle, and the −3 dB points are at −15° and +15° off-axis, creating a total beam angle of 30°. But the total angle of the main radiating lobe between the first two nulls is around 70°, and the side lobes peak at around −55° and +55°.
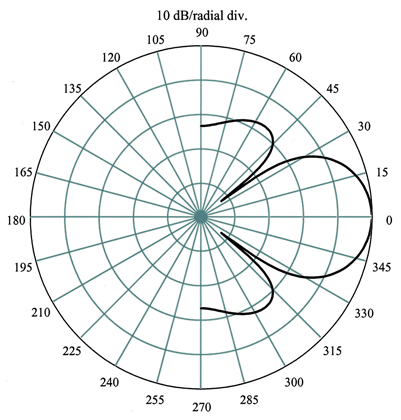
Figure 7. A two-dimensional polar plot is shown which represents the beam pattern of a transducer mounted in an infinite baffle with a circular disk radiator (diameter/wavelength = 2). Image Credit: Massa Products Corp.
Figure 8 depicts 2D plots on rectilinear coordinates of the beam patterns of circular piston radiators for many different values of D/λ.
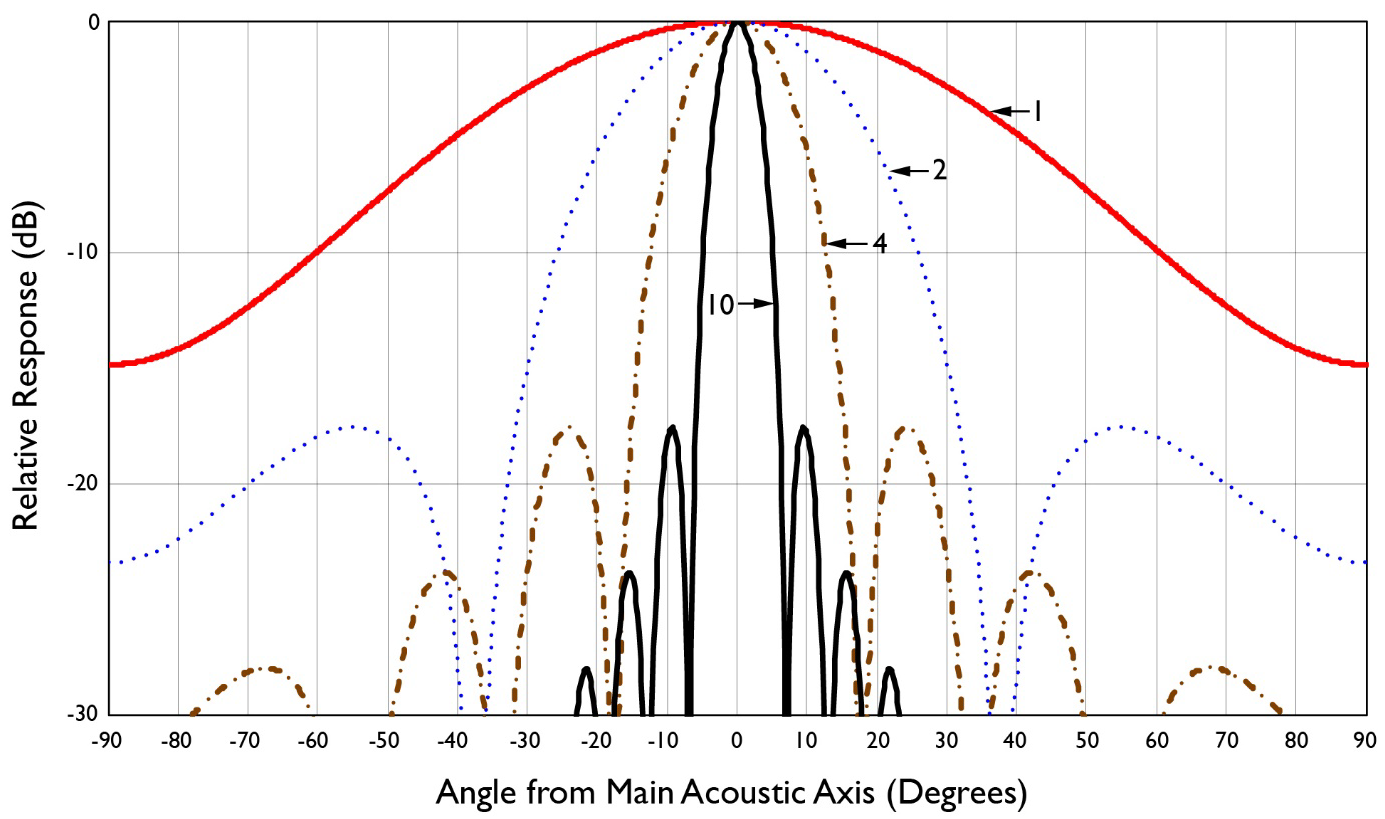
Figure 8. 2D plots on rectilinear coordinates showing the beam patterns of four different circular piston radiators in an infinite baffle having a diameter to wavelength ratios, D/λ, of 1, 2, 4, and 10. Image Credit: Massa Products Corp.
Whenever transducers are used, it is crucial to understand that proximal unnecessary targets that are beyond the beam angle could be unintentionally detected. This is because the transducers are still sensitive at angles higher than the beam angle.
A few transducers employed in sensing applications, like MassaSonic™ Sensors, are particularly developed to remove or decrease the secondary lobes to prevent the detection of unnecessary targets.
System Beam Patterns
During the operation of an echo-ranging system, the transmitting transducer transmits sound at decreased amplitudes at varied angles, as explained by the beam pattern of the transmitting transducer. And as described by the beam pattern of the receiving transducer, the receiving transducer has less sensitivity to echoes that arrive at angles off-axis.
Therefore, such off-angle echoes will be decreased by both the lower sensitivity of the receiving transducer and the lower sound pressure of the transmitted pulse. This creates a system beam pattern that is the sum in dB of the beam patterns of the receiver and the transmitter.
In Figure 9, the solid curve demonstrates a plot of the beam pattern of Figure 7 on rectilinear coordinates for angles ranging between 0° and 30° off-axis. Such a beam pattern is the same for the transducer, irrespective of whether it receives or transmits.
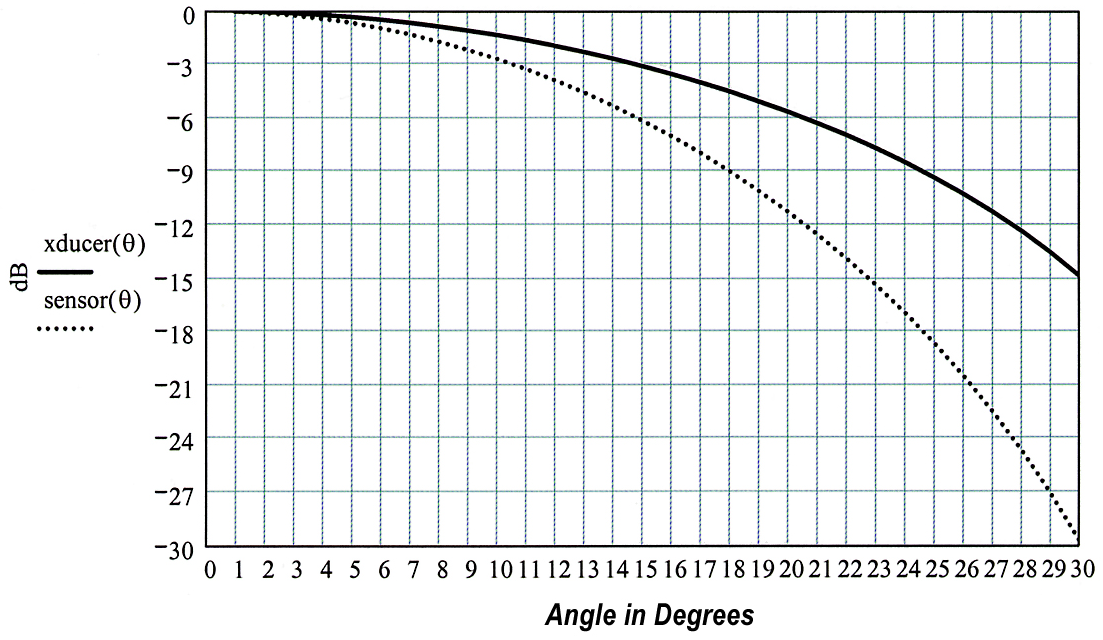
Figure 9. The transducer beam pattern of Figure 7 is plotted on rectilinear coordinates as the solid curve, and the system beam pattern for a sensor using the transducer to both transmit and receive is plotted as the dotted curve. Image Credit: Massa Products Corp.
The dotted curve indicates the beam pattern of the system when the transducer is utilized to send a sound pulse and a transducer that has the same beam pattern is utilized to receive the reflected echo. As shown, the beam pattern of the system is narrower than the transducer pattern alone.
Should Sensors Have Narrow or Broad Beam Patterns?
Figure 10 shows a standard ultrasonic sensor application. It demonstrates the sensor deployed on a tank to quantify the level of liquid within. The sensor uses an ultrasonic transducer that has a narrow radiation pattern of 10°.
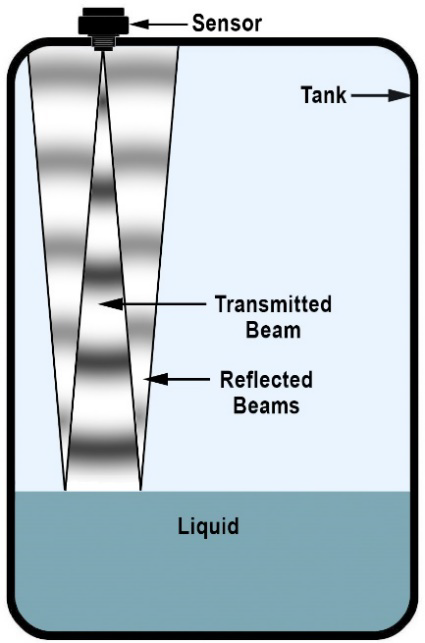
Figure 10. Illustration showing an ultrasonic sensor mounted on a tank transmitting a conical ultrasonic beam that reflects from the liquid surface. Image Credit: Massa Products Corp.
Narrow beam angles are preferred in this kind of application where the reflecting surface is smooth and flat. Generally, a narrow beam angle will create a longer detection range because the entire sonic energy from the transducer is radiated into a compact sector of space, thereby boosting the sound pressure of the transmitted pulse.
But sensors with wider beam patterns are more preferable for quantifying uneven solid or turbulent fluid levels. The sound pulse reflects in several different directions from the various irregular surfaces of the target, and therefore, the part of the pulse pointing directly from the sensor will probably not reflect directly back to the sensor.
But if the sound beam is striking a bigger surface area, there is a greater possibility that some portion of the sound energy will reflect back to the sensor. Solid material in a tank, like grain, can also create a sloped surface, rather than a flat level surface produced by a liquid.
This can make the sound beam reflect off from the sensors, making it impossible to detect the echo. Furthermore, lower frequency sensors will work better on rough surfaces due to the longer wavelengths of the sound.
Figure 11 shows a couple of tanks comprising a solid material, like grain with a somewhat sloped surface induced by the grain penetrating the tank from the top.
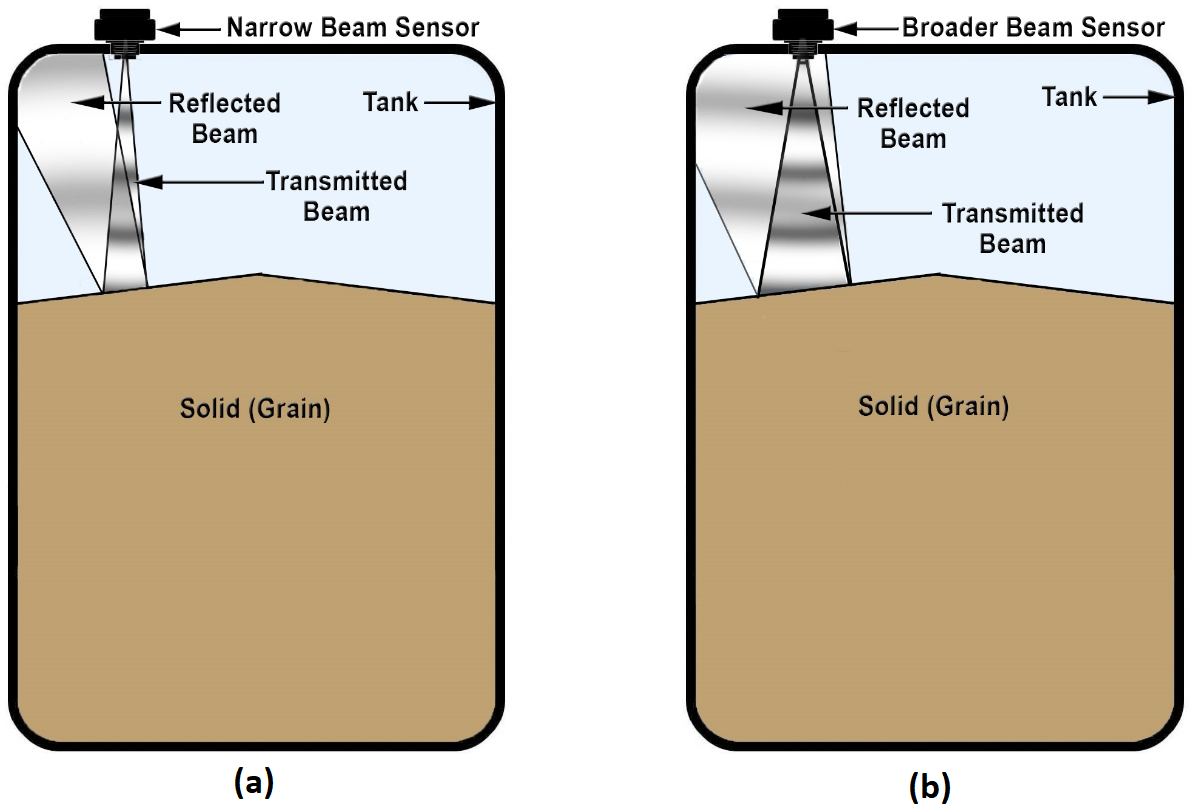
Figure 11. Illustration showing a narrow beam sensor and a broader beam sensor mounted on tanks with their conical beams reflecting from the sloped surface of solid material such as grain. (a) Narrow beam reflects away from sensor and echo is undetected. (b) Broader beam reflects back to sensor and echo is detected. Image Credit: Massa Products Corp.
Figure 11(a) illustrates how the echo from a narrow beam sensor reflects from the sloped surface of the material in the tank away from the transducer so that it is not detected.
Figure 11(b) illustrates that the echo from a wider beam sensor returns to the transducer after reflecting from the same sloped surface of the material in the tank, and it is detected.

This information has been sourced, reviewed and adapted from materials provided by Massa Products Corp.
For more information on this source, please visit Massa Products Corp.