In order to develop MEMS devices, it is essential to compare computer simulation with precise experimental data for validating and refining models. A combination of a Polytec Laser Vibrometer and a Wafer Probe Station makes it easy to acquire this validation data.
Micromechnical Scanners
Inside a bar code scanner are lots of tiny mirrors that reflect light across the bar code at a rate of several hundred passes per second. The dark areas of the bar code will not reflect as much light as the lighter colored areas. Two-dimensional bar codes can only be read by scanning in both the X and Y directions. This slows down the scanning process and increases the need for a high-quality laser beam.
Laser projection systems produce video images by modulating the brightness of the laser beam through an extremely quick area scan. This type of laser display requires a fast scanning speed and high beam quality. For example, up to 48,000 lines are written in one second. To ensure that the laser beam is not distorted during scanning, the mirror surface must remain very flat. These mechanical components must also be small, robust and affordable. A collaboration between the Fraunhofer IZM Institute and the Center for Microtechnology at the Chemnitz University of Technology has resulted in the development of such micromechnical scanners (Figure 1).
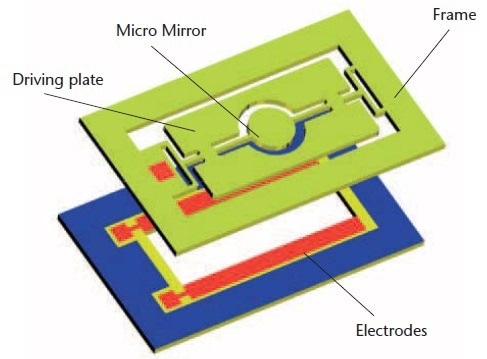
Figure 1: Construction of a micro-scanner.
In terms of size, these mechanically moving parts can be anywhere from several microns to a few millimeters. Manufacturing methods and lithography technology from the semiconductor industry are used to efficiently produce these high-performance mirrors. An electrostatic field is produced between two electrodes which then mechanically drives the mirrors.
Simulation of MEMS Properties
Many mathematical simulations are required to design and develop MEMS devices. It would be far too expensive and time-consuming to carry out actual experiments on the manufacturing processes. Validated simulation models are required for precise prediction of system response. As such, if models are required to predict interactions between electrical quantities and a multitude of physical quantities then they can become quite complex. The accuracy of the simulation serves as a basis for dimensioning and, as such, dictates whether the MEMS components reach the target specification after manufacturing. Therefore, it is crucial that these simulation models are tested and fine-tuned through comparisons with experimental data. Reliable measurement data on MEMS devices is required for such an undertaking, and parameters must then be extracted from the data that validate the simulation models.
Parameters Relevant to Manufacturing
Measuring parameters relevant to manufacturing is another task necessary for controlling the manufacturing process. This means gathering information on process parameters and their effects on geometric quantities and material parameters of the MEMS components. Only a small amount of information is required to control the manufacturing process meaning that a wide range of measurement data needs to be condensed. Processes for adapting model parameters are still being trialed and tested to solve this problem. Such processes can be used with MEMS components to estimate the thickness of layers or the level of mechanical stress in the materials. Data can be accumulated at any stage of the manufacturing process from wafer-level MEMS components using for precise qualified measurement technology.
Experimental Setup
Information on the dynamic deformation of movable components is contained within measurement data from MEMS components in the form of time series or frequency response functions. One proven technique for optically detecting the mechanical movement of MEMS structures is a combination of a Polytec Laser Vibrometer and a Wafer Probe Station) as shown in Figure 2. There is minimal influence on the device from the measurement procedure with optical probing. Measurements on structures even as tiny as single cells of micro-mirror arrays are possible as the laser beam on the test sample has a diameter in the range of a few micrometers.
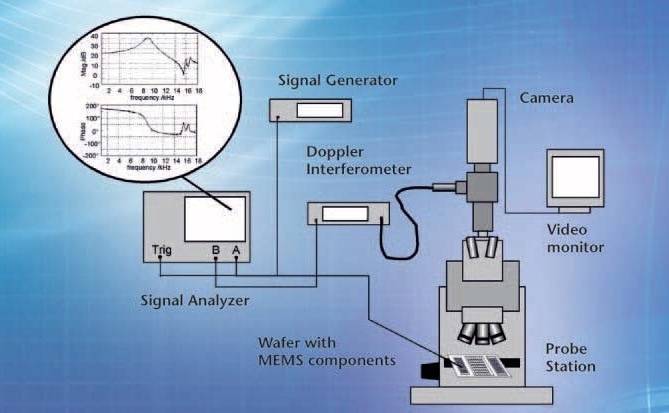
Figure 2: Probe station with Polytec Microscope Scanning Vibrometer.
Simulation – Measurement – Parameter Adaptation
Following an FEM analysis of the MEMS device, the mechanical behavior at a large number of geometric locations can be described through the generation of several simulation models. The results can reflect the behavior of a mechanical system with a large number of resonance points and degrees of freedom as the method allows the allocation of six degrees of freedom to each location. However, in practical terms only a few degrees of freedom are truly relevant, for such an ensemble of points and as such it helps to reduce the order of these models. The accuracy of the model can be verified by measuring models with lumped elements. Techniques are available to create such models.
Experimental data is taken in parallel on mechanical vibrations induced by excited MEMS components. The vibration amplitudes can be between several hundred picometers and a few microns. The input signals from which the frequency transfer function is derived are provided by recording both the excitation signal and the resulting system response. Finally, a best fit for the measured system response data is identified by adapting the parameters of the reduced order model.
Three approaches are used to make this adaptation - the evaluation of resonance frequencies, the comparison with the model’s eigen frequencies and the least squares fitting method. By comparing the calculated and measured reaction or by comparing the model parameters before and after adaptation, the accuracy of the simulation can be determined. By taking various outline conditions as a basis, the behavior of the MEMS components can be simulated using the adapted model.
It is possible to quantify material or geometry parameters and refer to these for process control.
Example: MEMS Scanner
An experiment was carried out to determine the stiffness and geometry of the torsion bands and to determine the mechanical damping caused by the air flow. The torsion bands flexibly connect the micro-mirrors, driving plate and the frame with each other.
In the first instance, a numerical analysis of the eigen frequencies, deflection shapes and mechanical damping caused by the air flow was carried out using a finite element model (Figures 3 and 4). A simple model with lumped elements was created by reducing the model order (Figure 5).
Figure 3: First (top) and second (down) natural deflection shape of the scanner.

Figure 4: FEM analysis of damping by air flow, pressure distribution.
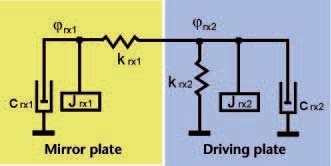
Figure 5: Model after reduction of order.
The second step was to measure the frequency transfer functions at different locations on the MEMS scanner and to read the eigen frequencies (Figure 6).
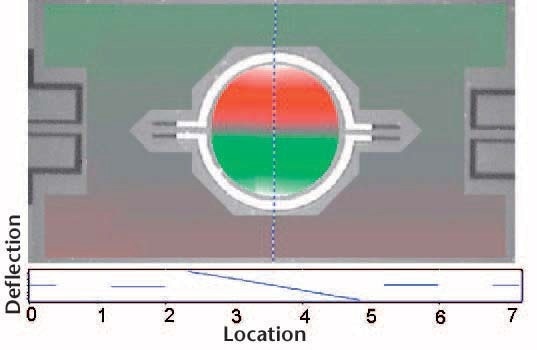
Figure 6.1: Measurement results with the Microscope Scanning Vibrometer: deflection shape.
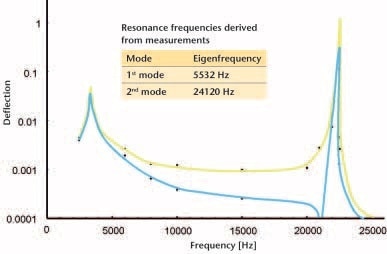
Figure 6.2: Measurement results with the Microscope Scanning Vibrometer: transfer function.
The difference between the calculated and the measured eigen frequencies formed the eigen value residuum and the least squares method was used to correct the stiffness matrix. As a final step, the calculated and measured vibration amplitudes can be referred to in order to adapt the damping matrix.
Summary
The geometry and material parameters of micromechnical components can be determined by processing measurement and simulation data through the adaption of model parameters. Efficient data acquisition is achieved through a Laser Doppler Vibrometer and a Wafer Probe Station. This measurement technique and adaptation of parameters are currently being fine-tuned through collaborative efforts from researchers at the Fraunhofer IZM and their colleagues at Polytec.

This information has been sourced, reviewed and adapted from materials provided by Polytec.
For more information on this source, please visit Polytec.