It is relatively straightforward to compare basic camera specifications such as interface, frame rate and resolution. Comparing imaging performance of cameras such as temporal dark noise, quantum efficiency and saturation capacity is much more difficult, however.
The first step in this process is understanding what these various measurements mean. For example, how is signal to noise ratio different from dynamic range? What is quantum efficiency, and should this be measured at the peak or at a particular wavelength?
This article aims to answer these questions, outlining how best to compare and select cameras based on imaging performance data while following the EMVA1288 standard.
EMVA1288 is a standard that defines which aspects of camera performance should be measured to ascertain its effectiveness. The standard also outlines how these measurements should be performed and how the results should be presented to ensure this is done in a unified manner.
The first section of this article will explore the different aspects of the imaging performance of an imaging sensor. It will summarize key considerations around how an image sensor converts light into a digital image and ultimately dictates the sensor’s performance.
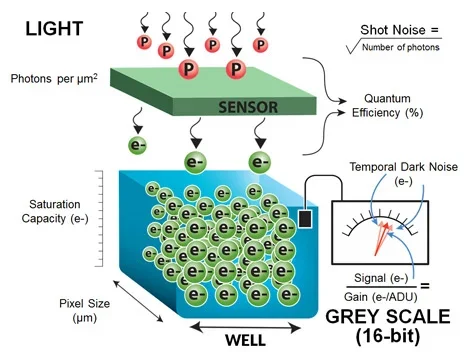
Figure 1. Image Credit: FLIR Systems
Figure 1 uses the example of a single pixel to highlight these concepts.
It is important to first understand the noise inherent in the light itself. Light is comprised of discrete particles (photons), which are generated by a light source. Because a light source will generate photons at random intervals, there will be a degree of noise in the perceived intensity of the light.
The physics of light dictates that noise observed in the intensity of light is equivalent to the square root of the number of photons generated by the light source in question. This specific type of noise is known as Shot Noise.
The number of photons observed by a pixel is dependent on exposure times and light intensity. Therefore this article will consider the number of photons to be a combination of exposure time and light intensity.
Pixel Size has a non-linear effect on the sensor’s ability to collect light because this must be squared to ascertain the light-sensitive area.
Digitizing light involves a number of steps, the first of which is to convert the photons to electrons. This article presents the measure of the efficiency of the conversion rather than focusing on how sensors achieve this, however.
The ratio of electrons generated during digitization to photons is referred to as Quantum Efficiency (QE). The sensor shown in Figure 1 has a QE of 50%, for example. This is because 3 electrons are generated when 6 photons “fall” on the sensor.
Electrons are stored within the pixel prior to digitization. This is referred to as the well. The number of electrons that may be stored within the well is referred to as the Well Depth or Saturation Capacity. Should the well receive more electrons than the saturation capacity, it will fail to store any further electrons.
Once the pixel has finished collecting light, the charge in the well will be measured. This measurement is referred to as the Signal, and the signal measurement in Figure 1 is represented by an arrow gage, while the error associated with this measurement is referred to as Read Noise or Temporal Dark Noise.
Finally, Grey Scale is calculated by converting the signal value (in electrons) into a 16-bit Analog to Digital Units (ADU) pixel value. The ratio between the analog signal value to digital grey scale value is commonly known as Gain and this value is measured in electrons per ADU.
It is important to note that the gain parameter defined within the EMVA1288 standard is not to be confused with the gain found within the ‘analog to digital’ conversion process.
It is common to refer to Signal to Noise Ratio and Dynamic Range when evaluating camera performance. Both of these performance measures take into account the ratio of noise observed by the camera in relation to the signal.
Dynamic Range only considers Temporal Dark Noise, however, while the Signal to Noise Ratio will also include the root mean square (RMS) total of Shot Noise.
Absolute sensitivity threshold is the number of photons required in order to acquire a signal that is equivalent to the noise observed by the sensor. This is a key metric because it represents the theoretical minimum amount of light required to observe any meaningful signal.
FLIR conducted an industry-first comprehensive study of imaging performance, investigating over 70 camera models to assess sensors and camera performance in line with the EMVA1288 standard.
Table 1. Source: FLIR Systems
| Measurement |
Definition |
Influenced by |
Unit |
| Shot noise |
Square root of signal |
Caused by nature of light |
e- |
| Pixel size |
Well, pixel size… |
Sensor design |
µm |
| Quantum efficiency |
Percentage of photons converted to electrons
at a particular wavelength |
Sensor design |
% |
Temporal
dark noise
(Read noise) |
Noise in the sensor when there is no signal |
Sensor and camera design |
e- |
Saturation capacity
(Well depth) |
Amount of charge that a pixel can hold |
Sensor and camera design |
e- |
Maximum signal
to noise ratio |
Highest possible ratio of a signal to all noise included in that signal, including shot noise and temporal dark noise.” |
Sensor and camera design |
dB, bits |
| Dynamic range |
Ratio of signal to noise including only temporal dark noise |
Sensor and camera design |
dB, bits |
Absolute sensitivity
threshold |
Number of photons needed to have signal
equal to noise |
Sensor and camera design |
Ƴ |
| Gain |
Parameter indicating how big a change in
electrons is needed to observe a change in
16 bit ADUs (better known as grey scale) |
Sensor and camera design |
e-/
ADU |
Comparing Low Light Performance of Cameras
Applications such as optical character recognition (OCR) and license plate recognition (LPR) commonly use monochrome imaging, but the amount of light that a camera is able to collect may be limited as a result of short exposure times.
It is relatively simple to ascertain the frame rate, resolution and field of view necessary to resolve an imaging issue, but confirming that the camera offers sufficient imaging performance can be challenging.
Trial and error remains the most common approach to this challenge. For example, a vision system designer may conclude that a 30 FPS VGA camera with ¼ ’’ CCD is sufficient for an application, and initial tests may confirm that the camera offers sufficient sensitivity at a 10 ms exposure time when the object being imaged is stationary.
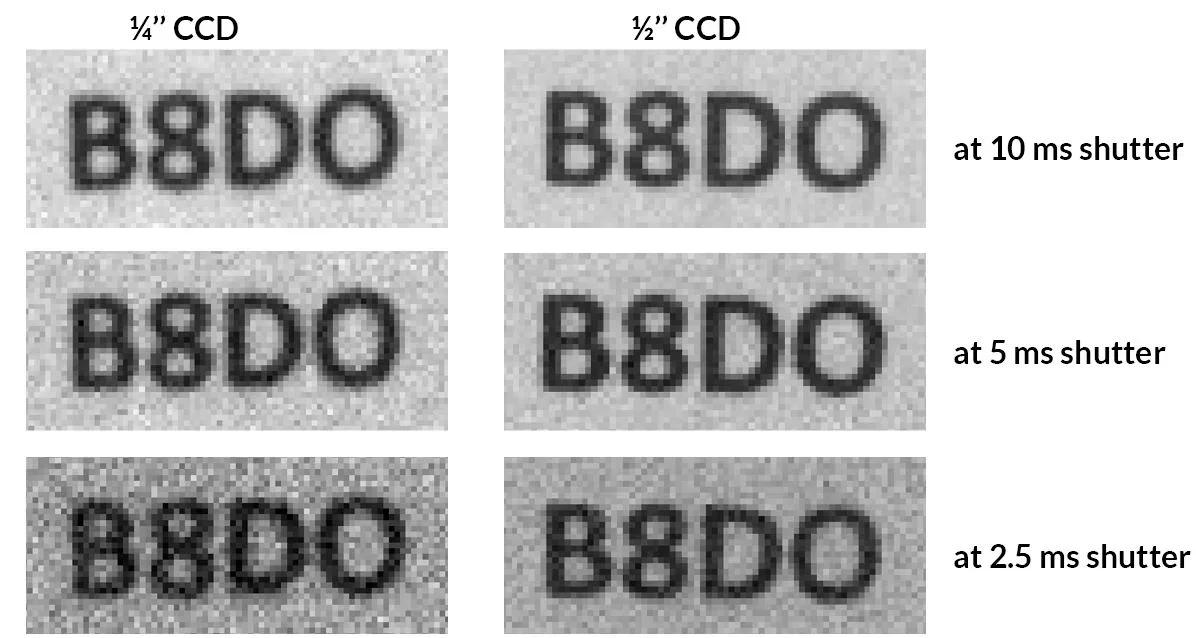
Figure 2. Results obtained from a 1/4'' and 1/2'' CCD cameras at different exposure times. Image Credit: FLIR Systems
Figure 2 displays a basic example showing the characters B,8, D and 0. These characters have the potential to be confused by a vision algorithm. The top left image was acquired using a ¼ ’’ CCD camera that produces images appropriate for image processing.
When the object begins to move, however, exposure times must be reduced and the camera is unable to provide useful information because it cannot distinguish the letters ‘B’ and ‘D’ from numbers ‘8’ and ‘0.’
Images in the middle and bottom left of Figure 2 show this deterioration in image quality, with images at ¼ ’’ CCD at 2.5 ms exposure time particularly unsuitable for image processing.
The assumption in this example is that a large depth of field is not necessary, so the minimum F-number of the lens is acceptable. This means that it is not possible to collect additional light by opening the shutter of the lens.
The designer in the example presented here will need to consider a different camera, but this will depend on whether a different camera offers the potential to improve system performance. The use of a larger sensor has typically been accepted as an appropriate means of addressing low light performance problems, so a ½ ’’ sensor may be a good option.
Table 2. Source: FLIR Systems
| Camera |
Sensor |
Pixel Size (μm) |
Quantum Efficiency
(%) |
Temporal Dark Noise
(e-) |
Saturation Capacity
(e-) |
1/4’’ Camera
(FL3-GE-03S1M-C) |
ICX618 |
5.6 |
70 |
11.73 |
14,508 |
1/2’’ Camera
(BFLY-PGE-03S3M-C) |
ICX414 |
9.9 |
39 |
19.43 |
25,949 |
Rather than continuing with trial and error, it may be prudent to consider the camera’s EMVA 1288 imaging performance. The EMVA 1288 data reveals that a ¼ ’’ sensor offers better quantum efficiency and lower noise, but a ½ ’’ CCD offers a larger pixel and improved saturation capacity.
This article will explore a way of determining whether or not the ½ ’’ camera in this example would perform better.
Figure 3 plots the signal value versus the light density (photons/µm2) of each camera in order to compare them. The signal as a function of light density is calculated using the following formula:
Signal = Light Density x (Pixel Size)2 x Quantum Efficiency
It should be noted that this article assumes the lenses have an identical field of view, F-number and camera settings.
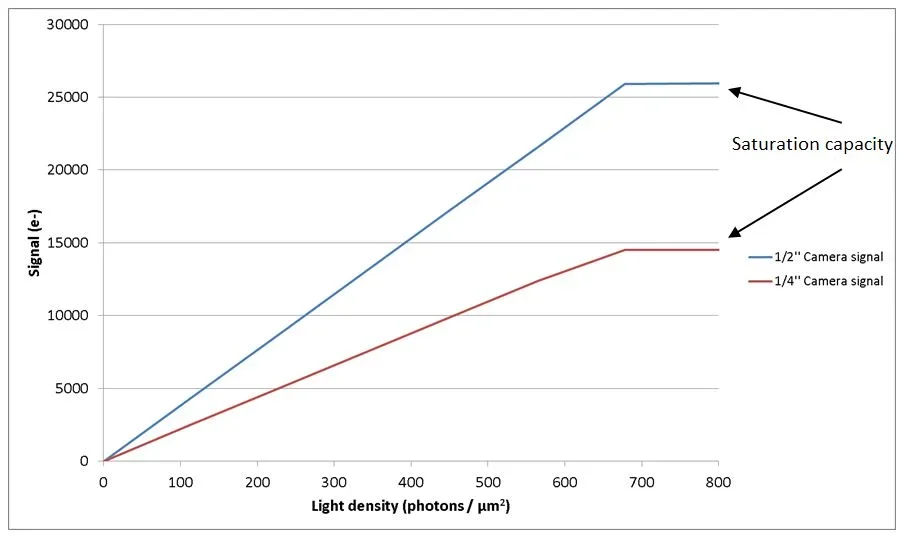
Figure 3. Signal produced by 1/4'' and 1/2'' CCD cameras as a function of the light level. Image Credit: FLIR Systems
The figure confirms that when working with the same light density, the ½ ’’ sensor is able to generate higher signal while saturation occurs at a similar light density level of 700 photons/µm2. The ½’’ sensor offers considerably higher saturation capacity, however.
The comparison of cameras should be undertaken at a low light level in this particular application, meaning that an understanding of noise levels becomes especially important.
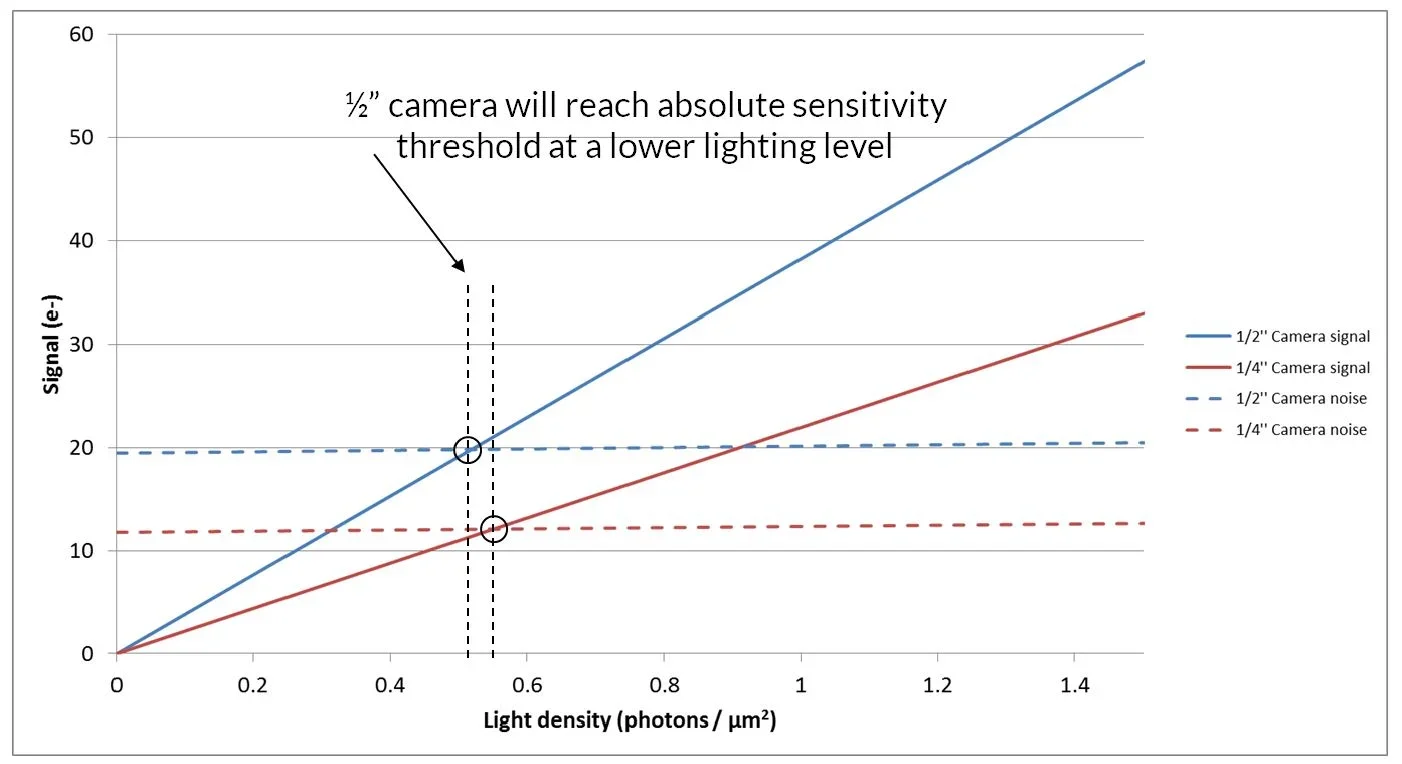
Figure 4. Signal and noise of the 1/4'' and 1/2'' CCD cameras at low light levels. Image Credit: FLIR Systems
Figure 4 displays the signal and noise at low lighting levels. The noise presented here is an RMS summation of Temporal Dark Noise and Shot Noise calculated via the formula below:

The graph shows that the absolute sensitivity threshold – that is, the light level at which signal and noise are equal - is reached by the ½ ’’ sensor at a marginally lower level than that of ¼ ’’ sensor.
The signal to noise ratio (SNR) is a more important measure of a cameras’ performance in low light applications. Theory suggests that based on the higher signal to noise ratio of the ½ ’’ sensor, the ½ ’’ camera is likely to perform better than the ¼ ’’ camera at low light levels.
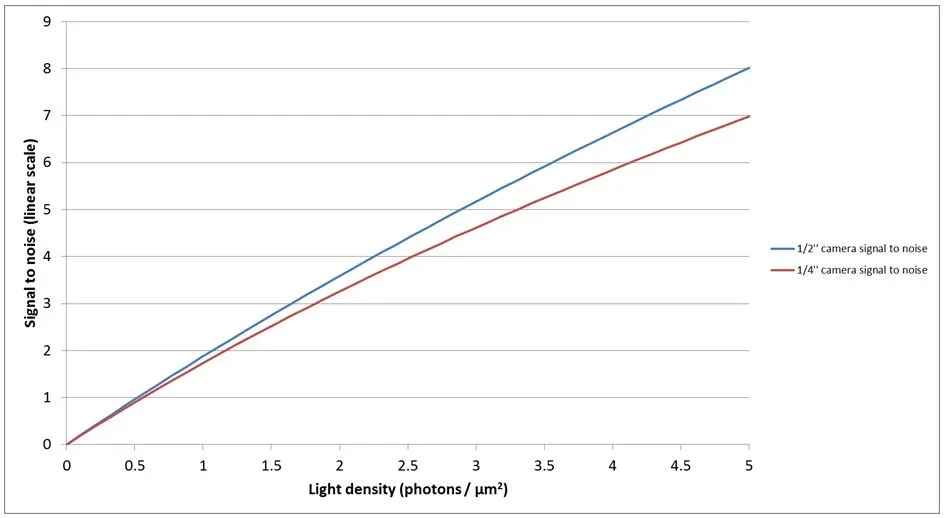
Figure 5. Signal to noise ration of the 1/4'' and 1/2'' CCD cameras at low light levels. Image Credit: FLIR Systems
Figure 2 shows that at 2.5 ms exposure time, the ½ ’’ sensor is able to preserve the characters’ shape at all exposure times, while the ¼ ’’ sensor makes it harder to distinguish between characters. The ½ ’’ sensor can be seen to perform better, therefore, with the test results corresponding with the theory.
FLIR has conducted a thorough study of cameras and has published the corresponding EMVA 1288 imaging performance results, allowing the performance of different camera models to be compared.
Camera implementation impacts imaging performance but consulting this study may be beneficial when comparing any two cameras with sensors covered in the document.
The method outlined here is useful when looking to obtain a general understanding of how well one camera will perform compared to another. This method can help to rule out cameras that are unlikely to improve the required performance. The ultimate test of a camera’s performance, however, remains in the camera’s actual application.
Comparing a Traditional CCD with a Modern CMOS Sensor
The performance of a traditional CCD sensor can be compared against a modern CMOS sensor in low light imaging conditions, as well as within a scene with a diverse array of lighting conditions.
The previous section utilized a camera with the Sony ICX414, a ½ ’’ VGA CCD, confirming that this performs better in low light conditions than a camera fitted with the Sony ICX618, a ¼ ’’ VGA CCD.
The next comparison is between the ½ ’’ VGA CCD and the new Sony Pregius IMX249, 1/1.2 ’’ 2.3 Mpix global shutter CMOS sensor.
This may initially seem like comparing ‘apples to oranges,’ but the cost implications of cameras with these two sensors are equivalent at around €400. A VGA region of interest in the CMOS camera is closer to the optical size of the ¼ ’’ camera, while the frame rates are comparable at the VGA resolution.
EMVA1288 data for both cameras reveal that the IMX249 CMOS sensor offers considerably better quantum efficiency along with higher saturation capacity and lower noise. Conversely, the ICX414 CCD sensor offers a larger pixel.
Table 3. Source: FLIR Systems
| Camera |
Sensor |
Pixel Size (μm) |
Quantum Efficiency
(%) |
Temporal Dark Noise
(e-) |
Saturation Capacity
(e-) |
1/2" CCD Camera
(BFLY-PGE-03S3M-C) |
ICX414 |
9.9 |
39 |
19.43 |
25,949 |
1/1.2" CMOS Camera
(BFLY-PGE-23S6M-C) |
IMX249 |
5.86 |
80 |
7.11 |
33,105 |
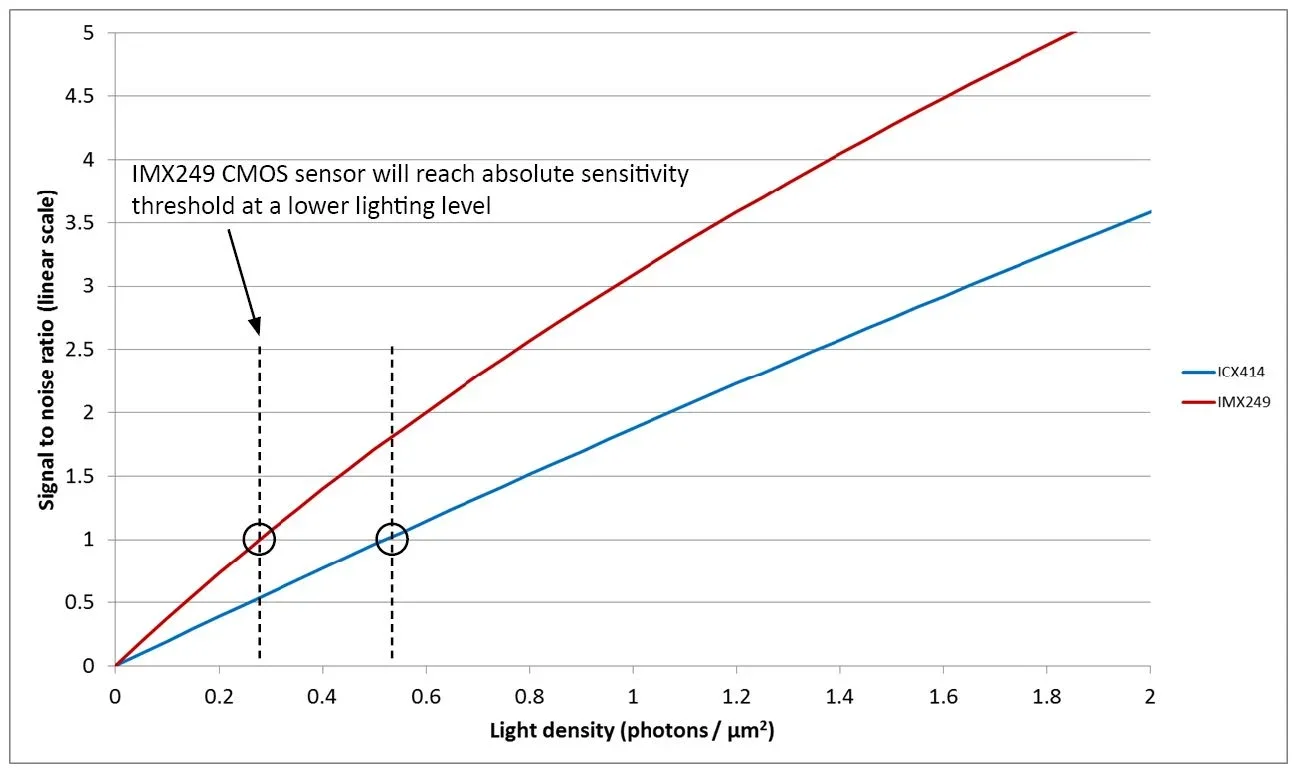
Figure 6. Signal to noise ratio of the ICX414 CCD and IMX249 CMOS sensors at low light levels. Image Credit: FLIR Systems
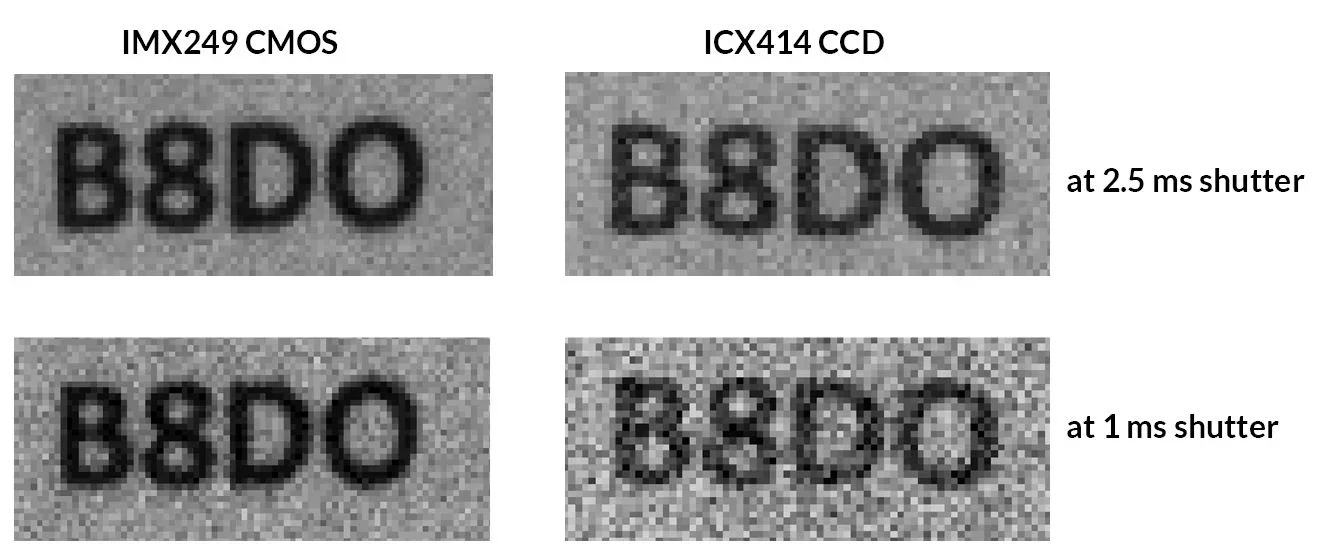
Figure 7. Results obtained from the ICX414 CCD and IMX249 CMOS sensors at different exposure times. Image Credit: FLIR Systems
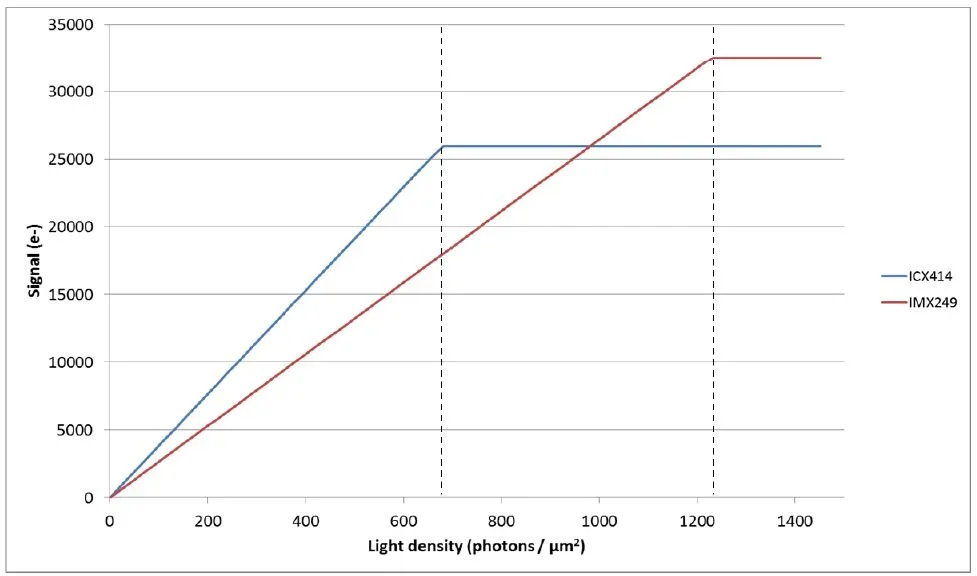
Figure 8. Signal produced by the ICX414 CCD and IMX249 CMOS sensor as a function of the light level. Image Credit: FLIR Systems
A more interesting comparison can be seen at higher light intensities as a result of the two sensors’ differences in saturation capacity. Figure 8 displays the signal as a function of light intensity across the complete range of light intensities.
The graph shows that the ICX414 CCD sensor reaches saturation capacity at around 700 photons/µm2, while the IMX249 CMOS sensor reaches saturation capacity at more than 1200 photons/µm2.
It can be concluded that the image produced by the ICX414 CCD sensor will be brighter than the image produced by the IMX249 CMOS sensor. To illustrate this, it is worth considering the image that would be produced at around 700 photons/µm2.
The image from the ICX414 CCD sensor should be at the highest grey scale levels, most likely saturated. The IMX249 CMOS sensor, however, will produce an image that is slightly more than 50% of the maximum brightness.
This observation is important because evaluating camera sensitivity based solely on the brightness of the image is considered naïve. It is often assumed that a camera with better performance will produce a brighter, but this is not true and in this example it is actually the opposite - the better performing camera produces darker images.
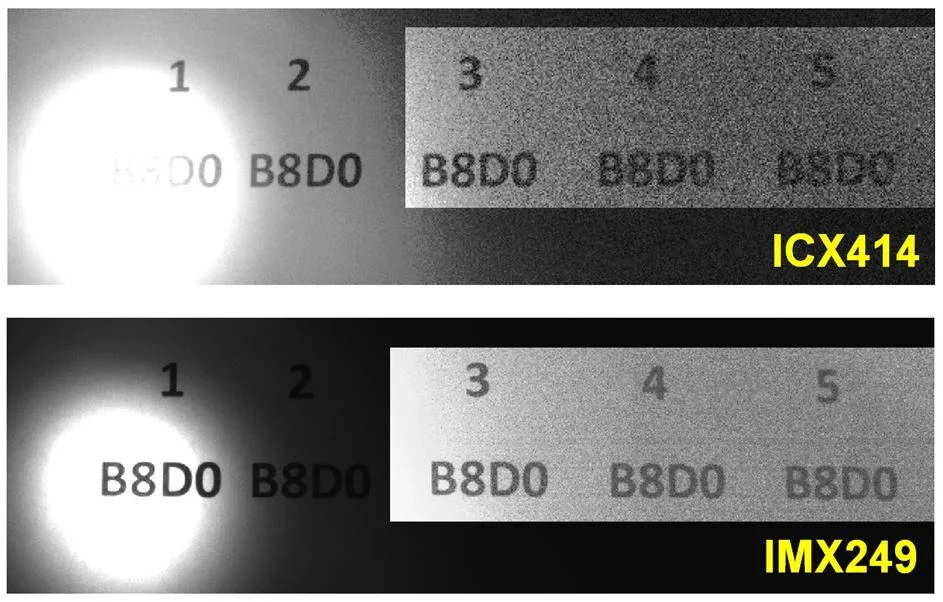
Figure 9. Results obtained with the ICX414 CCD and IMX249 CMOS sensors under difficult lighting conditions. Image Credit: FLIR Systems
Furthermore, the IMX249 CMOS sensor produces images useful for image processing in a wider range of lighting conditions. Figure 9 displays the same scene as imaged by both cameras. Here, the darker part of the images was enhanced for display purposes, but the underlying data has not been modified.
These images show that the ICX414 CCD is saturated in the bright areas of the scene while simultaneously containing too much noise in the dark areas for the characters to be fully legible. Conversely, the IMX249 CMOS sensor produces legible characters in both the bright and dark areas of the scene.
Finally, it can also be concluded that contemporary global shutter CMOS technology is increasingly offering a viable alternative to CCDs in machine vision applications. Sensors are less expensive while offering higher frame rates at equivalent resolutions.
They do not suffer from artifacts such as blooming and smear while also beginning to exceed the imaging performance of CCDs.
Conclusion
This article explored the key concepts utilized in evaluations of camera performance. The EMVA1288 standard was introduced, and results applied to compare camera performance under a range of lighting conditions.
A number of other aspects of camera performance may be considered when evaluating cameras.
For example, the quantum efficiency is altered significantly at different wavelengths, meaning that a camera performing well at 525 nm may not perform as well if the light source is at near infra-red (NIR) frequencies.
Long exposure times typical in fluorescence and astronomic imaging should also consider the effects of dark current, a form of noise that is prevalent at extremely low light levels.
Choosing the most appropriate camera based on imaging performance characteristics is not always straightforward, but it is hoped that this article has provided a robust introduction to this fascinating and complex topic.

This information has been sourced, reviewed and adapted from materials provided by FLIR Systems.
For more information on this source, please visit FLIR Systems.