Conventional mass spectrometers are utilized for the classification of analytes based on their mass-to-charge ratio, enabling the resolution of individual atoms.1,2 However, their effectiveness is limited when it comes to weighing heavier analytes, such as colloidal and aerosol particles that exceed just a few atoms in size.
To overcome this limitation, dissociation methods are commonly employed to fragment these particles, although this alters their inherent properties and presents challenges in reconstructing the mass spectrum.
In contrast, optomechanical sensing offers an alternative approach by measuring mass through the monitoring of optical modulation, which is transduced by the dynamics of a mechanical system, such as a micro-resonator.
These sensors introduce innovative mass sensing techniques that encompass a broader dynamic range and exhibit sensitivity at the pico- to attogram level.
Moreover, they enable in situ analysis without causing any destructive effects. The design of an optomechanical sensor can vary depending on the operational environment and the characteristics of the particles being probed. To illustrate potential applications, three scenarios are examined:
- Optical balance for isolated single aerosol particles under atmospheric circumstances.3
- Nanomechanical mass spectrometry (NMS) for nanoparticle deposition.4
- Colloidal transparent microcapillary resonators (TMRs).5,6
In each scenario, a Zurich Instruments lock-in amplifier is employed to supply the signal for driving the mechanical system and extract the resultant optical modulation while effectively isolating it from the background noise.
Optical Balance for Aerosols
By studying the behavior of individual aerosol particles under atmospheric conditions, valuable insights into cloud physics and chemistry can be gained through accurate particle characterization. Of particular significance are submicron-sized aerosol particles, as they contribute significantly to sunlight scattering and absorption.7
Within this size range, the optical balance allows for in-situ measurements of particle mass down to a few picograms, eliminating the need for preconditioning the particle through pre-charging or deposition on a substrate.3
This approach involves the use of a counter-propagating optical tweezer to isolate a single aerosol particle suspended in an environmental chamber. (Figure 1)
By adjusting the power balance between the two counter-propagating laser beams, the position of the particle along the beam axis z can be manipulated.
To achieve this, an optical modulator is employed to alter the power balance by rotating the polarization of the laser beam before it reaches a polarizing beam splitter. The periodic motion of the particle is monitored by a position-sensitive photodetector, facilitated by modulating the polarization at a frequency f.
The Zurich Instruments MFLI, a digital 5-MHz lock-in amplifier, plays a crucial role in this setup. It provides the periodic drive signal to the optical modulator and demodulates the photodetector signal to capture the phase delay φ in the particle's motion.
Under atmospheric pressure, a periodically moving particle in the environmental chamber experiences a drag force. For aqueous droplets, which have a spherical shape with a radius r, the drag force can be described by Stokes' law, which defines the damping rate Γ as
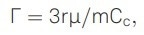 |
(1) |
where μ is the dynamic viscosity of the surrounding fluid, nitrogen in this case, and Cc is Cunningham’s correction factor.8
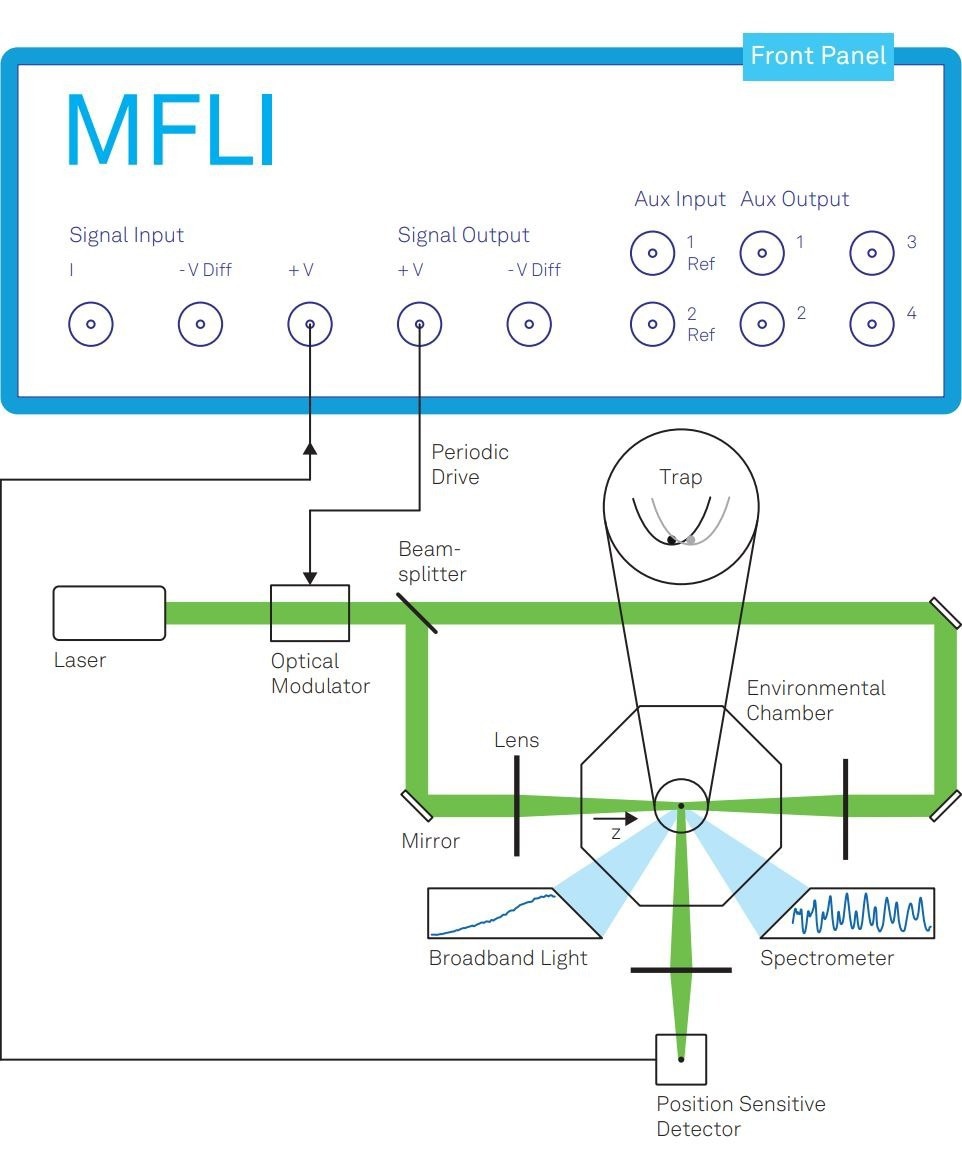
Figure 1. The optical balance scheme. A counter-propagating optical tweezer that traps a single particle and modulates its position along the z axis. The MFLI Lock-in Amplifier drives this modulation by controlling the optical modulator and detects the resulting phase delay in the particle’s motion by demodulating the signal from the position-sensitive detector. As the measurement results indicate, the trapping potential can be approximated as a harmonic potential that its center is modulated as depicted in the inset. The optical scheme in this figure is reproduced from3 under CC BY license. Image Credit: Zurich Instruments AG
Determining the particle's mass can be achieved by measuring the damping rate and the particle's size, as indicated by the equation above. The particle's size is measured using a broadband light scattering spectrometer.9
This instrument illuminates the particle with broadband light spanning a wavelength range of 300 nm to 500 nm.
The resulting intensity profile of the elastically scattered light is influenced by factors such as the particle's size, shape, and refractive index.10 Figure 1 illustrates the typical intensity profiles of the incident and scattered broadband light.
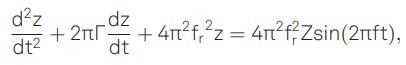
The phase delay in the particle's motion is measured to identify the damping rate. Assuming the particle's motion follows a purely harmonic pattern expressed as z(t) = sin (2πft - φ), it can be modeled as a driven damped harmonic oscillator:
 |
(2) |
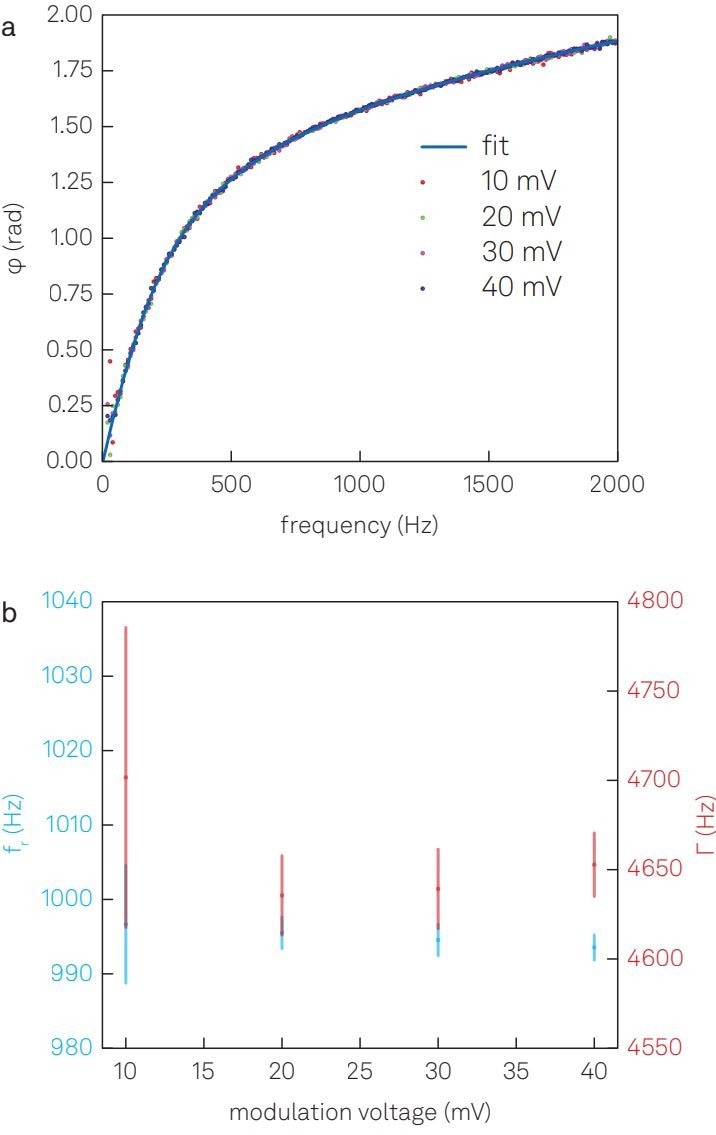
Figure 2. Characterization of the optical balance. (a) Frequency dependence of the phase delay at various modulation amplitudes. (b) The resonance frequency and damping rate determined by fitting the frequency-dependent phase delay with Equation 3. The plots in this figure are adapted from3 under CC BY license by changing the color scheme and fonts. Image Credit: Zurich Instruments AG
Here, fr is the natural frequency, and the modulation term with amplitude Z is on the right side of this equation. The frequency-dependent phase delay that results is a function of the damping rate given by
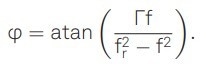 |
(3) |
By fitting this term to the measured phase delay, the damping rate can be determined.
Reich et al. demonstrate the effectiveness of this technique using aqueous-NaCl droplets, which rapidly reach equilibrium with the surrounding humidity.3 This allows for testing the optical balance with varying particle sizes and densities.
To determine the damping rate Γ and resonant frequency fr based on Equation 3, the researchers sweep the frequency of the excitation tone generated by one of the built-in oscillators of the MFLI Lock-in Amplifier using the parametric Sweeper tool provided by LabOne®, the instrument control software of Zurich Instruments.
During the frequency sweep, the Sweeper tool captures the corresponding phase delay and amplitude while automatically adjusting the demodulator settings of the lock-in amplifier to optimize the signal-to-noise ratio at each frequency step.
The results of repeated measurements (Figure 2 (a)) exhibit no discernible dependence on the modulation amplitude. Equation 3 consistently fits well in all cases, providing the values of Γ and fr. (Figure 2 (b))
The independence of the results from the modulation amplitude suggests that the particle undergoes harmonic motion and that higher-order terms can be considered negligible.
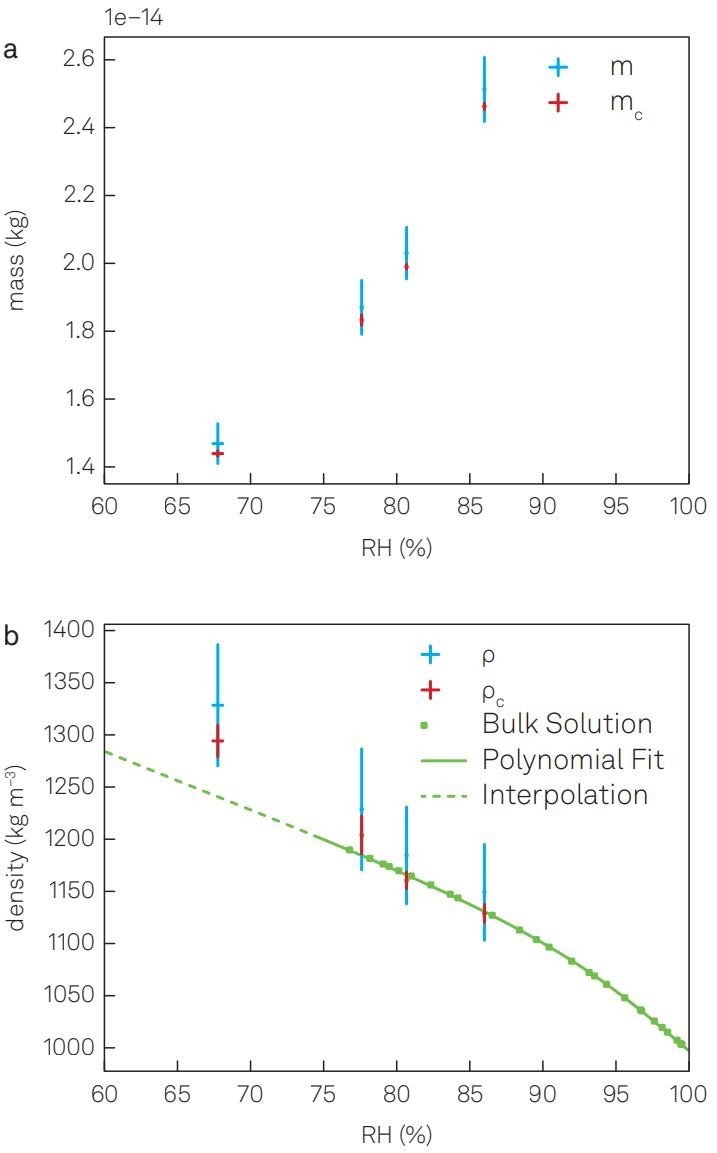
Figure 3. Measurement results with the optical balance. (a) The mass m of a single aqueous-NaCl droplet at varying relative humidities measured using an optical balance. (b) The particle density ρ is calculated from the mass and size r of the particle. The panel also includes the bulk solution density in the subsaturation regime11. The plots in this figure are adapted from3 under CC BY license by changing the color scheme and fonts. Image Credit: Zurich Instruments AG
Once the damping rate Γ and the particle's size r are determined, plugging them into Equation 1 allows for the calculation of the particle's mass. Figure 3 presents the results for a single particle at various relative humidities, with the aqueous-NaCl solution being undersaturated above 75.3 ± 0.3% relative humidity.11
In this regime, the particle density aligns well with bulk solution measurements reported in the literature. However, it should be noted that aerosol particles can experience supersaturation while remaining in the liquid phase.
This measurement demonstrates that extrapolating bulk solution measurements to the saturated regime does not yield accurate results.
The accuracy of the optical balance falls within a range of 6%. This value is influenced by both systematic measurement errors and the statistical spread of the measurements.
Systematic measurement errors can be corrected using the densities of undersaturated bulk solutions, which enhances accuracy. This improvement leads to an enhanced accuracy of 2.5%, which corresponds to approximately 100 fg, as depicted by mc (a) and ρc (b) of Figure 3.3
Nanomechanical Mass Spectrometry
Nanomechanical mass spectrometry (NMS) determines the mass of particles deposited on a nanoelectromechanical resonator. The natural frequency of the resonator is closely related to its effective mass.
As a result, when a particle lands on the surface of the resonator, a frequency shift occurs. By monitoring these frequency shifts after initially characterizing the resonator's natural frequency, the added mass of the particle can be determined.
NMS offers high sensitivity down to 10-21 g and a broad dynamic range, making it well-suited for measuring the masses of nanoparticles.12,13,14 Additionally, it enables the sequential adhesion of multiple particles on the resonator to be monitored, allowing for ensemble measurements.
The experimental setup developed by Malvar et al.4 (Figure 4) utilizes a single-clamped beam as a cantilever. This beam is connected to an actuator and housed within a vacuum chamber.
The Zurich Instruments HF2LI Lock-in Amplifier is employed to provide the drive signal for the actuator, exciting the cantilever at its natural frequency. The cantilever is built of silicon nitride and measures 70 μm in length, 10 μm in width, and 100 nm in thickness.
Alternatives include double-clamped cantilevers or more complex geometries such as membrane.15, 16, 17 The shift in the cantilever's natural frequency also depends on the position where the particle lands.
To understand this phenomenon, it is necessary to examine the displacement profile of the cantilever, or the mode shape of the nth eigenmode ψn (x), which can be determined by solving the Euler-Bernoulli equation, resulting in
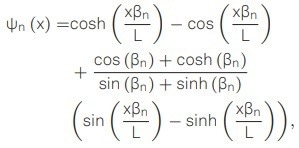 |
(4) |
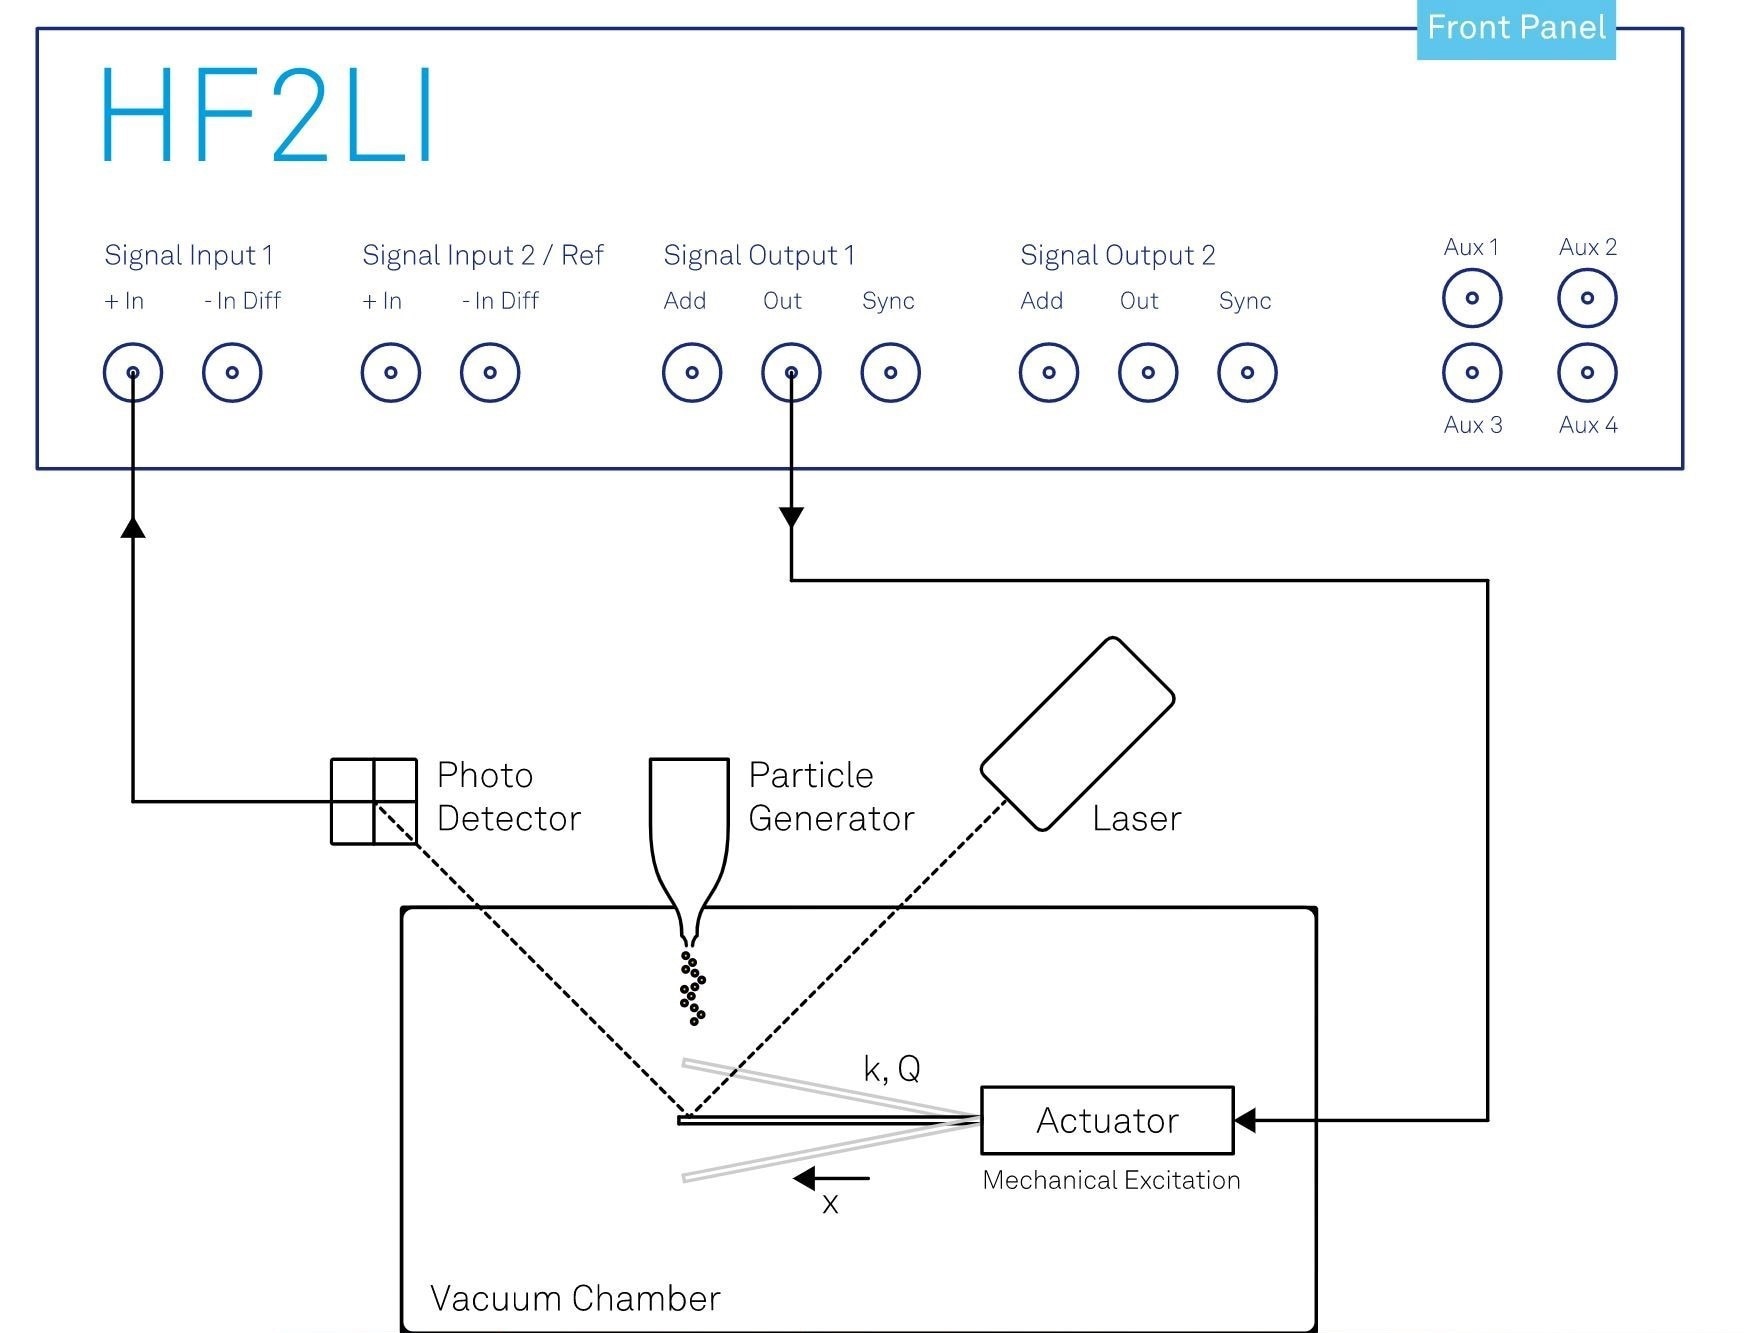
Figure 4. Nanomechanical mass spectrometer that uses an actuated cantilever. The HF2LI Lock-in Amplifier controls this actuation and tracks the cantilever’s resonance frequency with its phase-locked loop. Image Credit: Zurich Instruments AG
where βn stands for the nth eigenvalue and L is the cantilever’s length. The boundary condition for a single-clamped beam is
 |
(5) |
which yields βn=1,2,3,4 = 1.8751, 4.6941, 7.8547,10.9955 for the first four eigenmodes. The frequency shift of the nth eigenmode induced by the added mass is then given by
 |
(6) |
where Δm is the deposited mass, mr is the resonator mass, and x0 is the particle’s landing position.18,19.
Various detection schemes are available to monitor the motion of the resonator, including electrical transduction methods such as resistive coupling 14 and capacitive coupling 20, commonly employed in inertial sensors like MEMS gyroscopes.
However, optical transduction methods have demonstrated superior sensitivity and larger measurement bandwidths due to the absence of constraints imposed by slow readout circuits.21
One commonly used optical detection scheme involves monitoring the deflection of a laser beam near the point of maximum slope on a vibrating structure.22 (Figure 4)
The movement of the cantilever alters the position of the deflected light that impinges upon a quadrant photodetector.
In this detection scheme, the mechanical modulation of the cantilever is transduced into a modulated electrical signal. Figure 5 presents the mechanical spectra of the first four eigenmodes of the cantilever, measured using the LabOne parametric Sweeper.
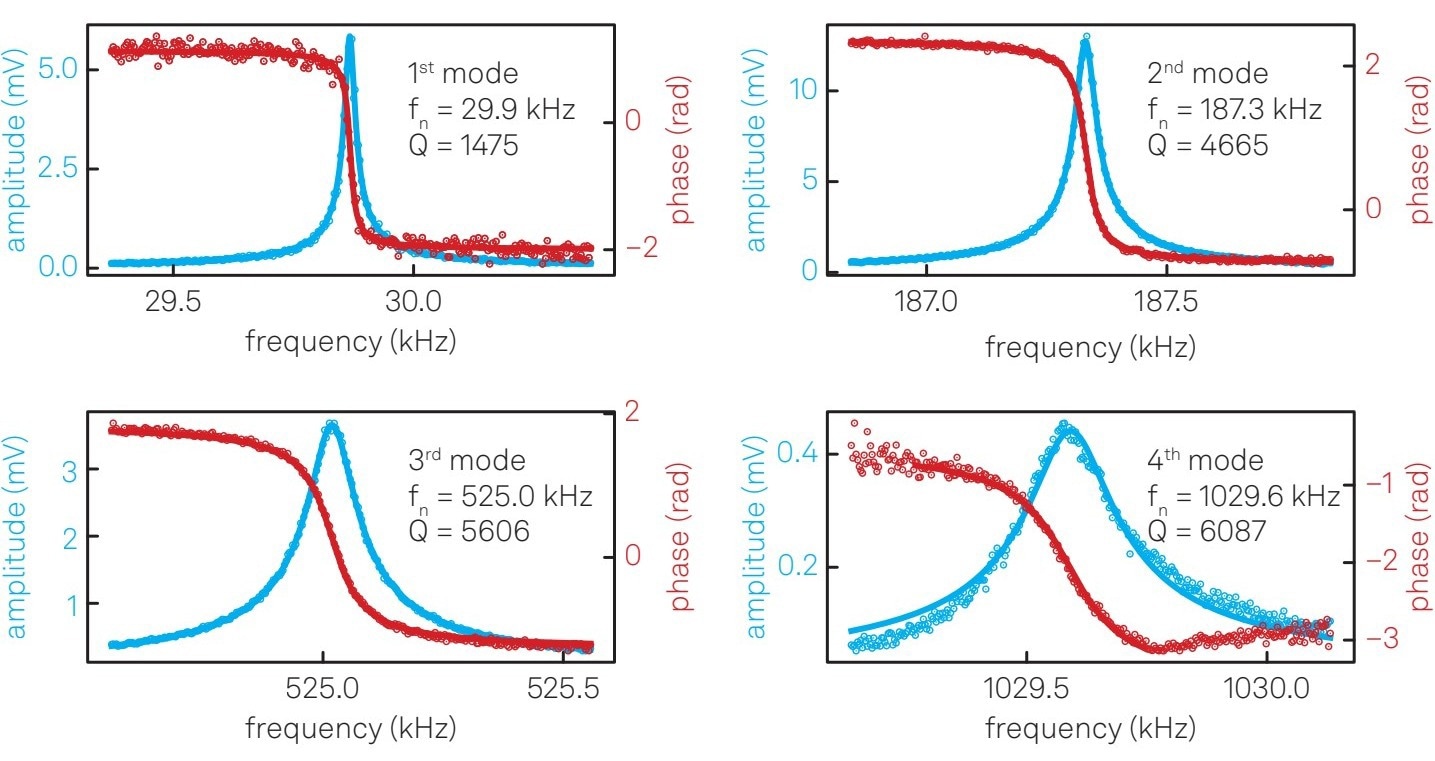
Figure 5. Characterization of the NMS. Resonance peaks and phase delays of the first four flexural vibration modes of the cantilever beam. Image Credit: Zurich Instruments AG
To test NMS, gold nanoparticles 100 nm in size are deposited onto the resonator using an electrospray ionization technique within a vacuum stage.
This technique involves transferring the particles through a heated capillary at 180 °C to ensure complete solvent evaporation. Subsequently, an aerodynamic lens guides the particles onto the surface of the cantilever.
During the deposition process, as particles land on the resonator, the HF2LI Lock-in Amplifier's phase-locked loop (PLL) tracks the resulting frequency shift, capturing individual landing events. The closed-loop bandwidth of the PLL is a crucial parameter that determines its ability to track these events promptly.
For demanding applications, the Zurich Instruments UHFLI Lock-in Amplifier offers a closed-loop bandwidth of up to 300 kHz.23
The LabOne software includes the PID Advisor, which utilizes the resonance frequency and quality factor obtained from the initial frequency sweep to configure the PLL at the desired bandwidth. By simulating the transfer function at each eigenmode, the PID Advisor aids in optimizing the PLL configuration.
Tracking the frequency shift of two eigenmodes simultaneously is sufficient to extract Δm and x0 as described in Equation 6. However, the nodes of a tracked eigenmode do not provide information about the landing particles.
Therefore, tracking additional eigenmodes eliminates blind spots and reduces errors.24 With the HF2LI equipped with upgrade options HF2LI-MF, HF2LI-PID, and HF2LIPLL, it is possible to track up to six eigenmodes simultaneously.
NMS can track numerous eigenmodes with 1 part per million (ppm) accuracy, allowing it to measure the mass of gold nanoparticles as small as 100 nm.
Figure 6 (a) displays the relative frequency shifts of the first four eigenmodes induced by individual particle deposition. Applying a mathematical algorithm allows for the calculation of a mass histogram based on the relative frequency shifts.25
The results reveal a mean particle mass of 10 fg (Figure 6 (b)), aligning with the expected outcomes.4
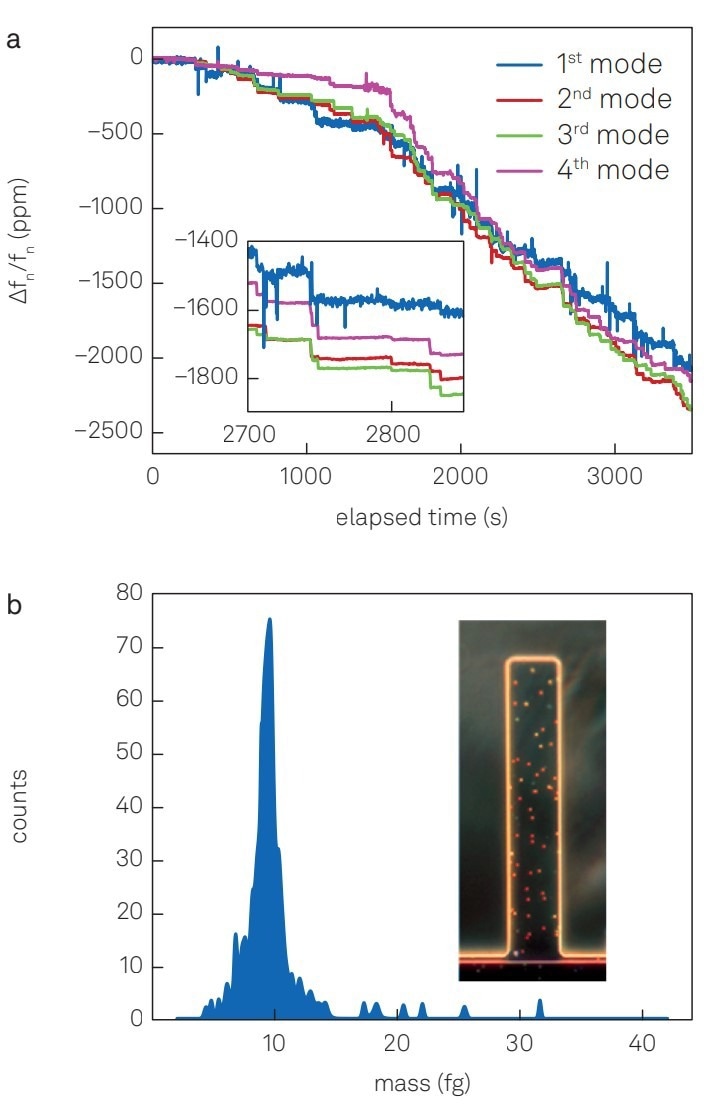
Figure 6. Measurement results with the NMS. (a) Relative frequency shifts of the first four eigenmodes upon 100-nm-sized gold nanoparticle landing events. (inset) Close-up view of the elapsed time between 2700 to 2850 s. (b) Mass distribution of 100-nm-sized gold nanoparticles calculated from the relative frequency shifts measured. (inset) Dark-field optical microscope image of the beam with deposited gold particles visible as orange and red dots. Image Credit: Zurich Instruments AG
References and Further Reading
- Thomas E Angel, Uma K Aryal, Shawna M Hengel, Erin S Baker, Ryan T Kelly, Errol W Robinson, and Richard D Smith. Mass spectrometrybased proteomics: existing capabilities and future directions. Chem. Soc. Rev., 41(10):3912– 3928, May 2012.
- Ruedi Aebersold and Matthias Mann. Mass spectrometry-based proteomics. Nature, 422(6928):198–207, March 2003.
- Oliver Reich, Grégory David, Kıvanç Esat, and Ruth Signorell. Weighing picogram aerosol droplets with an optical balance. Communications Physics, 3(1):1–8, December 2020.
- O Malvar, J J Ruz, P M Kosaka, C M Domínguez, E Gil-Santos, M Calleja, and J Tamayo. Mass and stiffness spectrometry of nanoparticles and whole intact bacteria by multimode nanomechanical resonators. Nat. Commun., 7:13452, November 2016.
- Alberto Martín-Pérez, Daniel Ramos, Javier Tamayo, and Montserrat Calleja. Coherent Optical Transduction of Suspended Microcapillary Resonators for Multi-Parameter Sensing Applications. Sensors, 19(23), November 2019.
- Alberto Martín-Pérez, Daniel Ramos, Marina L Yubero, Sergio García-López, Priscila M Kosaka, Javier Tamayo, and Montserrat Calleja. Hydrodynamic assisted multiparametric particle spectrometry. Sci. Rep., 11(1):3535, February 2021.
- Daniel M. Murphy. Atmospheric science. Something in the air. Science, 307(5717):1888–1890, March 2005.
- William C Hinds. Aerosol technology: properties, behavior, and measurement of airborne particles. Wiley, New York, second ed. edition, 1999.
- Grégory David, Kıvanç Esat, Irina Ritsch, and Ruth Signorell. Ultraviolet broadband light scattering for optically-trapped submicron-sized aerosol particles. Phys. Chem. Chem. Phys., 18(7):5477–5485, February 2016.
- Kıvanç Esat. Characterization of Optically Trapped Aerosol Particles: From Phase Transitions to Photochemical Reactions. PhD thesis, ETH Zurich, 2019.
- Lewis Greenspan. Humidity fixed points of binary saturated aqueous solutions. J. Res. Natl. Bur. Stand. A Phys. Chem., 81A(1):89, January 1977.
- J L Arlett, E B Myers, and M L Roukes. Comparative advantages of mechanical biosensors. Nat. Nanotechnol., 6(4):203–215, April 2011.
- H W Ch Postma, H W Ch. Postma, I Kozinsky, A Husain, and M L Roukes. Dynamic range of nanotube- and nanowire-based electromechanical systems. Appl. Phys. Lett., 86(22):223105, 2005.
- Y T Yang, C Callegari, X L Feng, K L Ekinci, and M L Roukes. Zeptogram-scale nanomechanical mass sensing. Nano Lett., 6(4):583–586, April 2006.
- Daniel Ramos, Ian W Frank, Parag B Deotare, Irfan Bulu, and Marko Lončar. Non-linear mixing in coupled photonic crystal nanobeam cavities due to cross-coupling opto-mechanical mechanisms. Appl. Phys. Lett., 105(18):181121, November 2014.
- Daniel Ramos, Oscar Malvar, Zachary J Davis, Javier Tamayo, and Montserrat Calleja. Nanomechanical Plasmon Spectroscopy of Single Gold Nanoparticles. Nano Lett., 18(11):7165–7170, November 2018.
- Mert Yuksel, Ezgi Orhan, Cenk Yanik, Atakan B Ari, Alper Demir, and M Selim Hanay. Nonlinear Nanomechanical Mass Spectrometry at the Single-Nanoparticle Level. Nano Lett., 19(6):3583–3589, June 2019.
- D Ramos, J Tamayo, J Mertens, M Calleja, and A Zaballos. Origin of the response of nanomechanical resonators to bacteria adsorption. J. Appl. Phys., 100(10):106105, November 2006.
- Javier Tamayo, Daniel Ramos, Johan Mertens, and Montserrat Calleja. Effect of the adsorbate stiffness on the resonance response of microcantilever sensors. Appl. Phys. Lett., 89(22):224104, November 2006.
- Marc Sansa, Marta Fernández-Regúlez, Álvaro San Paulo, and Francesc Pérez-Murano. Electrical transduction in nanomechanical resonators based on doubly clamped bottom-up silicon nanowires. Appl. Phys. Lett., 101(24):243115, December 2012.
- Daniel Ramos, Eduardo Gil-Santos, Oscar Malvar, Jose M Llorens, Valerio Pini, Alvaro San Paulo, Montserrat Calleja, and Javier Tamayo. Silicon nanowires: where mechanics and optics meet at the nanoscale. Sci. Rep., 3(1):1–7, December 2013.
- D Ramos, J Tamayo, J Mertens, and M Calleja. Photothermal excitation of microcantilevers in liquids. J. Appl. Phys., 99(12):124904, 2006.
- Tomás Manzaneque, Peter G Steeneken, Farbod Alijani, and Murali K Ghatkesar. Method to Determine the Closed-Loop Precision of Resonant Sensors From Open-Loop Measurements. IEEE Sens. J., 20(23):14262–14272, December 2020.
- S Dohn, W Svendsen, A Boisen, and O Hansen. Mass and position determination of attached particles on cantilever based mass sensors. Rev. Sci. Instrum., 78(10):103303, October 2007.
- Jose Jaime Ruz, Oscar Malvar, Eduardo GilSantos, Daniel Ramos, Montserrat Calleja, and Javier Tamayo. A Review on Theory and Modelling of Nanomechanical Sensors for Biological Applications. Processes, 9(1):164, January 2021.
- Alberto Martín-Pérez, Daniel Ramos, Eduardo Gil-Santos, Sergio García-López, Marina L Yubero, Priscila M Kosaka, Álvaro San Paulo, Javier Tamayo, and Montserrat Calleja. Mechano-Optical Analysis of Single Cells with Transparent Microcapillary Resonators. ACS Sens, 4(12):3325–3332, December 2019.
- Jungchul Lee, Wenjiang Shen, Kris Payer, Thomas P Burg, and Scott R Manalis. Toward attogram mass measurements in solution with suspended nanochannel resonators. Nano Lett., 10(7):2537–2542, July 2010.
- Max A Stockslager, Selim Olcum, Scott M Knudsen, Robert J Kimmerling, Nathan Cermak, Kristofor R Payer, Vincent Agache, and Scott R Manalis. Rapid and high-precision sizing of single particles using parallel suspended microchannel resonator arrays and deconvolution. Rev. Sci. Instrum., 90(8):085004, August 2019.
- Oscar Malvar, Daniel Ramos, Carmen Martínez, Priscila Kosaka, Javier Tamayo, and Montserrat Calleja. Highly sensitive measurement of liquid density in air using suspended microcapillary resonators. Sensors, 15(4):7650–7657, March 2015.
- Donghyuk Lee, Joonhui Kim, Nam-Joon Cho, Taewook Kang, Sangken Kauh, and Jungchul Lee. Pulled microcapillary tube resonators with electrical readout for mass sensing applications. Sci. Rep., 6:33799, October 2016.
- Alberto Martín-Pérez, Daniel Ramos, Javier Tamayo, and Montserrat Calleja. Nanomechanical Molecular Mass Sensing Using Suspended Microchannel Resonators. Sensors, 21(10), May 2021.

This information has been sourced, reviewed and adapted from materials provided by Zurich Instruments AG.
For more information on this source, please visit Zurich Instruments AG.