This article compares MTI’s Accumeasure HD amplifier and a laser interferometer’s ability to carry out very small displacement measurements with resolution and accuracy in particular focus. This comparison specifically focuses on the minimum expected resolution and how the accuracy of the instruments is affected by noise.
Typically, high-resolution interferometers are the instrument of choice for the type of measurements discussed in this article. However, MTI’s technology offers users outstanding accuracy and stability. Additionally, the Accumeasure is simpler to set up and is much more affordable than the widely used high-resolution interferometers. Applications in the micro-positioning field include the measurement of the mask height of semiconductor wafers during lithography.
Comparison and Configuration
MTI’s Accumeasure HD amplifier converts a capacitive electric field measurement, known as displacement, into a 24-bit digital reading to generate measurements on position, thickness, motion, and vibration. This removes any errors that may have occurred due to analog filtering, linearization, range extension, and the summing of channels to carry out measurements on thickness or step.
For the purposes of the experiment detailed in this article, a new D200 model amplifier was used in conjunction with a preamplifier and a high definition capacitive probe (ASP-50M-CTA), which had a measurement range of 50 microns (µm). The Accumeasure HD is capable of 1 picometer (pm) resolution and can provide picometer accuracy with select probes.
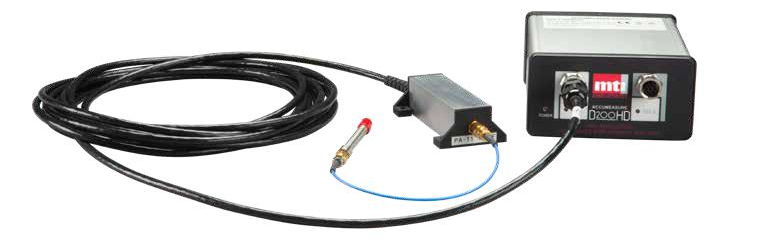
Figure 1. MTI Accumeasure HD amplifier, preamplifier, and 50 µm range probe.
The PicoScale interferometer that has been used is representative of a category of devices1, specifically Michelson interferometers, that split the beam from a light source into distinct arms, for these arms to then be reflected back to the beam splitter. After combining the amplitudes, the resulting interference pattern, which is not directed back toward the light source, then gets directed towards a photoelectric detector.
In this experiment, the interferometer comprised of the SH-CO2 laser interferometer sensor and the PS-CTRL-V1.4-TAB 3 controller. The interferometer had a resolution of 70 pm RMS. With peak-to-peak (pk-pk) conversion, this would be 350 pm (using 6X to convert RMS to pk-pk).
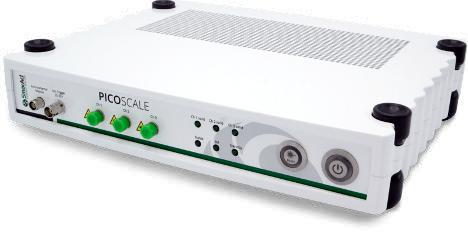
Figure 2. Picoscale controller. The controller contains the laser source and fringe interpolater for making interferometer measurements.
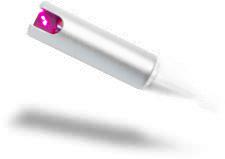
Figure 3. The CO2 interferometer sensor (a Michelson type device) is connected to the controller by a single-mode fiberoptic cable.
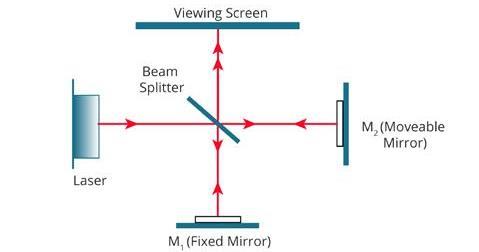
Figure 4. Basic Michelson interferometer diagram.
The Experiment
The CO2 interferometer sensor and MTI ASP-50M-CTA probe were mounted to a small piezoelectric flexure stage. Although the two sensors did not observe exactly the same target surface, they were closed coupled both mechanically and physically. The capacitance probe was embedded in the stage to allow it to directly observe the piezo flexure motion. The interferometer was mounted on an optical post close to the stage. It was pointed at a retroreflector mounted on top of the stage. The retro-reflector moved in tandem with the motion of the stage.
To define the minimum resolution, measurements were taken when the stage was not moving. Measurements were also taken when the stage was moving back and forth by 12 nm. This facilitated the observation of the mechanical motion, and allowed for the comparison of the dynamic results. The Piezo flexure stage and interferometer were both mounted on an isolated air stage so as to minimize seismic events that could interfere with the measurements.
As Figure 5 shows, the experiment made use of an Agilent signal generator to generate a 10 Hz square wave signal, which was sent to a high voltage amplifier. This drove the Piezo System Jena motion stage, with a range of 100 µm, back and forth by 12 nm. The system was open loop.
Below is the equipment setup, which compared the Michaelson interferometer to an MTI Accumeasure HD capacitance displacement sensor. The Accumeasure HD can operate to a 1 picometer resolution.
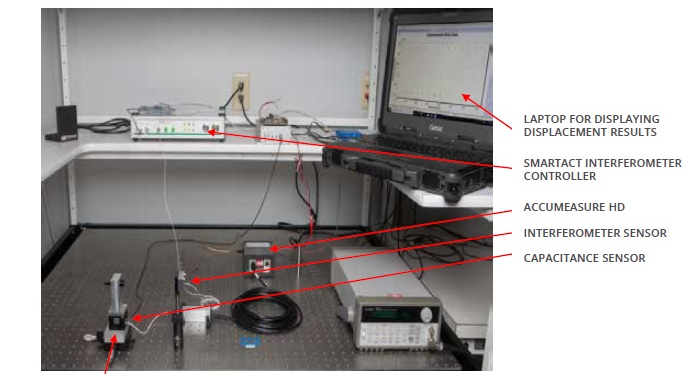
Figure 5. The setup comprised a Piezoelectric motion stage with 12 nm step movement, and also housed the capacitance probe and a retroflector target for the interferometer.
Figure 6 illustrates the interferometer’s output when the Piezo stage was stationary. The interferometer’s baseband noise was found to be 350 Hz, and thermal drift was also seen. The time of observation was limited to less than 2 seconds in order to minimize the effects imposed by a thermal drift, which is a difficult element to eradicate from the setup completely. The pk-pk was approximately 1.4 nm. This was smaller than the peak-to-peak figure that MTI had seen in other comparison experiments.
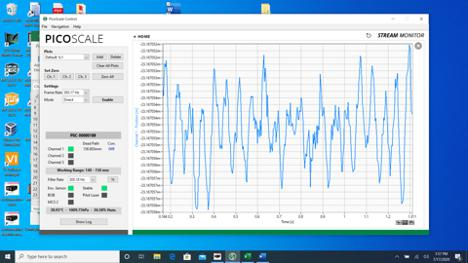
Figure 6. Interferometer base level noise with the target stationary.
It is important to note that there was some target mechanical drift observed caused by air currents, as well as differential thermal stress on the optical supports. When discounting the motion caused by drift, the pk-pk noise observed is approximately 1.4 nm. The specifications for the PicoScale interferometer are 70 pm RMS, which is around 420 pm in optimal conditions. Figure 7 details the noise output for the Accumeasure HD, where the target was stationary at 500 Hz bandwidth.
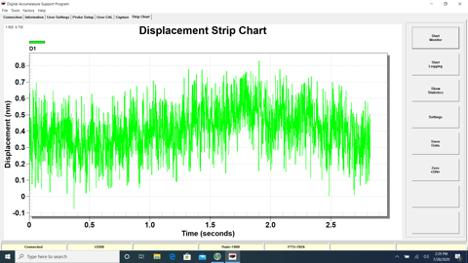
Figure 7. Digital Accumeasure noise at 500 Hz bandwidth. The target is stationary and pk-pk noise is approximately 600 pm.
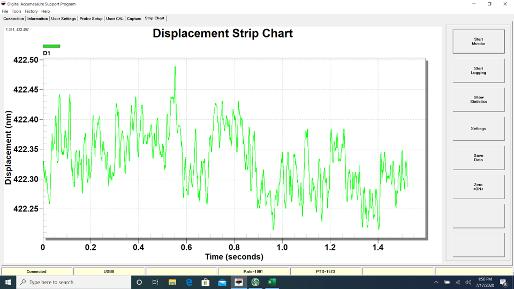
Figure 8. A pk-pk noise at a 50 Hz bandwidth. The sampling rate was 1 kHz.
At 50 Hz bandwidth, Accumeasure HD noise was around 200 pm pk-pk. The target was stationary, and larger excursions of the signal from mechanical vibrations were caused by micromechanical motion coupled to the isolation table. The signal general was then turned on to observe the pk-pk motion. Figure 9 illustrates the 12 nm open loop dynamic signal at 50 Hz bandwidth. A small degree of overshoot was seen in the stage.
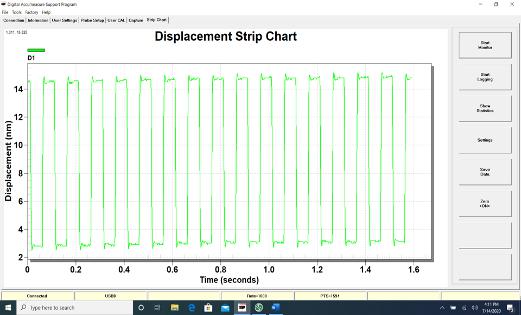
Figure 9. The HD digital Accumeasure measures the stage as it moves back and forth by 12 nm pk-pk.
As can be seen in Figure 10, the same motion is present when using the PicoScale interferometer. The average pk-pk motion is 12 nm, although the noise level on the signal rendered it harder to observe the square wave motion that was seen by MTI’s HD Digital Accumeasure. An average pk-pk motion of 12 nm was equal to the capacitance sensor. It may also have been possible that there was a degree of backlash occurring as a result of the retroreflector being mounted atop the stage.
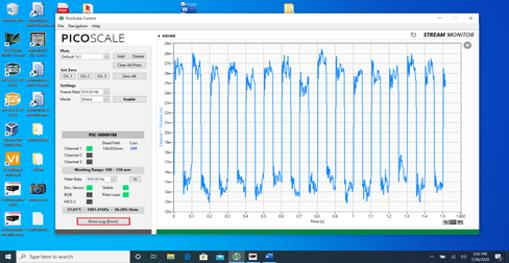
Figure 10. The interferometer signal as seen from the PicoScale user screen.
The PicoScale interferometer measured the Piezoelectric stage during its 12 nm pk-pk back and forth motion. This was the same movement and measurement acquired with the MTI technology. It should be noted that the peak signals were not level, and there was a degree of noise caused by fringe signal interpolation (noise) and a potential degree of stage backlash.
The data shown below was exported from the MTI Digital Accumeasure and the PicoScale Interferometer and plotted side-by-side. Each set of data was offset mathematically to enable visualization of the data. No additional gain or smoothing was applied. The interferometer data was bandwidth-limited to 350 Hz.
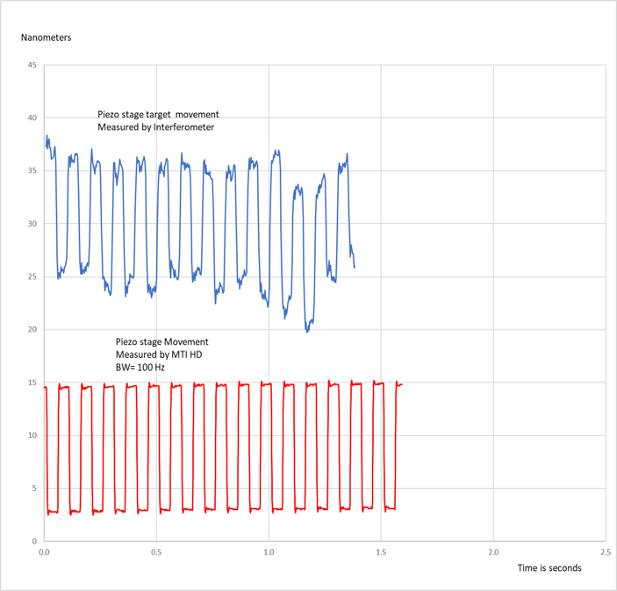
Figure 11. Side-by-side comparison of the PicoScale laser interferometer and MTI’s digital Accumeasure HD. The horizontal scale denotes seconds and the vertical scale denotes nanometers.
Summary
The MTI Digital Accumeasure showed superior resolution and possessed much better stability in this Piezo flexure stage application. It was simple to mount the probe against the embedded Piezo flexure, which eliminated undesirable action from the lever arm. The 200 pm resolution seems to lie at the threshold of detectivity, with the experiment showing that seismic motion and thermal drift begin to become the prevailing factors in resolution. The HD amplifier was simpler to set up than the interferometer, and no retroreflector was necessary. When set to 100 Hz, the dynamic range of MTI’s Accumeasure HD Amplifier was approximately 107 dB.
Reference
1 The product used is the SmarAct Interferometer

This information has been sourced, reviewed and adapted from materials provided by MTI Instruments Inc.
For more information on this source, please visit MTI Instruments Inc.