Gaseous pollutants can be easily diffused, are hard to treat, and can be difficult to detect.
The continuous release of pollutant gases from vehicle and aircraft exhaust emissions, the chemical industry, and the electric power industry has led to the gradual increase of gas concentration in the atmosphere. This has resulted in severe air pollution problems, including acid rain and an increased risk for lung disease.
There are several gas detection techniques for the qualitative and quantitative analysis of trace gases: semiconductor sensors, analytical sensors, laser-based absorption sensors, and electrochemical sensors.
Laser absorption spectroscopy (LAS) can deliver a quicker response time of <1 second, a low detection limit of ppb level and even down to ppt level, as well as real-time in-situ measurements than other techniques.
Photoacoustic spectroscopy (PAS) is based on an optical absorption process and is a well-known technology for trace gas detection in several applications like non-invasive medical diagnosis, pollution gas monitoring, and industrial process control.
The PAS technology offers two unique benefits. First, the PAS-based gas sensors offer a detection limit proportional to the excitation power before a power saturation effect is noted, implying that the sensors’ performance can benefit from the constantly refreshed power records of different excitation sources.
Second, the excitation wavelength is independent of the PAS gas sensors, enabling its use to detect different gas species at the same time with different absorption wavelengths.
New research published in the journal Optics Express has developed a gas sensor that can simultaneously detect harmful gases like CO and H2S.
A two-stage commercial optical fiber amplifier featuring a full output power of 10 W was used to develop a ppb-level CO and H2S photoacoustic spectroscopy (PAS) gas sensor.
Two near-infrared diode lasers featuring the central wavenumbers of 6377.4 cm−1 and 6320.6 cm−1 were used as the excitation laser source.
A time-division multiplexing technique helped detect CO and H2S simultaneously using an optical switch. A theoretically simulated dual-resonator structural photoacoustic cell (PAC) was designed using a finite element analysis. The multi-component sensor’s performance was assessed after optimizing for pressure, frequency, and modulation depth.
Methodology
The signal-to-noise ratio (SNR) governs the detection limit of PAS-based gas sensors.
A higher SNR can be achieved in two ways: (1) by increasing the photoacoustic signal, which can be achieved by selecting a high-power excitation laser source or a strong absorption line; (2) by decreasing the background noise, specifically for a poor-quality laser beam.
As illustrated in Figure 1, a stainless-steel PAC including dual Helmholtz resonators was simulated and designed to decrease the background noise for the high-power laser radiation.
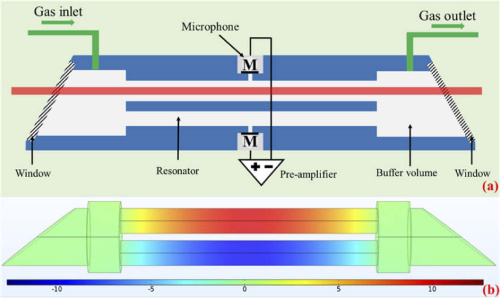
Figure 1. Structural diagram (a) and finite element simulation (b) of the dual-resonator photoacoustic cell. The relative PAS signal intensity values are shown in the color bar. Image Credit: Yin, et al., 2021
An Erbium-doped fiber amplifier (EDFA) allowed compensation for the loss in sensitivity caused by the selected weak absorption line strength in the near-IR region. Figure 2 shows that the EDFA included Erbium ions, optical isolators, pump laser supply, wavelength division multiplex (WDM) couplers, and optical filter.
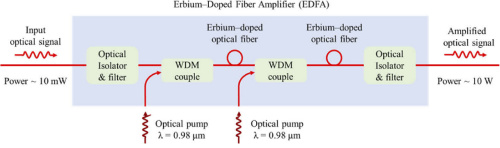
Figure 2. Structural diagram of the Erbium-Doped Fiber Amplifier (EDFA). Image Credit: Yin, et al., 2021
Figure 3 shows a schematic of the PAS-based sensor system that enables concurrent detection of the H2S and CO pollution gases. For H2S detection, a DFB laser that emits at a central wavelength of 1582 nm was used. The other DFB laser helped target the absorption line of the CO molecule at 1568 nm.
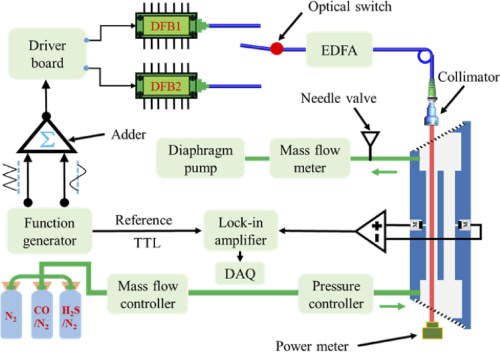
Figure 3. Structural diagram of the photoacoustic pollution gas sensor for simultaneous detection of CO and H2S. Image Credit: Yin, et al., 2021
Results
In the case of the resonant photoacoustic gas sensor, it is essential for the laser to be modulated to one of the typical frequencies, where it is viable to form standing acoustic waves in the resonator. Figure 4 illustrates that a maximum signal amplitude was realized by setting the sine frequency to 1780 Hz.
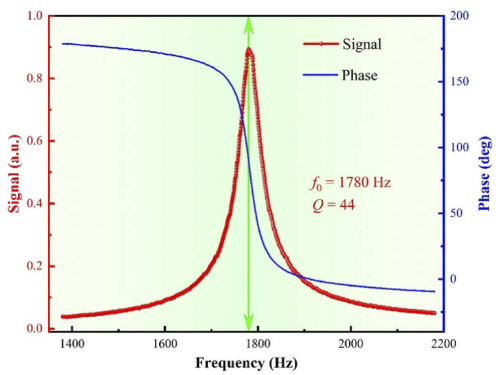
Figure 4. Frequency and phase response curve of the PAC within the range of 1380–2180 Hz. Image Credit: Yin, et al., 2021
Figure 5 depicts the maximum 2f acoustic signals and quantified actual excitation powers after the PAC at various power levels. The sensor noise was maintained constantly at µV level because of the differential PAC with 0.9-mm light spot diameter and 7-mm diametral resonator.
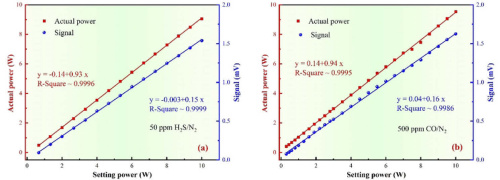
Figure 5. Actual excitation powers and acoustic signals as a function of EDFA setting power in (a) 50 ppm H2S/N2 and (b) 500 ppm CO/N2. Image Credit: Yin, et al., 2021
Figure 6(a) illustrates that there was an increase in the maximum acoustic signal amplitude with a gas pressure increase.
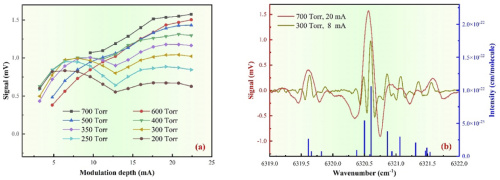
Figure 6. (a) Acoustic signal as a function of sensor gas pressure and modulation depth. (b) 2f H2S photoacoustic signal at 300 Torr and 700 Torr ranging from 6319 to 6322 cm−1. Image Credit: Yin, et al., 2021
Figure 7(a) illustrates that the H2S/N2 concentration gradient ranged from 0 to 7.5 ppm. The inset in Figure 7(a) shows plotting of the mean signals in 0–50 ppm H2S/N2 gas mixtures to verify the sensor response linearity under various concentrations.
Figure 7(b) shows a signal amplitude of 160.5 µV obtained from a 50-ppm CO/N2 gas mixture. A normalized noise equivalent absorption (NNEA) coefficient of 1.7 × 10⁻⁷ cm−1 W Hz−1/2 and a 342.7-ppb detection limit were obtained. The inset in Figure 7(b) shows the linearity of CO gas as indicated by the R2 of 0.9997.
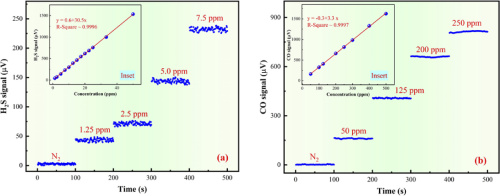
Figure 7. Photoacoustic signal amplitude and response linearity (Inset) of the developed PAS-based gas sensor in stepwise H2S (a) and CO (b) concentration levels. Image Credit: Yin, et al., 2021
Various H2S sensors from near-IR, mid-IR, to THz that benefit from the wavelength independence of PAS-based gas sensors are listed in Table 1.
Table 1. Comparison of different photoacoustic H2S sensors. Source: Yin, et al., 2021
Spectral
range |
Wavelength |
Line
strength
(cm/mol) |
Power |
Technology |
Detection
limit |
NNEA (cm−1
W Hz−1/2) |
| Near-IR |
1582 nm |
1.1×10⁻²² |
1402 mW |
QEPAS [50] |
734 ppb @ 1 s |
9.8×10⁻⁹ |
| 1576 nm |
1.3×10⁻²² |
1 W |
Fiber-optic
acoustic [15] |
33 ppb @ 10 s |
Not
available |
| 2639 nm |
1.7×10⁻²¹ |
3 mW |
QEPAS [51] |
4 ppm @ 1 s |
2.4×10⁻⁹ |
| 1582 nm |
1.1×10⁻²² |
9.54 W |
This work |
31.7 ppb @ 1 s |
8.4×10⁻⁸ |
| Mid-IR |
8018 nm |
6.8×10⁻²² |
50 mW |
PAC [52] |
0.3 ppm @ 30 s |
1.1×10⁻⁸ |
| 8100 nm |
7.8×10⁻²² |
118 mW |
QEPAS [38] |
492 ppb @ 1 s |
3.1×10⁻⁹ |
| 7893 nm |
1.5×10⁻²¹ |
53 mW |
QEPAS [37] |
330 ppb @ 30 s |
7.3×10⁻⁹ |
| THz |
2.91 THz |
1.1×10⁻²² |
0.24 mW |
QEPAS [53] |
30 ppm @ 3 s |
4.4×10⁻¹⁰ |
| 2.87 THz |
5.5×10⁻²⁰ |
150 mW |
QEPAS [39] |
360 ppb @ 10 s |
3.1×10⁻⁸ |
Results
Here, researchers detailed the development of a highly sensitive photoacoustic gas sensor for simultaneous detection of CO and H2S with two DFB lasers featuring the central wavelength of 1568 nm and 1582 nm. A dual-resonator PAC was developed and simulated using a finite element simulation.
An optical switch enabled the simultaneous detection of CO and H2S gas with the help of a commercial fiber amplifier. Optimization of pressure and modulation depth from 200 to 700 Torr enabled achieving the minimum detection limits of 342.7 and 31.7 ppb for CO and H2S, respectively, at ambient temperature and atmospheric pressure.
The corresponding NNEA coefficients were found to be 1.7 × 10⁻⁷ and 8.4 × 10⁻⁸ cm−1 W Hz−1/2.
The ppb-level detection limitation was analogous to the sensor designed with a mid-IR laser source, and even more for H2S by an order of magnitude. More pollutant gases can be detected by using a frequency division multiplexing method because the PAC features a higher resonance frequency.
Journal Reference:
Yin, X., Gao, M., Miao, R., Zhang, L., Zhang, X., Liu, L., Shao, X., Tittel, F. K. (2021) Near-infrared laser photoacoustic gas sensor for simultaneous detection of CO and H2S. Optics Express, 29(21), pp. 34258–34268. Available online: https://www.osapublishing.org/oe/fulltext.cfm?uri=oe-29-21-34258&id=460206.
References and Further Reading
- Giglio, M., et al. (2019) Quartz-enhanced photoacoustic sensor for ethylene detection implementing optimized custom tuning fork-based spectrophone. Optics Express, 27(4), pp. 4271–4280. doi.org/10.1364/OE.27.004271.
- Yin, X., et al. (2017) Sub-ppb nitrogen dioxide detection with a large linear dynamic range by use of a differential photoacoustic cell and a 3.5 W blue multimode diode laser. Sensors and Actuators B: Chemical, 247, pp. 329–335. doi.org/10.1016/j.snb.2017.03.058.
- Yi, H., et al. (2011) Application of a broadband blue laser diode to trace NO2 detection using off-beam quartz-enhanced photoacoustic spectroscopy. Optics Letters, 36(4), pp. 481–483. doi.org/10.1364/OL.36.000481.
- Lv, H., et al. (2021) Radial-cavity quartz-enhanced photoacoustic spectroscopy. Optics Letters, 46(16), pp. 3917–3920. doi.org/10.1364/OL.432308.
- Patimisco, P., et al. (2014) Quartz-Enhanced Photoacoustic Spectroscopy: A Review. Sensors, 14(4), pp. 6165–6206. doi.org/10.3390/s140406165.
- Ma, Y., et al. (2013) QEPAS based ppb-level detection of CO and N2O using a high power CW DFB-QCL. Optics Express, 21(1), pp. 1008–1019. doi.org/10.1364/OE.21.001008.
- Wu, H., et al. (2017) Beat frequency quartz-enhanced photoacoustic spectroscopy for fast and calibration-free continuous trace-gas monitoring. Nature Communications, 8(1), p. 15331. https://doi.org/10.1038/ncomms15331.
- Zheng, K., et al. (2019) Near-Infrared Broadband Cavity-Enhanced Spectroscopic Multigas Sensor Using a 1650 nm Light Emitting Diode. ACS Sensors, 4(7), pp. 1899–1908. https://doi.org/10.1021/acssensors.9b00788.
- Sigrist, M., et al. (2015) Mid-infrared laser-spectroscopic sensing of chemical species. Journal of Advanced Research, 6(3), pp. 529–533. doi.org/10.1016/j.jare.2014.09.002.
- Cao, Y., et al. (2015) Simultaneous atmospheric nitrous oxide, methane and water vapor detection with a single continuous wave quantum cascade laser. Optics Express, 23(3), pp. 2121–2132. doi.org/10.1364/OE.23.002121.
- Yin, X., et al. (2020) Ppb-level SO2 photoacoustic sensors with a suppressed absorption−desorption effect by using a 7.41 µm external-cavity quantum cascade laser. ACS Sensors, 5(2), pp. 549–556. doi.org/10.1021/acssensors.9b02448.
- Wu, H., et al. (2019) Atmospheric CH4 measurement near a landfill using an ICL-based QEPAS sensor with V-T relaxation self-calibration. Sensors and Actuators B: Chemical, 297, p. 126753. doi.org/10.1016/j.snb.2019.126753.
- Kottmann., J., et al. (2016) Mid-infrared photoacoustic detection of glucose in human skin: towards non-invasive diagnostics. Sensors, 16(10), p. 1663. doi.org/10.3390/s16101663.
- Sampaolo, A., et al. (2020) Quartz-enhanced photoacoustic spectroscopy for hydrocarbon trace gas detection and petroleum exploration. Fuel, 277(1), p. 118118. doi.org/10.1016/j.fuel.2020.118118.
- Chen, K., et al. (2019) Parts-per-billion-level detection of hydrogen sulfide based on near-infrared all-optical photoacoustic spectroscopy. Sensors and Actuators B: Chemical, 283(15), pp. 1–5. doi.org/10.1016/j.snb.2018.11.163.
- Qiao, S., et al. (2021) Ppt level carbon monoxide detection based on light-induced thermoelastic spectroscopy exploring custom quartz tuning forks and a mid-infrared QCL. Optics Express, 29(16), pp. 25100–25108. doi.org/10.1364/OE.434128
- Lang, Z., et al. (2021) Quartz tuning fork-based demodulation of an acoustic signal induced by photo-thermo-elastic energy conversion. Photoacoustics, 22, p. 100272. doi.org/10.1016/j.pacs.2021.100272.
- Ma, Y., et al. (2020) Trace gas sensing based on multi-quartz-enhanced photothermal spectroscopy. Photoacoustics, 20, p. 100206. doi.org/10.1016/j.pacs.2020.100206.
- Jin, W., et al. (2015) Ultra-sensitive all-fibre photothermal spectroscopy with large dynamic range. Nature Communications, 6(1), p. 6767. doi.org/10.1038/ncomms7767.
- Ma, Y., et al. (2018) Quartz-tuning-fork enhanced photothermal spectroscopy for ultra-high sensitive trace gas detection. Optics Express, 26(24), pp. 32103–32110. doi.org/10.1364/OE.26.032103.
- Zheng, H., et al. (2020) Quartz-enhanced photoacoustic spectroscopy employing pilot line manufactured custom tuning forks. Photoacoustics, 17, p. 100158. doi.org/10.1016/j.pacs.2019.100158.
- Qiao, S., et al. (2021) Trace gas sensing based on single-quartz-enhanced photoacoustic–photothermal dual spectroscopy. Optics Letters, 46 (10), pp. 2449–2452. doi.org/10.1364/OL.423801.
- Hu, Y., et al. (2021) Quartz-enhanced photoacoustic-photothermal spectroscopy for trace gas sensing. Optics Express, 29(4), pp. 5121–5127. doi.org/10.1364/OE.418256.
- Ma, Y., et al. (2020) Ultra-high sensitive trace gas detection based on light-induced thermoelastic spectroscopy and a custom quartz tuning fork. Applied Physics Letters, 116(1), p. 011103. doi.org/10.1063/1.5129014.
- Liu, L., et al. (2021) Highly sensitive broadband differential infrared photoacoustic spectroscopy with wavelet denoising algorithm for trace gas detection. Photoacoustics, 21, p. 100228. doi.org/10.1016/j.pacs.2020.100228.
- Zhou, Q., et al. (2015) Detection of Dissolved Carbon Monoxide in Transformer Oil Using 1.567 m Diode Laser-Based Photoacoustic Spectroscopy. Journal of Spectroscopy, 2015, pp. 1–7. doi.org/10.1155/2015/737635.
- Yin, X., et al. (2016) Impact of humidity on quartz-enhanced photoacoustic spectroscopy based CO detection using a near-IR telecommunication diode laser. Sensors. 16 (2), p. 162. doi.org/10.3390/s16020162.
- Qiao, S., et al. (2019) A Sensitive Carbon Monoxide Sensor Based on Photoacoustic Spectroscopy with a 2.3 µm Mid-Infrared High-Power Laser and Enhanced Gas Absorption. Sensors. 19 (14). doi.org/10.3390/s19143202.
- He, Y., et al. (2019) A portable gas sensor for sensitive CO detection based on quartz-enhanced photoacoustic spectroscopy. Optics & Laser Technology, 115, pp. 129–133. doi.org/10.1016/j.optlastec.2019.02.030.
- Li, Z., et al. (2017) Improved evanescent-wave quartz-enhanced photoacoustic CO sensor using an optical fiber taper. Sensors and Actuators B: Chemical, 248, pp. 1023–1028. doi.org/10.1016/j.snb.2017.03.029.
- Xu-Kun, Y., et al. (2021) Design and optimization of photoacoustic CO gas sensor for fault diagnosis of SF6 gas insulated equipment. Acta Physica Sinica, 70(17), p. 170701. doi.org/10.7498/aps.70.20210532.
- Pinto, D., et al. (2021) Parts-per-billion detection of carbon monoxide: A comparison between quartz-enhanced photoacoustic and photothermal spectroscopy. Photoacoustics, 22, p. 100244. doi.org/10.1016/j.pacs.2021.100244.
- Gong, Z., et al. (2018) Photoacoustic spectroscopy based multi-gas detection using high-sensitivity fiber-optic low-frequency acoustic sensor. Sensors and Actuators B: Chemical, 260, pp. 357–363. doi.org/10.1016/j.snb.2018.01.005.
- Borri, S., et al. (2014) Intracavity quartz-enhanced photoacoustic sensor. Applied Physics Letters, 104(9), p. 091114. doi.org/10.1063/1.4867268.
- Li, S., et al. (2019) Ppb-Level Quartz-Enhanced Photoacoustic Detection of Carbon Monoxide Exploiting a Surface Grooved Tuning Fork. Analytical Chemistry, 91(9), 5834–5840. doi.org/10.1021/acs.analchem.9b00182.
- Herpen, M., et al. (2006) Optical parametric oscillator-based photoacoustic detection of CO2 at 4.23 µm allows real-time monitoring of the respiration of small insects. Applied Physics B, 82(4), pp. 665–669. doi.org/10.1007/s00340-005-2119-4.
- Cumis, M., et al. (2014) Widely-tunable mid-infrared fiber-coupled quartz-enhanced photoacoustic sensor for environmental monitoring. Optics Express, 22(23), pp. 28222–28231. doi.org/10.1364/OE.22.028222.
- Helman, M., et al. (2017) Off-beam quartz-enhanced photoacoustic spectroscopy-based sensor for hydrogen sulfide trace gas detection using a mode-hop-free external cavity quantum cascade laser. Applied Physics B, 123(5), p. 141. doi.org/10.1007/s00340-017-6717-8.
- Sampaolo, A., et al. (2021) H2S quartz-enhanced photoacoustic spectroscopy sensor employing a liquid-nitrogen-cooled THz quantum cascade laser operating in pulsed mode. Photoacoustics, 21(3–4), p. 100219. doi.org/10.1016/j.pacs.2020.100219.
- Ma, Y., et al. (2019) Highly sensitive acetylene detection based on multi-pass retro-reflection-cavity-enhanced photoacoustic spectroscopy and a fiber amplified diode laser. Optics Express, 27(10), pp. 14163–14172. doi.org/10.1364/OE.27.014163.
- Yin, X., et al. (2017) Ppb-level H2S detection for SF6 decomposition based on a fiber-amplified telecommunication diode laser and a background-gas-induced high-Q photoacoustic cell. Applied Physics Letters, 111(3), p. 031109. doi.org/10.1063/1.4987008.
- Ma. Y., et al. (2017) Ultra-high sensitive acetylene detection using quartz-enhanced photoacoustic spectroscopy with a fiber amplified diode laser and a 30.72 kHz quartz tuning fork. Applied Physics Letters. 110 (3), p. 031107. doi.org/10.1063/1.4974483.
- Wu, H., et al. (2015) Fiber-Amplifier-Enhanced QEPAS sensor for simultaneous trace gas detection of NH3 and H2S. Sensors. 15(10), pp. 26743–26755. doi.org/10.3390/s151026743.
- Wang, Z., et al. (2018) Wavelength modulation technique-based photoacoustic spectroscopy for multipoint gas sensing. Applied Optics. 57(11), pp. 2909–2914. doi.org/10.1364/AO.57.002909.
- Sampaolo, A., et al. (2019) Methane, ethane and propane detection using a compact quartz enhanced photoacoustic sensor and a single interband cascade laser. Sensors and Actuators B: Chemical, 282, pp. 952–960. doi.org/10.1016/j.snb.2018.11.132.
- Liu, K., et al. (2017) Multi-resonator photoacoustic spectroscopy. Sensors and Actuators B: Chemical, 251, pp. 632–636. doi.org/10.1016/j.snb.2017.05.114.
- Cao, Y., et al. (2021) Three-wavelength measurement of aerosol absorption using a multi-resonator coupled photoacoustic spectrometer. Optics Express, 29(2), pp. 2258–2269. doi.org/10.1364/OE.412922.
- Yu, Y., et al. (2021) Multicomponent gas detection technology of FDM and TDM based on photoacoustic spectroscopy. Applied Optics. 60 (4), pp. 838–843. doi.org/10.1364/AO.411995.
- Sherstova, I., et al. (2020) Comparative studies of photo-acoustic gas analyzers based on tunable CO2 lasers with external and intracavity detector arrangement. Infrared Physics & Technology, 105, p. 103170. doi.org/10.1016/j.infrared.2019.103170.
- Wu, H., et al. (2015) Enhanced near-infrared QEPAS sensor for sub-ppm level H2S detection by means of a fiber amplified 1582 nm DFB laser. Sensors and Actuators B: Chemical, 221, pp. 666–672. doi.org/10.1016/j.snb.2015.06.049.
- Viciani, S., et al. (2015) A quartz-enhanced photoacoustic sensor for H2S trace-gas detection at 2.6 µm. Applied Physics B, 119 (1), pp. 21–27. doi.org/10.1007/s00340-014-5991-y.
- Bonilla-Manrique, O., et al. (2019) Hydrogen Sulfide Detection in the Midinfrared Using a 3D-Printed Resonant Gas Cell. Journal of Sensors, pp. 1–7. doi.org/10.1155/2019/6437431.
- Spagnolo, V., et al. (2015) THz Quartz-enhanced photoacoustic sensor for H2S trace gas detection. Optics Express, 23(6), pp. 7574–7582. doi.org/10.1364/OE.23.007574.