Improving the efficiency of current technology requires optimizing design, creating monitoring tools, and failure-mitigation techniques, such as battery management systems. The advancement of electrochemical cells requires an improvement in sensing and imaging technologies.
Functional imaging provides insight into the important electrochemical processes, but structural information is required to understand and evaluate the integrity of the cell components.
Measurement qualities such as sensitivity and resolution are crucial throughout the research and development of new battery technologies. The emphasis will move to practical considerations, such as quick throughput and non-invasive, safe operation, throughout manufacturing, in-use monitoring, maintenance, and recycling. Thermal measurements and open-circuit voltages are commonly employed for this purpose.
Key reliable indicators of the state of charge (SoC), state of health (SoH), and capacity are required in particular. Individual sensing demands for battery research, manufacture, and operation have been addressed in various ways. A single measurement modality that combines excellent performance and convenience has yet to be discovered.
In this study, researchers present and demonstrate a non-invasive imaging technique for mapping intra-cell electrochemical activity, providing new insights into battery cell performance and safety. This technology employs very sensitive magnetometers to detect local current densities inside the cell in a non-invasive and contact-free manner using magnetic fields present outside the cell.
As an example, researchers get magnetic field maps of a lithium-ion cell under load, where the mapped current flow patterns develop due to an electrochemical cell’s overpotentials and impedance, as represented by the Newman model of porous electrodes.
Current density is crucial in creating SoC inhomogeneities, forecasting heat production, solid electrolyte interface thickness and creation, inhomogeneous lithium-ion extraction, and lithium plating, all of which are important to understanding battery behavior. Finally, a better knowledge of these impacts will aid in maximizing battery longevity.
Addressing lithium-ion transport mechanisms, especially long-term equilibration processes, requires an understanding of inhomogeneous current density distribution that is non-particular. While this research is focused on lithium-ion pouch cells, the technique may be easily adapted to other types of batteries and cell shapes by adjusting the computational current reconstruction procedures, which are the most straightforward for the current flat scenario.
The capacity to monitor defect development, such as dendritic growth, in real-time will be possible because of the ability to spatially resolve areas of high electrical conductivities. It will also make it much easier to investigate conduction processes and characterize new battery chemistries with more precision than open-circuit voltage measurements can offer.
Methodology
Figure 1 depicts a high-level overview of the system. A single cell is extracted from a 2nd generation AESC pouch battery with a rated capacity of 66 Ah. Each cell consists of 35 electrode pairs as well as aluminum and copper current collectors measuring 22 cm x 26 cm in size.
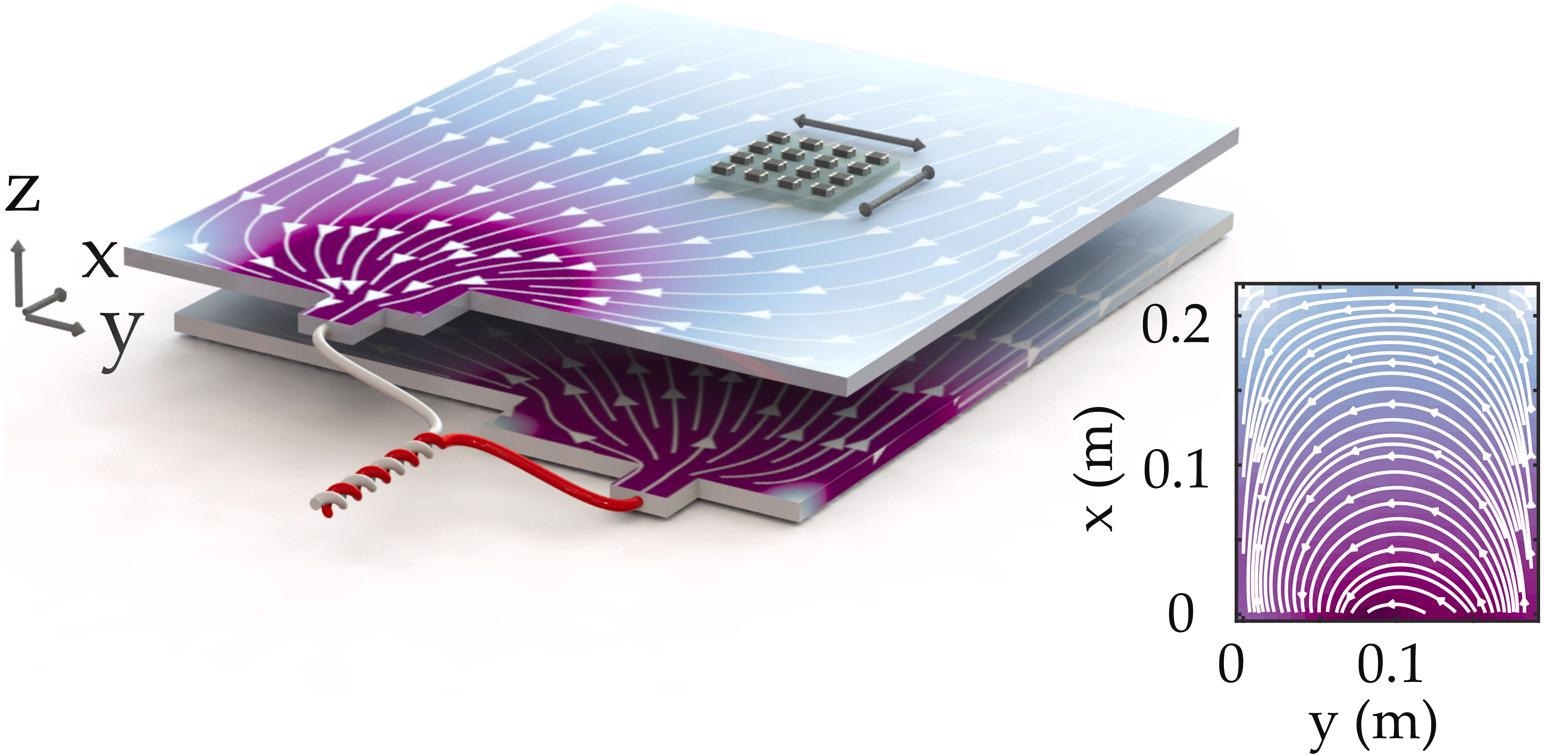
Figure 1. The current flow within a Li-ion battery and magnetic field give rise to a magnetic field, which is measured by a magnetometer array. The image shows a combination of current collectors and electrodes while the separator is suppressed for clarity. Image Credit: Bason, et al., 2022
The battery is placed 6 mm under a 4 x 4 fluxgate array (FGA) of single-axis magnetometers (Texas Instruments DRV425); however, other low-cost magnetometers would also work. Each magnetometer is set up to record a component of the magnetic flux density in a plane above the cell, either Bx or By.
Researchers compare their magnetic field pictures to those predicted by a finite-element model (FEM) to see how accurate the magnetic field observations are. The stationary solutions of Poisson’s equation for the voltage of the cell are calculated using this model, which is based on a single pair of electrodes.
The effective conductivity, which is a mix of electrical and ionic conductivity, is adjusted at 1 x 10⁻³ Sm-1, the value required to provide a voltage drop in the open circuit. The incorporation of lithium ions inactive materials on both sides of the electrodes is therefore combined in the z component of the current density.
Results and Discussion
Figure 2 depicts an example of the two magnetic fields after background removal. Magnetic fields of over 100 µT have been measured, and the results are in good statistical agreement with the FEM calculations. The high current density at the outputs and inputs of the current tabs dominates the magnetic field intensity, which is a reflection of the pouch cell design under examination.
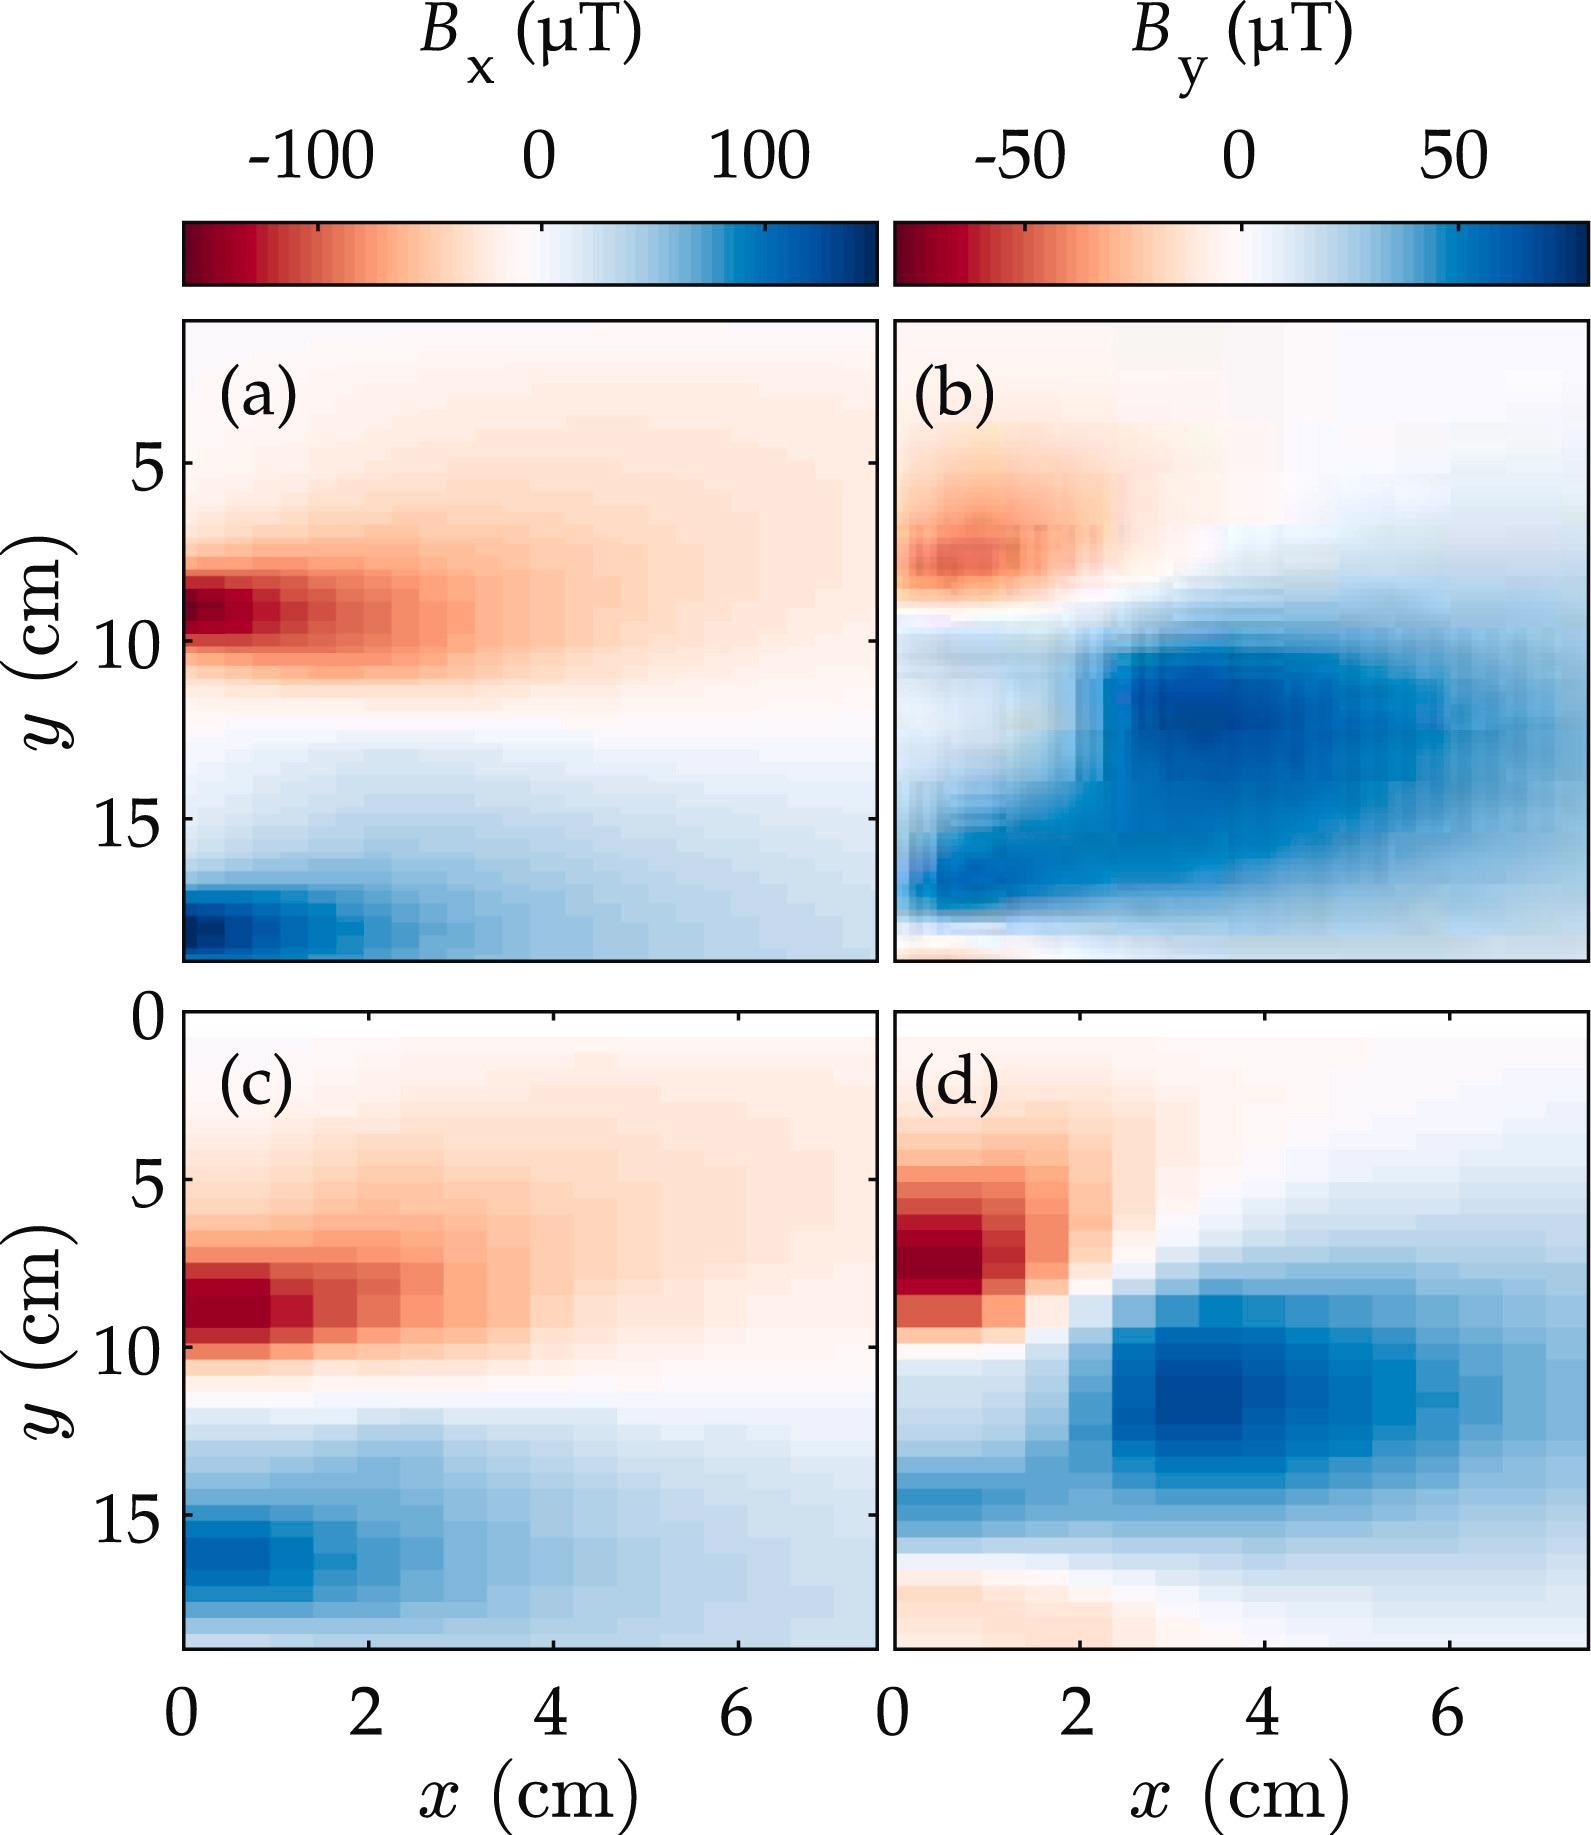
Figure 2. Magnetic fields generated by a 10 A (0.2 Crate) charge: (a) and (b) correspond to the By and Bx magnetic field components produced by the FEM predictions, respectively. The results of the measurements after background subtraction are shown in (c) and (d). The standard error associated with each measured field component measurement is around 100 nT. Image Credit: Bason, et al., 2022
One method for enhancing measurement fidelity is to add more constraints to the model, such as Kirchhoff’s law—this method is employed in fuel cell analyses. Figure 3 shows a typical current density picture taken after cell discharge.
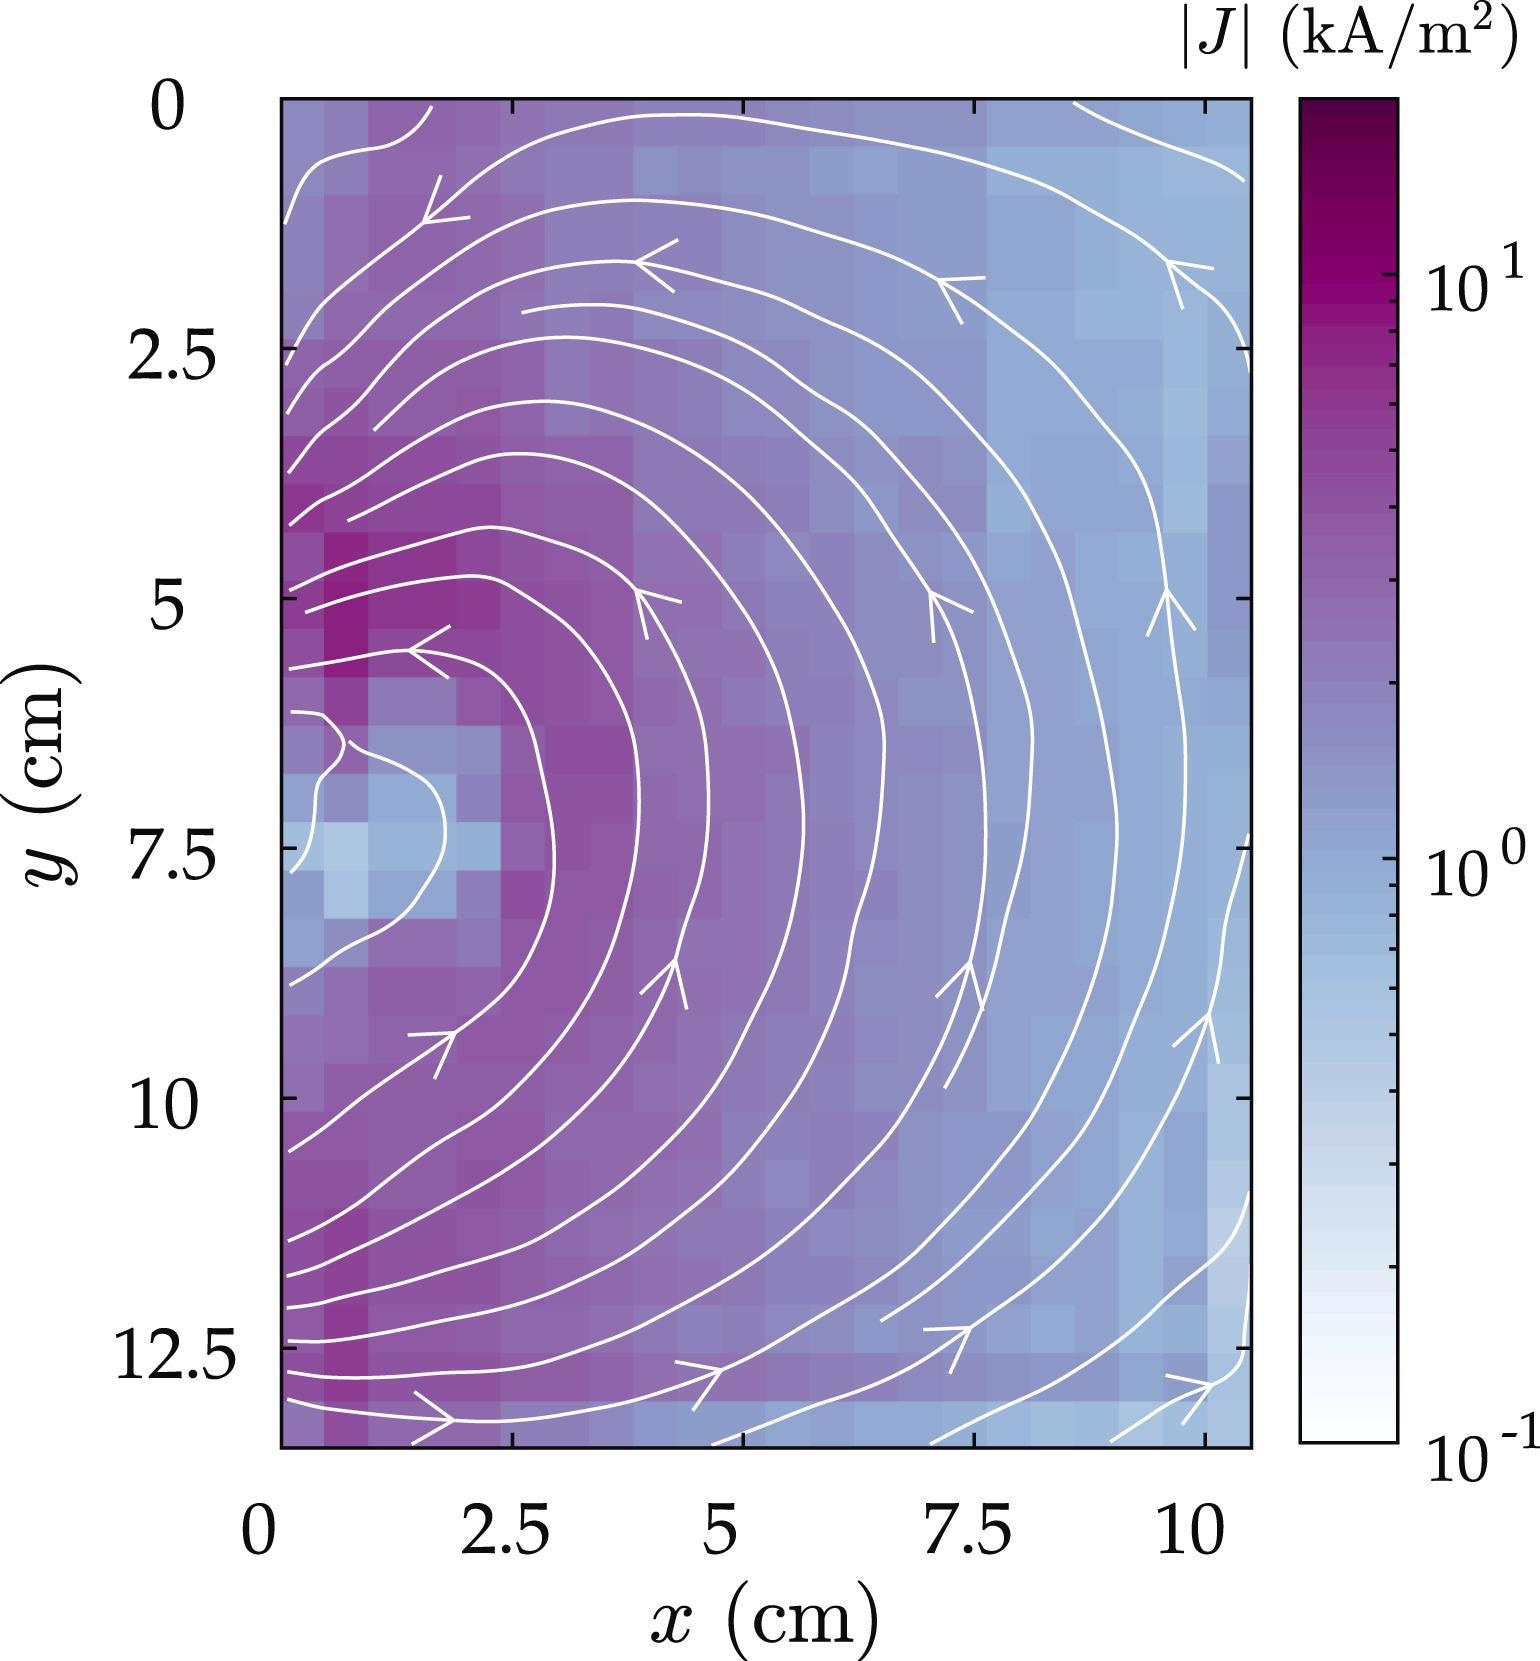
Figure 3. Reconstructed current density image corresponding to a single electrode pair, during a 10 A discharge. The top half of the image is shown here, with the battery tabs located at x = 0. Image Credit: Bason, et al., 2022
Researchers are presently measuring magnetic field variations that arise at different charge phases to study phenomena not described by this model, such as changes with SoC.
The magnetic field differences for the first column of measurements, i.e., those nearest to the current collectors, are shown in Figure 4.
The variations in total magnetic field components that correspond to the difference between an initially charged battery and successive charge states are shown in Figure 4(a). The difference between primarily empty batteries is depicted in Figure 4(b).
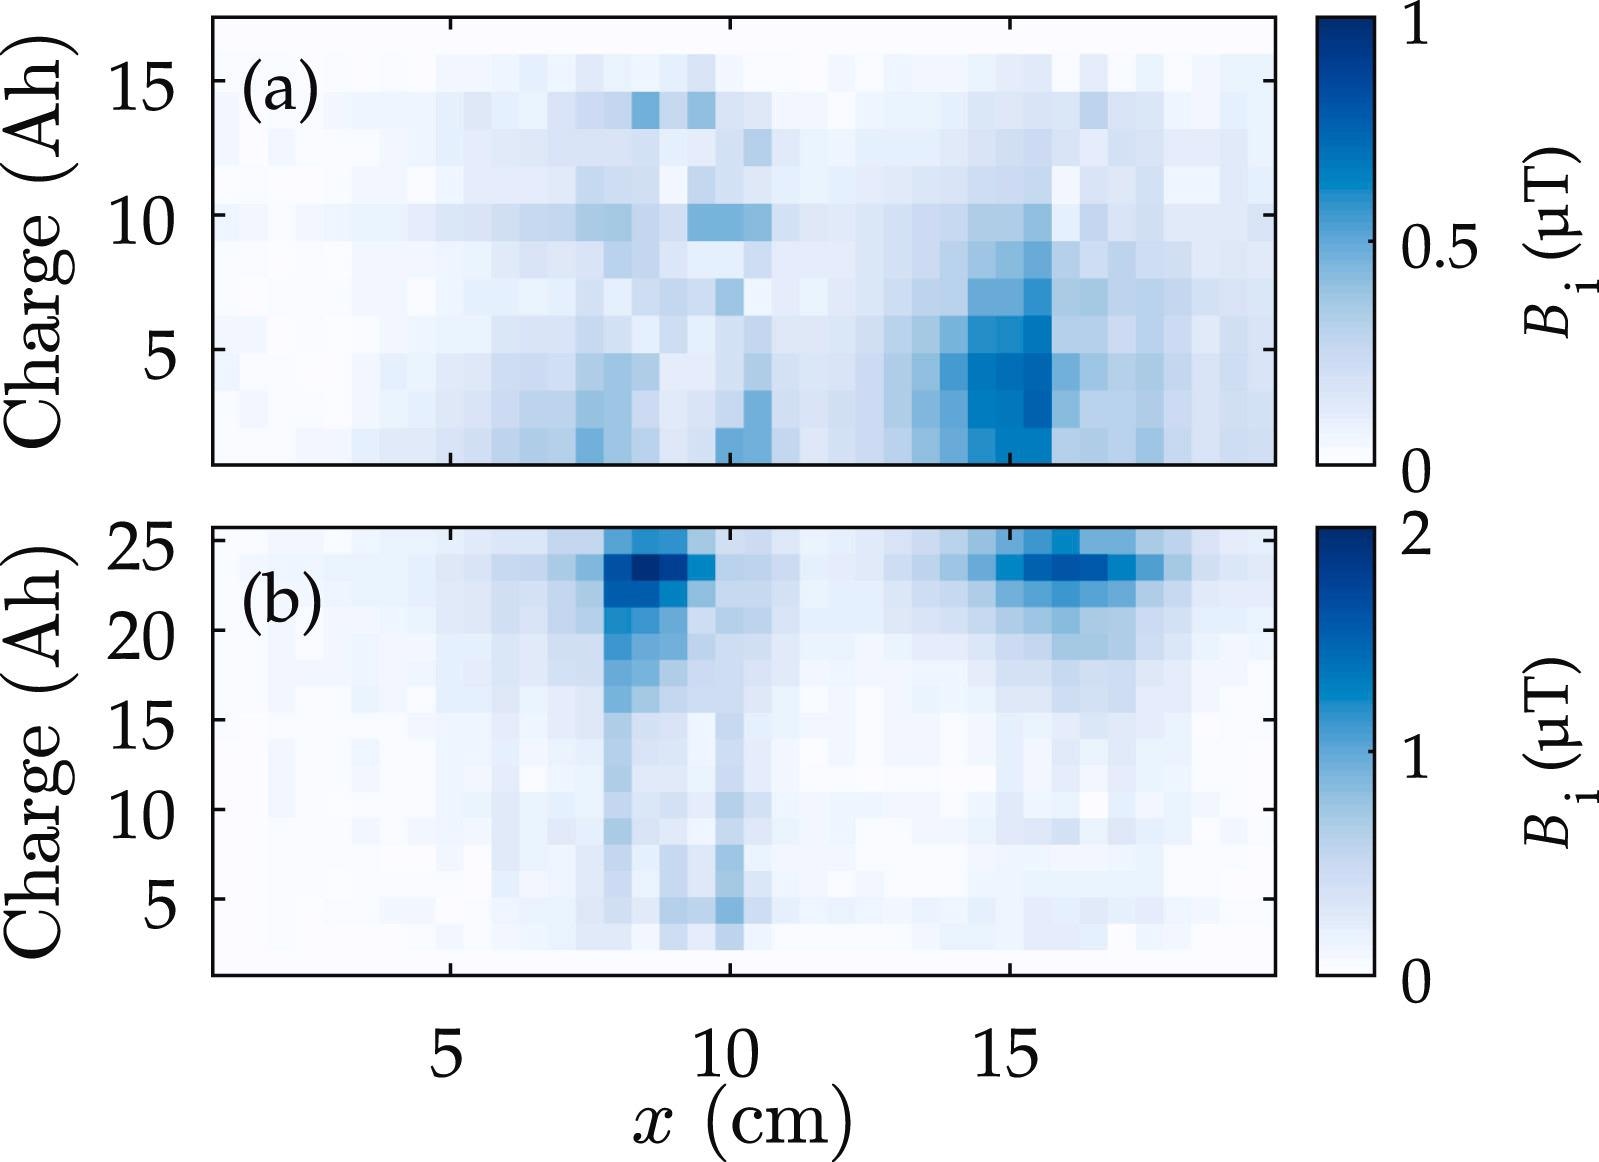
Figure 4. Change in total magnetic field around the battery terminals during a period of discharging (a) and charging (b) at 10 A. Image Credit: Bason, et al., 2022
Researchers envisage current density pictures with noise floors over six orders of magnitude lower than those reported here, given the ability to detect magnetic field changes with sub-femtotesla sensitivity and the advancement of sensor arrays. These will make it possible to measure current densities on a 1 nA cm2 scale.
Conclusion
Researchers have demonstrated how extremely sensitive magnetometer arrays may be utilized to provide in-situ current density imaging of lithium-ion pouch cells under load without aggressive methods. On the percent level, researchers prove the general validity of FEM models while also identifying localized, SOC-dependent deviations.
Scientists expect the technology to be employed shortly to identify current density “hotspots” in real-time, such as those associated with dendrite development or mechanical integrity concerns like soft and hard short circuits. Furthermore, the technique will aid in the testing of new electrochemical cell designs in which current density uniformity is important.
Because of its speed, non-invasive nature, and highly-resolved functional mapping, integrating high-sensitivity and quantum magnetometers for functional battery image will significantly influence research and development, manufacturing, safe use, and recycling.
Journal Reference:
Bason, M.G., Coussens, T., Withers, M., Abel, C., Kendall, G., Krüger, P. (2022) Non-invasive current density imaging of lithium-ion batteries. Journal of Power Sources, 533, p. 231312. Available Online: https://www.sciencedirect.com/science/article/pii/S0378775322003251.
References and Further Reading
- Passerini S & Scrosati B (2016) Lithium and lithium-ion batteries: Challenges and prospects. The Electrochemical Society Interface, 25 (3), pp. 85–87. doi.org/10.1149/2.F09163if.
- Ceder G., et al. (1998) Identification of cathode materials for lithium batteries guided by first-principles calculations. Nature, 392 (6677), pp. 694–696. doi.org/10.1038/33647.
- Fergus J W (2010) Recent developments in cathode materials for lithium-ion batteries. Journal of Power Sources, 195 (4), pp. 939–954. doi.org/10.1016/j.jpowsour.2009.08.089.
- Zhao Q., et al. (2020) Designing solid-state electrolytes for safe, energy-dense batteries. Nature Reviews Materials, 5 (3), pp. 229–252. doi.org/10.1038/s41578-019-0165-5.
- Yu C., et al. (2017) Accessing the bottleneck in all-solid-state batteries, lithium-ion transport over the solid-electrolyte-electrode interface. Nature Communications, 8 (1), p. 1086. doi.org/10.1038/s41467-017-01187-y.
- Xiong R., et al. (2018) Towards a smarter battery management system: A critical review on battery state of health monitoring methods. Journal of Power Sources, 405, pp. 18–29. doi.org/10.1016/j.jpowsour.2018.10.019.
- Shearing P.R., et al. (2012) Multi length scale microstructural investigations of a commercially available li-ion battery electrode. 159 (7), pp. A1023–A1027 https://doi.org/10.1149/2.053207jes.
- Klamor S., et al. (2015) 7Li in situ 1D NMR imaging of a lithium-ion battery. Physical Chemistry Chemical Physics, 17 (6), pp. 4458–4465. doi.org/10.1039/C4CP05021E.
- Yuan Y., et al. (2017) Understanding materials challenges for rechargeable ion batteries with in situ transmission electron microscopy. Nature Communications, 8, p. 15806. doi.org/10.1038/ncomms15806.
- Han F., et al. (2019) High electronic conductivity as the origin of lithium dendrite formation within solid electrolytes. Nature Energy, 2058–7546, p. 1. doi.org/10.1038/s41560-018-0312-z.
- Murashko K., et al. (2013) Three-dimensional thermal model of a lithium-ion battery for hybrid mobile working machines: Determination of the model parameters in a pouch cell. IEEE Transactions on Energy Conversion, 28 (2), pp. 335–343. doi.org/10.1109/TEC.2013.2255291.
- Xing Y., et al. (2014) State of charge estimation of lithium-ion batteries using the open-circuit voltage at various ambient temperatures. Applied Energy, 113, pp. 106–115. doi.org/10.1016/j.apenergy.2013.07.008.
- Yazdanpour M., et al. (2014) A distributed analytical electro-thermal model for pouch-type lithium-ion batteries. Journal of the Electrochemical Society, 161 (14), pp. A1953–A1963. doi.org/10.1149/2.1191412jes.
- Wieser C., et al. (2000) New technique for two-dimensional current distribution measurements in electrochemical cells. Journal of Applied Electrochemistry, 30 (7), pp. 803–807. doi.org/10.1023/A:1004047412066.
- Hsieh A.G., et al. (2015) Electrochemical-acoustic time of flight: In operando correlation of physical dynamics with battery charge and health. Energy & Environmental Science, 8 (5), pp. 1569–1577. doi.org/10.1039/C5EE00111K.
- Ilott A.J., et al. (2018) Rechargeable lithium-ion cell state of charge and defect detection by in-situ inside-out magnetic resonance imaging. Nature Communications, 9 (1), p. 1776. doi.org/10.1038/s41467-018-04192-x.
- Ifrek L., et al. (2019) Fault detection for polymer electrolyte membrane fuel cell stack by external magnetic field. Electrochimica Acta, 313, pp. 141–150. doi.org/10.1016/j.electacta.2019.04.193.
- Hu Y., et al. (2020) Sensitive magnetometry reveals inhomogeneities in charge storage and weak transient internal currents in li-ion cells. Proceedings of the National Academy of Sciences of the United States of America, 117 (20), pp. 10667–10672. doi.org/10.1073/pnas.1917172117.
- Newman J S & Tobias C W (1962) Theoretical analysis of current distribution in porous electrodes. 109 (12), p. 1183. doi.org/10.1149/1.2425269.
- Kindermann F.M., et al. (2017) Measurements of lithium-ion concentration equilibration processes inside graphite electrodes. Journal of Power Sources, 342, pp. 638–643. doi.org/10.1016/j.jpowsour.2016.12.093.
- Sieg J., et al. (2019) Fast charging of an electric vehicle lithium-ion battery at the limit of the lithium deposition process. Journal of Power Sources, 427, pp. 260–270. doi.org/10.1016/j.jpowsour.2019.04.047.
- Colclasure A.M., et al. (2019) Requirements for enabling extreme fast charging of high energy density Li-ion cells while avoiding lithium plating. Journal of Power Sources, 166 (8), pp. A1412–A1424. doi.org/10.1016/j.jpowsour.2019.04.047.
- Taheri P., et al. (2014) Theoretical analysis of potential and current distributions in planar electrodes of lithium-ion batteries. Electrochimica Acta, 133, pp. 197–208. doi.org/10.1016/j.electacta.2014.04.040.
- Meyer M., et al. (2013) Study of the local SOC distribution in a lithium-ion battery by physical and electrochemical modeling and simulation. Applied Mathematical Modelling, 37 (4), pp. 2016–2027. doi.org/10.1016/j.apm.2012.04.029.
- Varzi A., et al. (2016) Challenges and prospects of the role of solid electrolytes in the revitalization of lithium metal batteries. Journal of Materials Chemistry A, 4 (44), pp. 17251–17259. doi.org/10.1039/D2TA01750D.
- Park M., et al. (2010) A review of conduction phenomena in li-ion batteries. Journal of Power Sources, 195 (24), pp. 7904–7929. doi.org/10.1016/j.jpowsour.2010.06.060.
- Manthiram A., et al. (2014) Rechargeable lithium-sulfur batteries. Chemical Reviews, 114 (23), pp. 11751–11787. doi.org/10.1021/cr500062v.
- Kovachev G., et al. (2019) Analytical dissection of an automotive li-ion pouch cell. Batteries, 5 (4), p. 67https://doi.org/10.3390/batteries5040067.
- Huang G W & Jeng J T (2018) Implementation of 16-channel AMR sensor array for quantitative mapping of two-dimension current distribution. IEEE Transactions on Magnetics, 54 (11), pp. 1–5. doi.org/10.1109/TMAG.2018.2844290.
- Han H., et al. (2017) Open source 3D multipurpose measurement system with submillimetre fidelity and first application in magnetic resonance. Scientific Reports, 7 (1), pp. 1–12. doi.org/10.1038/s41598-017-13824-z.
- Roth B.J., et al. (1989) Using a magnetometer to image a two-dimensional current distribution. Journal of Applied Physics, 65 (1), pp. 361–372. doi.org/10.1063/1.342549.
- Kress R., et al. (2002) Reconstruction of a current distribution from its magnetic field. Inverse Problems, 18 (4), pp. 1127–1146. doi.org/10.1088/0266-5611/18/4/312.
- Hauer K.H., et al. (2005) On uniqueness and non-uniqueness for current reconstruction from magnetic fields. Inverse Problems, 21 (3), pp. 955–967. doi.org/10.1088/0266-5611/21/3/010.
- Hauer K.H., et al. (2008) Algorithms for magnetic tomography - on the role of a priori knowledge and constraints. Inverse Problems, 24 (4), p. 045008. doi.org/10.1088/0266-5611/24/4/045008.
- Zhang Y.C., et al. (2008) Characterization of external pressure effects on lithium-ion pouch cell. Proceedings of the IEEE International Conference on Industrial Technology, IEEE, pp. 2055–2059.
- Timmons A & Dahn J R sotropic volume expansion of particles of amorphous metallic alloys in composite negative electrodes for li-ion batteries. Journal of The Electrochemical Society, 154 (5), p. A444. doi.org/10.1149/1.2711075.
- Kominis I.K., et al. (2003) A subfemtotesla multichannel atomic magnetometer. Nature, 422 (6932), pp. 596–599. doi.org/10.1038/nature01484.
- Borna A., et al. (2019) Magnetic source imaging using a pulsed optically pumped magnetometer array. IEEE Transactions on Instrumentation and Measurement, 68 (2), pp. 493–501. doi.org/10.1109/TIM.2018.2851458