Concrete admixtures such as retarders, superplasticizers, and setting accelerators can influence the pH development in cementitious systems. These are often utilized in wet shotcrete applications to produce quick setting and high early strength.
Al3+-ions (liberated from the accelerator) are instantly transformed into Al(OH4)- and Al(OH)3 aquo-complexes in the highly alkaline pore solution. Here, they combine with SO42- (from the accelerator as well as the pore solution) and Ca2+ (from the pore solution) to generate ettringite. The pore solution’s pH is significantly reduced due to these processes, which consume OH- ions.
In strongly diluted suspension with high water/binder (w/b) ratios >10, or after high pressure “squeezing” operations, state-of-the-art pH analysis in cementitious systems is routinely done. Techniques to squeeze out the pore solution of samples at realistic w/b ratios (~0.5) are, on the other hand, associated with a complex test setup.
Furthermore, the reported data have a poor temporal resolution, only representing the condition of the pore solution at certain moments of hydration. Important changes in the pore solution may be ignored or not properly mapped if hydration events occur very fast, as in “accelerated” systems.
A new approach for in situ pH monitoring during the hydration of cementitious systems means of optical sensors and innovative pH indicators with high apparent pKa values were recently described in a study published in the journal Cement and Concrete Research. The proposed approach was further refined in the current study for the field of accelerated systems when reactions occur at a high rate and are followed by rapid temperature rises.
In situ pH measurements provide a better understanding of the events that occur immediately after the setting accelerator is intermixed. Early and later phases of shotcrete hydration require a correct reaction sequence during the initial minutes of hydration to achieve the necessary mechanical qualities. To optimize the mixes and their characteristics, a thorough understanding of the changes occurring in the system, both in the fluid and solid phases, is essential.
Methodology
CEM I 52.5R (CEM I) and CEM I 52.5N SR0, both conforming to EN 197-1, were utilized in the studies (CEM SR0). XRD and subsequent Rietveld studies were used to identify the mineralogical composition of both type of cement, as indicated. Table 1 shows the results.
Table 1. Mineralogical composition of CEM I and CEM SR0. Source: Briendl, et al., 2022
| Phase (wt%) |
CEM I |
CEM SR0 |
| Alite (C3S) |
59.0 |
68.7 |
| Belite (C2S) |
11.0 |
4.1 |
| Aluminate (C3A, cubic) |
2.2 |
0.4 |
| Aluminate (C3A, orthorhombic) |
8.6 |
0.2 |
| Ferrite (C4AF) |
6.3 |
14.7 |
| Anhydrite |
1.7 |
1.9 |
| Arcanite |
0.9 |
0.1 |
| Bassanite |
2.4 |
2.1 |
| Gypsum |
0.4 |
1.4 |
| Dolomite |
1.8 |
1.6 |
| Calcite |
0.2 |
0.5 |
| Periclase |
3.3 |
2.7 |
| Portlandite |
1.2 |
0.5 |
| Lime |
0.3 |
0.5 |
| Residual |
0.7 |
1.0 |
A commercial alkali-free Al2(SO4)3 based suspension was employed as a setting accelerator (characteristics of the accelerator are listed in Table 2.
Table 2. Accelerator characteristics, according to the supplier. Source: Briendl, et al., 2022
| . |
. |
| Al2O3/SO42– molar ratio |
0.33 |
| Total Al2(SO4)3 content |
~35 wt% |
| pH |
2.4 (14.4 °C) |
| Density |
~1.4 kg/m3 |
Figure 1 shows the test setup for continuous in situ pH monitoring.
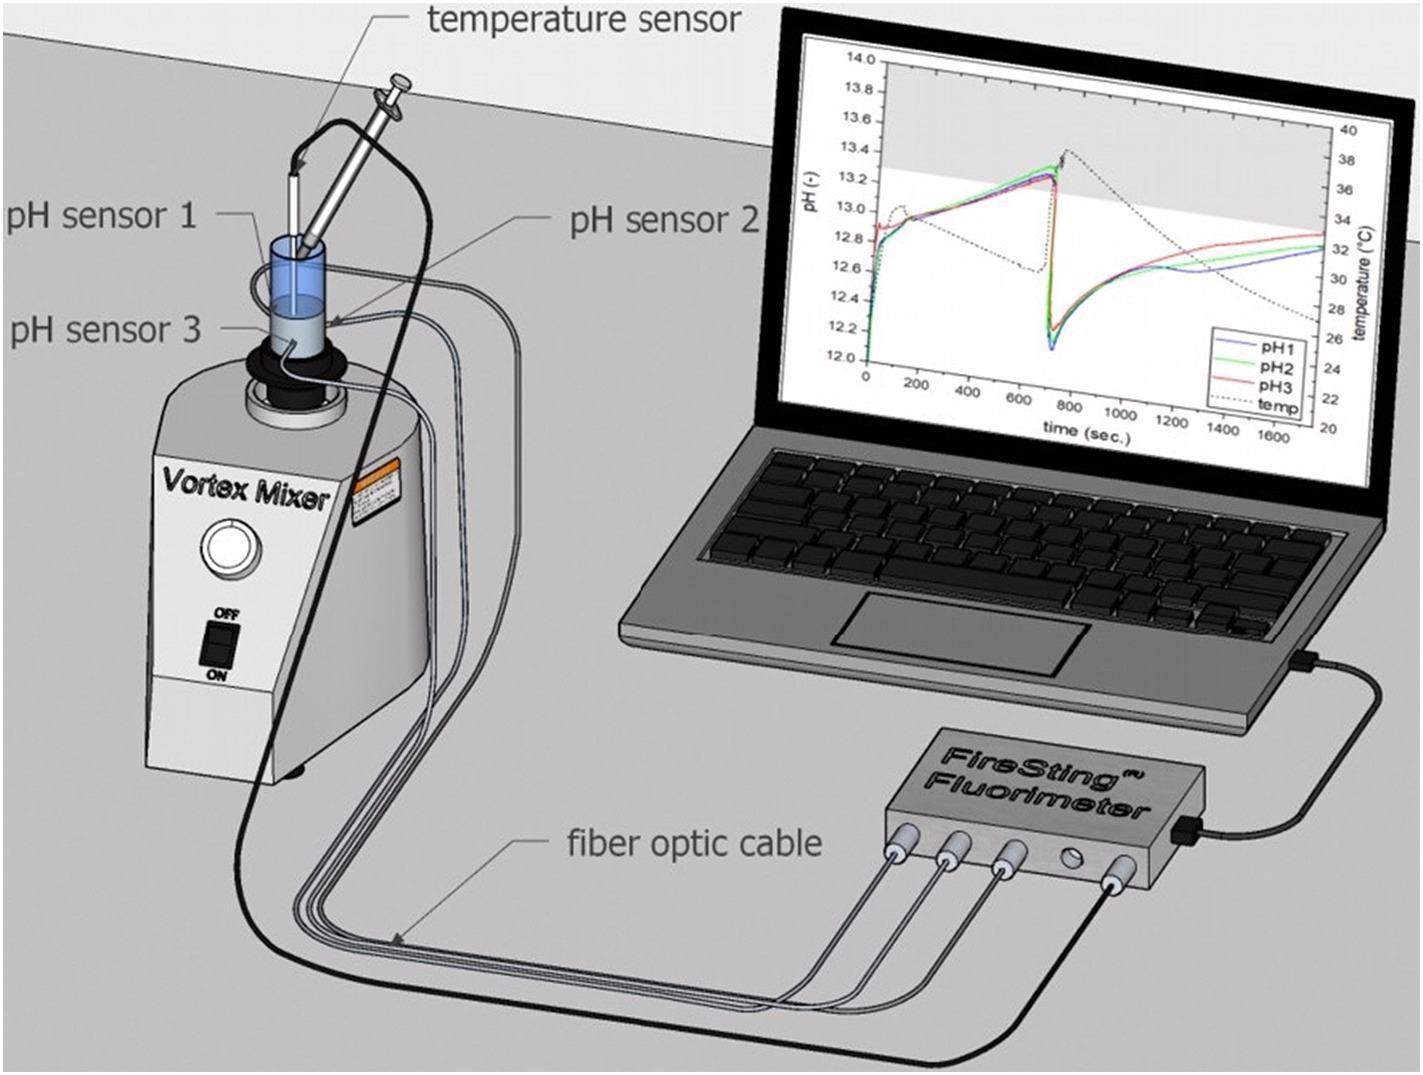
Figure 1. Test setup for continuous pH measurement in paste samples. Figure was drawn with Sketch Up Pro 2021 software tool and integrated 3D warehouse database. Image Credit: Briendl, et al., 2022
Epifluorescence examination (ChemiDoc MP, blue light with 530/28 emission filter, 0.01 second exposure period) and subsequent visualization using Image Lab v5.2 software were used to visualize the accelerator distribution.
Results
The sample homogeneity following accelerator intermixture was critical in the tested systems since the pH values were monitored by ~1 mm2 sensors, which had a limited spatial resolution.
After 8 or 30 seconds of mixing, Figure 2 shows the distribution of the accelerator in samples with 11% accelerator.
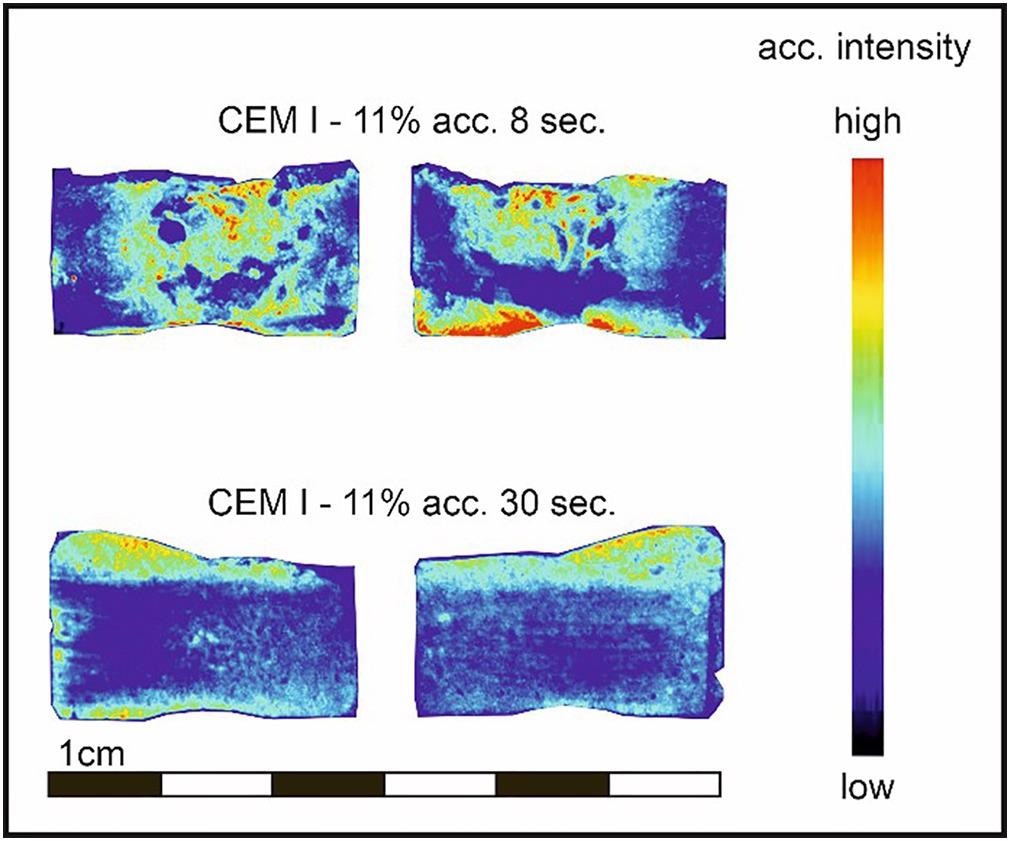
Figure 2. Epifluorescence photographs of CEM I paste samples, produced with 11% accelerator after 8 and 30 seconds of mixing. Fluorescein-Na was added to the accelerator as tracer material. Image Credit: Briendl, et al., 2022
The time-resolved pH development of cement pastes made with CEM I and CEM I SR0 without the accelerator (0–~690 seconds) and with accelerator in the range of 3–20 wt% dose (bwc.) is shown in Figure 3(a–f) and Figure 4(a, b).
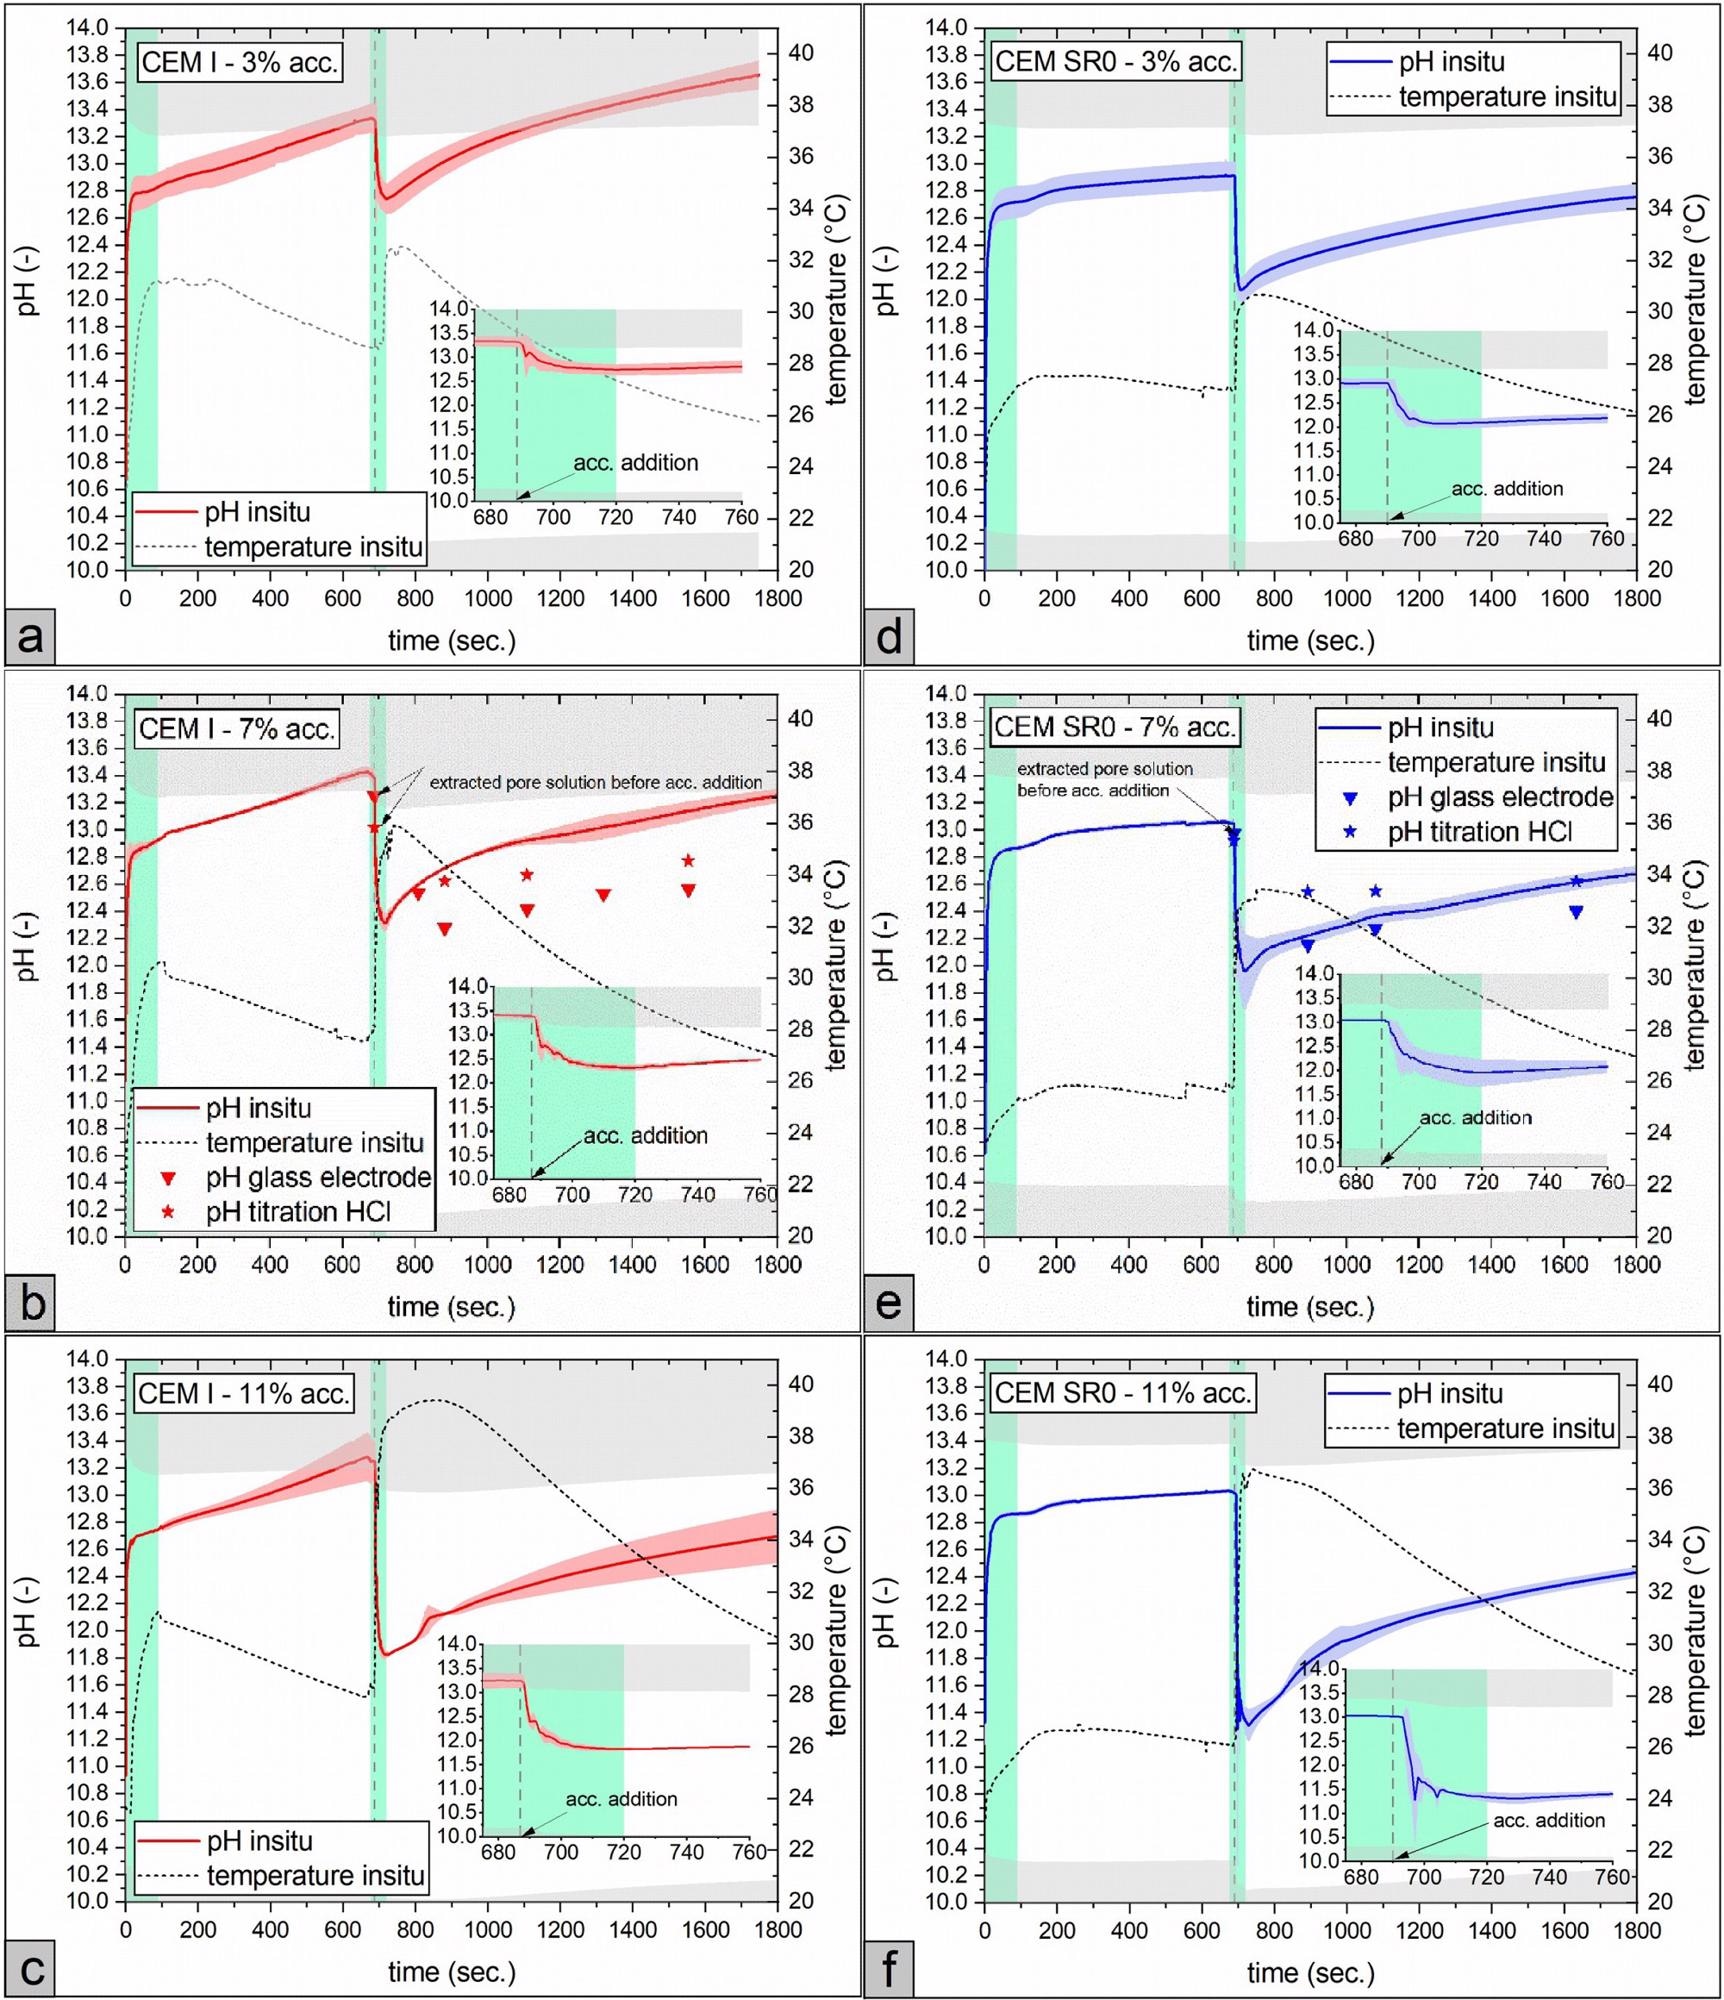
Figure 3. pH and temperature development (bold lines = arithmetic mean (n = 3), colored areas displays the standard deviation) of the pore solution. (a–c): CEM I and (d–f): CEM SR0. Accelerator (acc.) dosage was varied from 3 - 11% bwc. Note that pH values in the grey colored area are out of calibration for the in situ test method. Lime green colored areas display the time spans, when the sample was mixed. For better visibility, the timespan around accelerator addition (675 - 760 seconds after water addition) is additionally augmented in each graph. (For interpretation of the references to color in this figure legend, the reader is referred to the web version of this article.). Image Credit: Briendl, et al., 2022
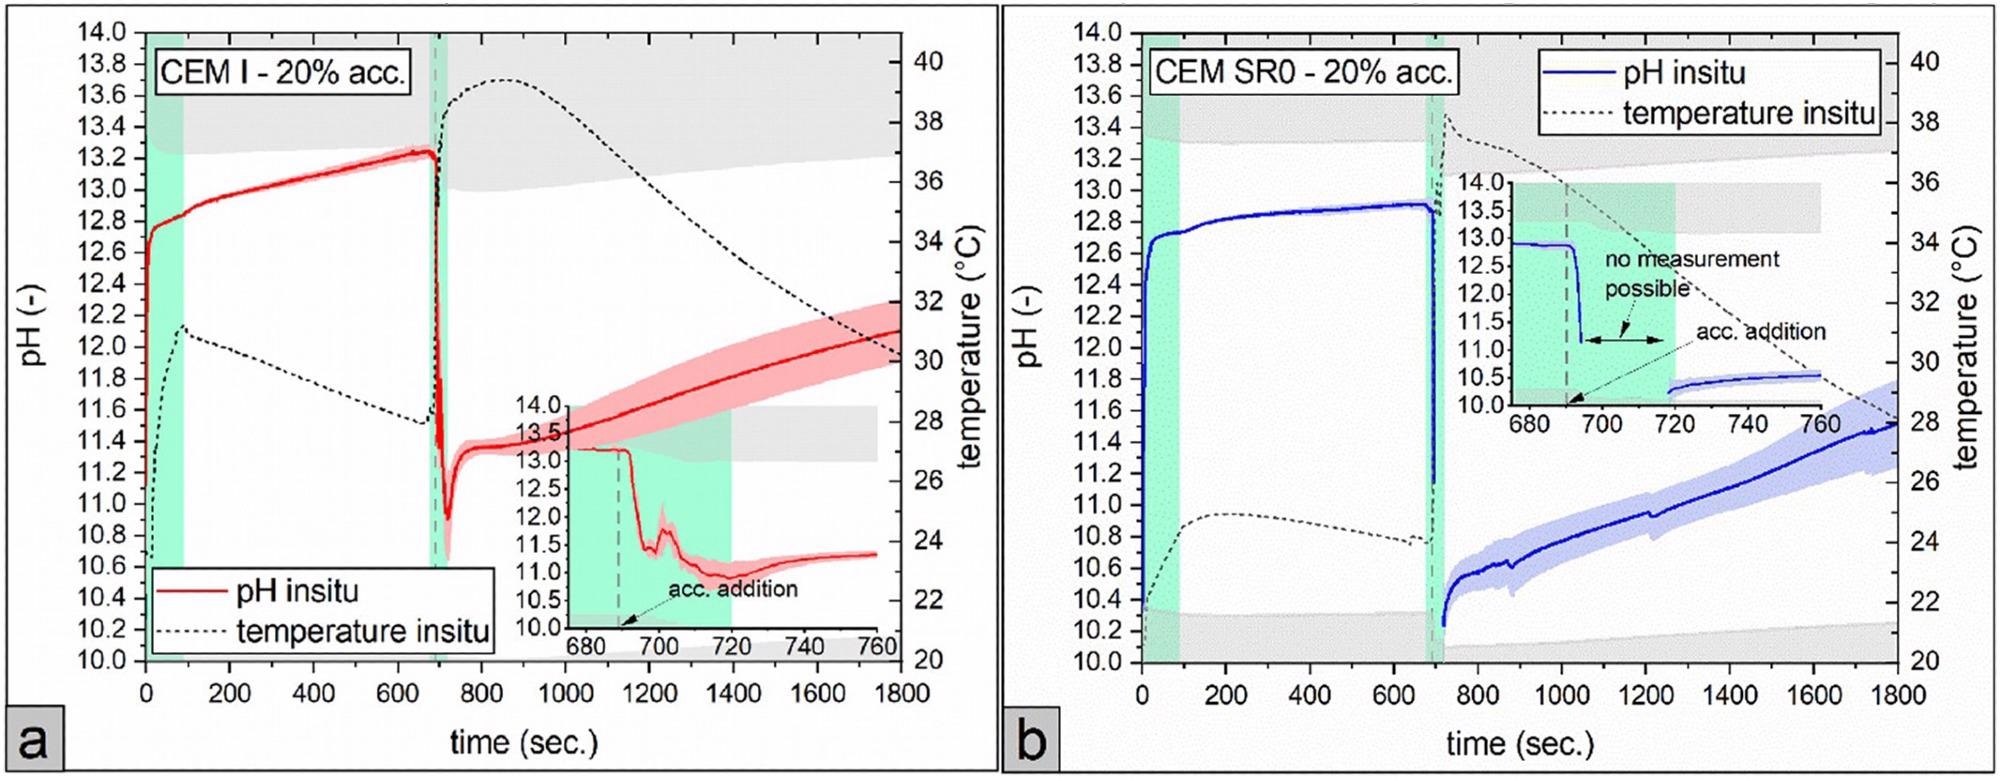
Figure 4. Effect of a high accelerator (acc.) dosage (20% bwc.) on the pH development and sample temperature of a: CEM I and b: CEM SR0. Note that pH values in the grey colored area are out of calibration for the in situ test method. Lime green colored areas displays the time spans, when the sample was mixed. For better visibility, the timespan around accelerator addition (675 - 760 seconds after water addition) is additionally augmented in each graph. (For interpretation of the references to color in this figure legend, the reader is referred to the web version of this article.). Image Credit: Briendl, et al., 2022
The pH values reported by strong acid titration in the CEM I sample were lower than those found by optical measurement; however, they were comparable to or higher in the CEM SR0 sample. Precipitation of hydration products throughout sample preparation of CEM I samples is predicted because samples of both cement types were produced in the same way. Carbonation effects are predicted to be minimal due to the limited time between pore solution extraction and measurement.
Conclusion
Optical in situ measurements were used to explore the influence of an Al2(SO4)3 setting accelerator on the pH development of cementitious systems in this work. Pore solution extraction and subsequent pH studies were done for comparison. As a result of the findings, the following conclusions may be drawn.
In situ pH measurements in accelerated cement pastes at a real water/binder ratio were done for the first time (0.5). The results provide a more thorough understanding of the mechanisms that occur during and after the addition of Al2(SO4)3 setting accelerators to cementitious matrices.
The lower the pH decreased in the initial seconds after the accelerator was mixed, the greater the accelerator dosage. The pH did not drop below the ettringite stability threshold within the range of practical, relevant accelerator doses (~5–10 wt% bwc.). The subsequent rapid breakdown of the cement clinker phases buffered the system, preventing the pore solution’s pH from dropping any further.
The pH values obtained using optical sensors were comparable to those obtained using the traditional method of liquid phase separation under high pressure and subsequent electrochemical potential or titration to evaluate the pH of pore solutions.
A slight change to the system in shotcrete applications where ettringite production regulates the quick setting and early strength development might have negative consequences. As a result, this “simple” technique might be used to forecast and analyze probable deviations or retardation effects from chemical admixtures.
To overcome the existing limits of the proposed sensor system, future research should focus on creating sensor dyes with a pH sensitivity in the region of very high pH values (>13.3). In addition, the invention and application of other types of luminescent sensors for the simultaneous analysis of additional ions in solution (e.g., Ca2+, Na+, etc.) will help in completing the view of the fluid phase in these cementitious systems.
Journal Reference:
Briendla, L. G., Grengg, C., Müller, B., Koraimann, G., Mittermayr, F., Steiner, P. and Galan, I. (2022) In situ pH monitoring in accelerated cement pastes. Cement and Concrete Research, 157, p.106808. Available Online: https://www.sciencedirect.com/science/article/pii/S0008884622000990.
References and Further Reading
- Schöler, A., et al. (2017) Early hydration of SCM-blended Portland cements: a pore solution and isothermal calorimetry study. Cement and Concrete Research, 93, pp. 71–82. doi.org/10.1016/j.cemconres.2016.11.013.
- Briendl, L. G., et al. (2020) Early hydration of cementitious systems accelerated by aluminium sulphate: effect of fine limestone. Cement and Concrete Research, 134, Article, p. 106069. doi.org/10.1016/j.cemconres.2020.106069.
- Bellmann, F & Ludwig, H M (2017) Analysis of aluminum concentrations in the pore solution during hydration of tricalcium silicate. Cement and Concrete Research, 95, pp. 84–94. doi.org/10.1016/j.cemconres.2017.02.020.
- Zhuang, S & Wang, Q (2021) Inhibition mechanisms of steel slag on the early-age hydration of cement. Cement and Concrete Research, 140, p. 106283. doi.org/10.1016/j.cemconres.2020.106283.
- Juilland, P., et al. (2010) Dissolution theory applied to the induction period in alite hydration. Cement and Concrete Research, 40, pp. 831–844. doi.org/10.1016/j.cemconres.2010.01.012.
- Damidot, D., et al. (2008) Modelling the effect of electrolytes on the rate of early hydration of tricalcium silicate. 1st International Conference on Microstructure Related Durability of Cementitious Composites RILEM proceedings PRO.
- Brown, P W & Bothe, J V (1993) The stability of ettringite. Advances in Cement Research, 5, pp. 47–63. doi.org/10.1680/adcr.1993.5.18.47.
- Lothenbach, B & Winnefeld, F (2006) Thermodynamic modelling of the hydration of Portland cement. Cement and Concrete Research, 36, pp. 209–226. doi.org/10.1016/j.cemconres.2005.03.001.
- Austrian Building Technology Association (ÖBV) (2013) Guideline: Sprayed Concrete, Vienna.
- Prudêncio Jr. L R (1998) Accelerating admixtures for shotcrete. Cement and Concrete Research, 20, pp. 213–219. doi.org/10.1016/S0958-9465(98)80007-3.
- Paglia, C., et al. (2001) The influence of alkali-free and alkaline shotcrete accelerators within cement systems: I. Characterization of the setting behaviour. Cement and Concrete Research, 31, pp. 913–918. doi.org/10.1016/S0008-8846(01)00509-9.
- Salvador, R. P., et al. (2016) Early age hydration of cement pastes with alkaline and alkali-free accelerators for sprayed concrete. Construction and Building Materials, 111, pp. 386–398. doi.org/10.1016/j.conbuildmat.2016.02.101.
- Stefanoni, M., et al. (2014) Effects of calcium-carbonate-based aggregates on alkali-free accelerators. Advances in Cement Research, 26, pp. 194–204. doi.org/10.1680/adcr.13.00041.
- Berodier, E (2015) Impact of the Supplementary Cementitious Materials on the Kinetics and Microstructural Development of Cement Hydration. EPFL – École polytechnique fédérale de Lausanne. https://infoscience.epfl.ch/record/204690?ln=en.
- Teichmann, T (2007) Influence of the Granulometry and the Water Content on the Strength and Structural Integrity of Hardened Cement Paste. Universität Kassel in German.
- Hu, J., et al. (2014) Influence of cement fineness and water-to-cement ratio on mortar early-age heat of hydration and set times. Construction and Building Materials, 50, pp. 657–663. doi.org/10.1016/j.conbuildmat.2013.10.011.
- Ouzia, A & Scrivener, K (2019) The needle model: a new model for the main hydration peak of alite. Cement and Concrete Research, 115, pp. 339–360. doi.org/10.1016/j.cemconres.2018.08.005.
- Xu, Q (2005) Chemical Effect of Setting Accelerators on the Early Hydration of Portland Cement (in german). Bauhaus Universität,Weimar.
- Galan, I., et al. (2021) Continuous optical in-situ pH monitoring during early hydration of cementitious materials. Cement and Concrete Research, 150. doi.org/10.1016/j.cemconres.2021.106584.
- ÖN EN 197-1 (2011) 2011-10-15 Cement - Part 1: Composition, Specifications and Conformity Criteria for Common Cements.
- Rietveld, H. M (1969) A profile refinement method for nuclear and magnetic structures. Journal of Applied Crystallography, 2, pp. 65–71. doi.org/10.1107/S0021889869006558.
- Mittermayr, F., et al. (2013) Evaporation—a key mechanism for the thaumasite form of sulfate attack. Cement and Concrete Research, 49, pp. 55–64. doi.org/10.1016/j.cemconres.2013.03.003.
- Tritthart, J., et al. (1989) Chloride binding in cement II. The influence of the hydroxide concentration in the pore solution of hardened cement paste on chloride binding. Cement and Concrete Research, 19, pp. 683–691. doi.org/10.1016/0008-8846(89)90039-2.
- Staudinger, C., et al. (2019) Near-infrared fluorescent aza-BODIPY dyes for sensing and imaging of pH from the neutral to highly alkaline range. Analyst, 144, pp. 2393–2402. doi.org/10.1039/C9AN00118B.
- Staudinger, C., et al. (2019) Fast and stable optical pH sensor materials for oceanographic applications. Sensors & Actuators, B: Chemical, 282, pp. 204–217. https://doi.org/10.1016/j.snb.2018.11.048.
- Sakoparnig, M., et al. (2021) Durability of clinker reduced shotcrete: Ca2+ leaching, sintering, carbonation & chloride penetration. Cement and Concrete Research, Materials and Structures, 54. doi.org/10.1617/s11527-021-01644-7.
- Traynor, B., et al. Methodology for pH measurement in high alkali cementitious systems. Cement and Concrete Research, 135, p. 106122. doi.org/10.1016/j.cemconres.2020.106122.
- Vollpracht, A., et al. (2016) The pore solution of blended cements : a review. Materials and Structures, 49, pp. 3341–3367. doi.org/10.1617/s11527-015-0724-1.
- Briendl, L. G., et al. (2022) The hydration of fast setting spray binder versus (aluminum sulfate) accelerated OPC. Materials and Structures, 55. doi.org/10.1617/s11527-022-01907-x.
- Leemann, A., et al. (2014) Mitigation of ASR by the use of LiNO3 - characterization of the reaction products. Cement and Concrete Research, 59, pp. 73–86. doi.org/10.1016/j.cemconres.2014.02.003.