To monitor and manage air quality in crowded areas, the development of sensitive and selective environmental gas sensors is critical. Hydrogen sulfide (H2S) s a life-threatening gas produced from natural sources including sulfate-reducing hydrocarbons and the separation of sour gases.
Nanomaterials are implemented as sensing components to sensor devices to improve their effectiveness by allowing for a higher concentration of reactive sites due to their high surface-to-volume ratio.
Perovskite materials, such as those with the general formula AMX3, have seen a lot of research interest in recent years, with “A” representing either an inorganic or organic cation, “B” representing a metal cation, frequently Pb, and “X” representing a halide anion.
In this study, researchers employed the hybrid organic perovskite formamidinium lead bromide (FAPbBr3, where FA+: CH(NH2)2+), a material with excellent optical luminescence, good charge transport, and great sensitivity to specific gas molecules.
Researchers developed a polycrystalline FAPbBr3 as an H2S gas sensor in which the gas-sensitive components are perovskite grains. The device’s electrical conductivity changed by the presence of low quantities of H2S gas.
A solution-based technique was used to make the FAPbBr3 perovskite. The FAPbBr3 nanoparticles are placed on a glass substrate using interdigitated electrodes that have been prefabricated. With a band edge absorption at 580 nm corresponding to a band gap of 2.13 eV, the constructed sensors displayed a robust sensitivity to optical light.
The sensors’ sensitivity and reaction time are examined, and the results show that they have a high sensitivity to H2S, as low as 0.5 ppm, and a quick response time.
Methodology
The Inverse Temperature Crystallization (ITC) method was used to generate small millimeter-sized FAPbBr3 crystals from a 1 M solution of PbBr2/FABr in DMF:GBL (1:1 v/v)
A high-resolution transmission electron microscope (TEM) was used to create high-quality pictures that allowed the assessment of grain size and shape. The FAPbBr3 dispersion was placed on molybdenum grids and allowed to dry for this purpose. Using an Empyrean XRD diffractometer, X-ray diffraction (XRD) was performed, allowing the composition and crystal structure of FAPbBr3 to be determined.
The gas response of the devices was evaluated in a Teflon chamber, with each device mounted on a ceramic stage with an adjustable temperature and a K-type thermocouple monitoring the temperature.
For the gas reaction research, H2S gas was mixed with air utilizing Bronkhorst mass flow and control devices and then injected into the Teflon chamber while sealed. The adsorption of H2S gas on nanoparticles alters the charge distribution on their surfaces, resulting in a change in their electrical conductivity.
Results and Discussion
Figure 1a shows a picture of typical millimeter-sized FAPbB3 crystals before crushing. TEM is used to characterize the grain size and shape of the produced FAPbBr3 grains, as illustrated in Figure 1b. The figure depicts nanometer-sized semicircular grains with an average size of 23 ± 8 nm. XRD is used to show the composition of FAPbBr3, as shown in Figure 1c.
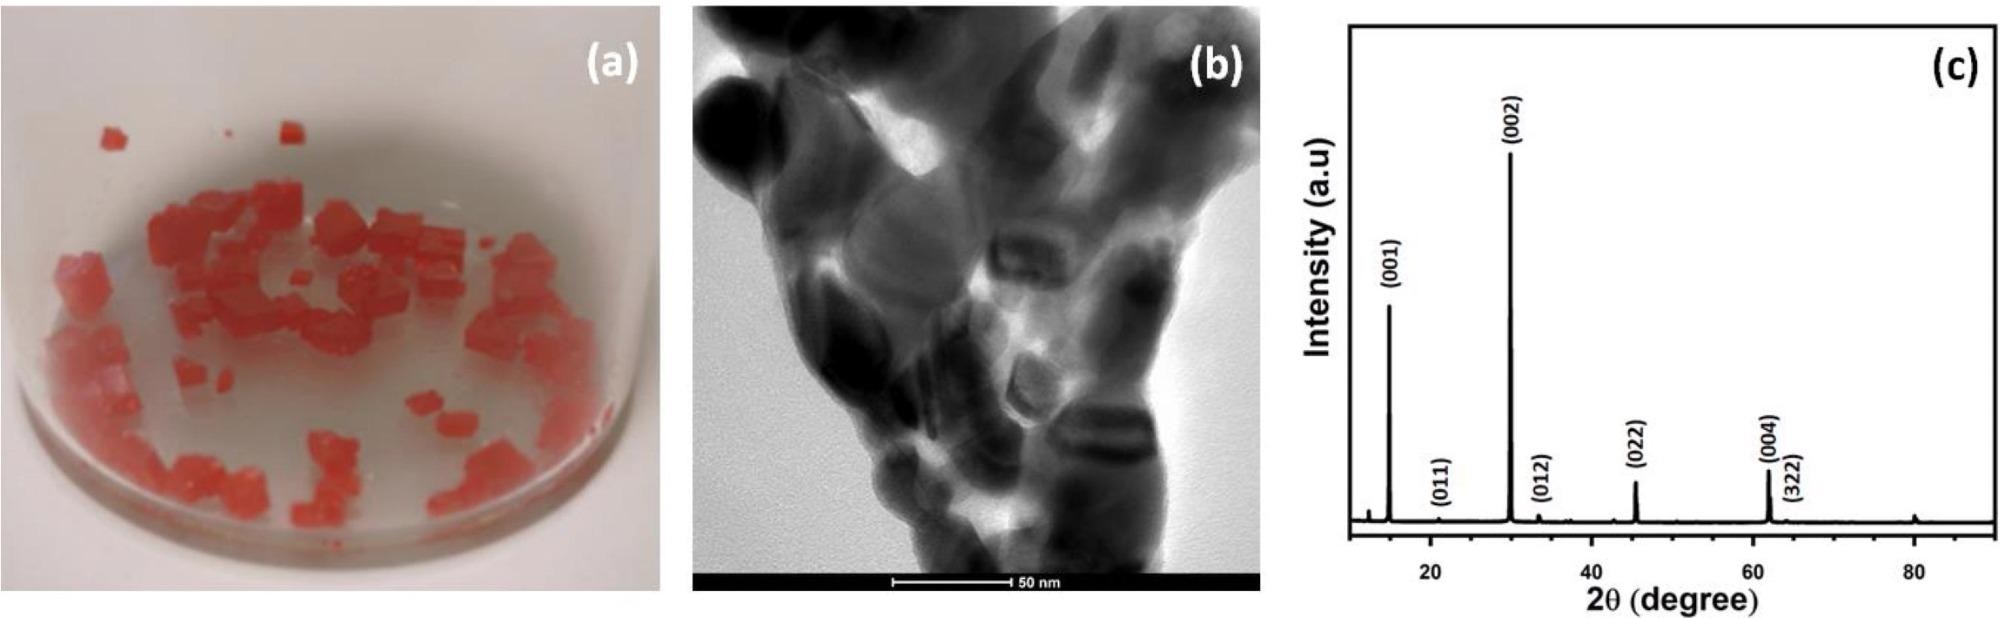
Figure 1. (a) Picture of the synthesized FAPbBr3 grains. (b) TEM image of the crushed FAPbBr3 grains. (c) XRD spectrum of FAPbBr3 with Miller indices on the figure. Image Credit: Ayesh, et al., 2022
The current–voltage characteristics of two FAPbBr3 sensors are shown in Figure 2, with the voltage scanned from −10 V to +10 V. The data on dark current demonstrates some asymmetry among positive and negative voltages, with dark current values of −6 nA and −2 nA for sensors Q1 and Q2, respectively, at −5V.
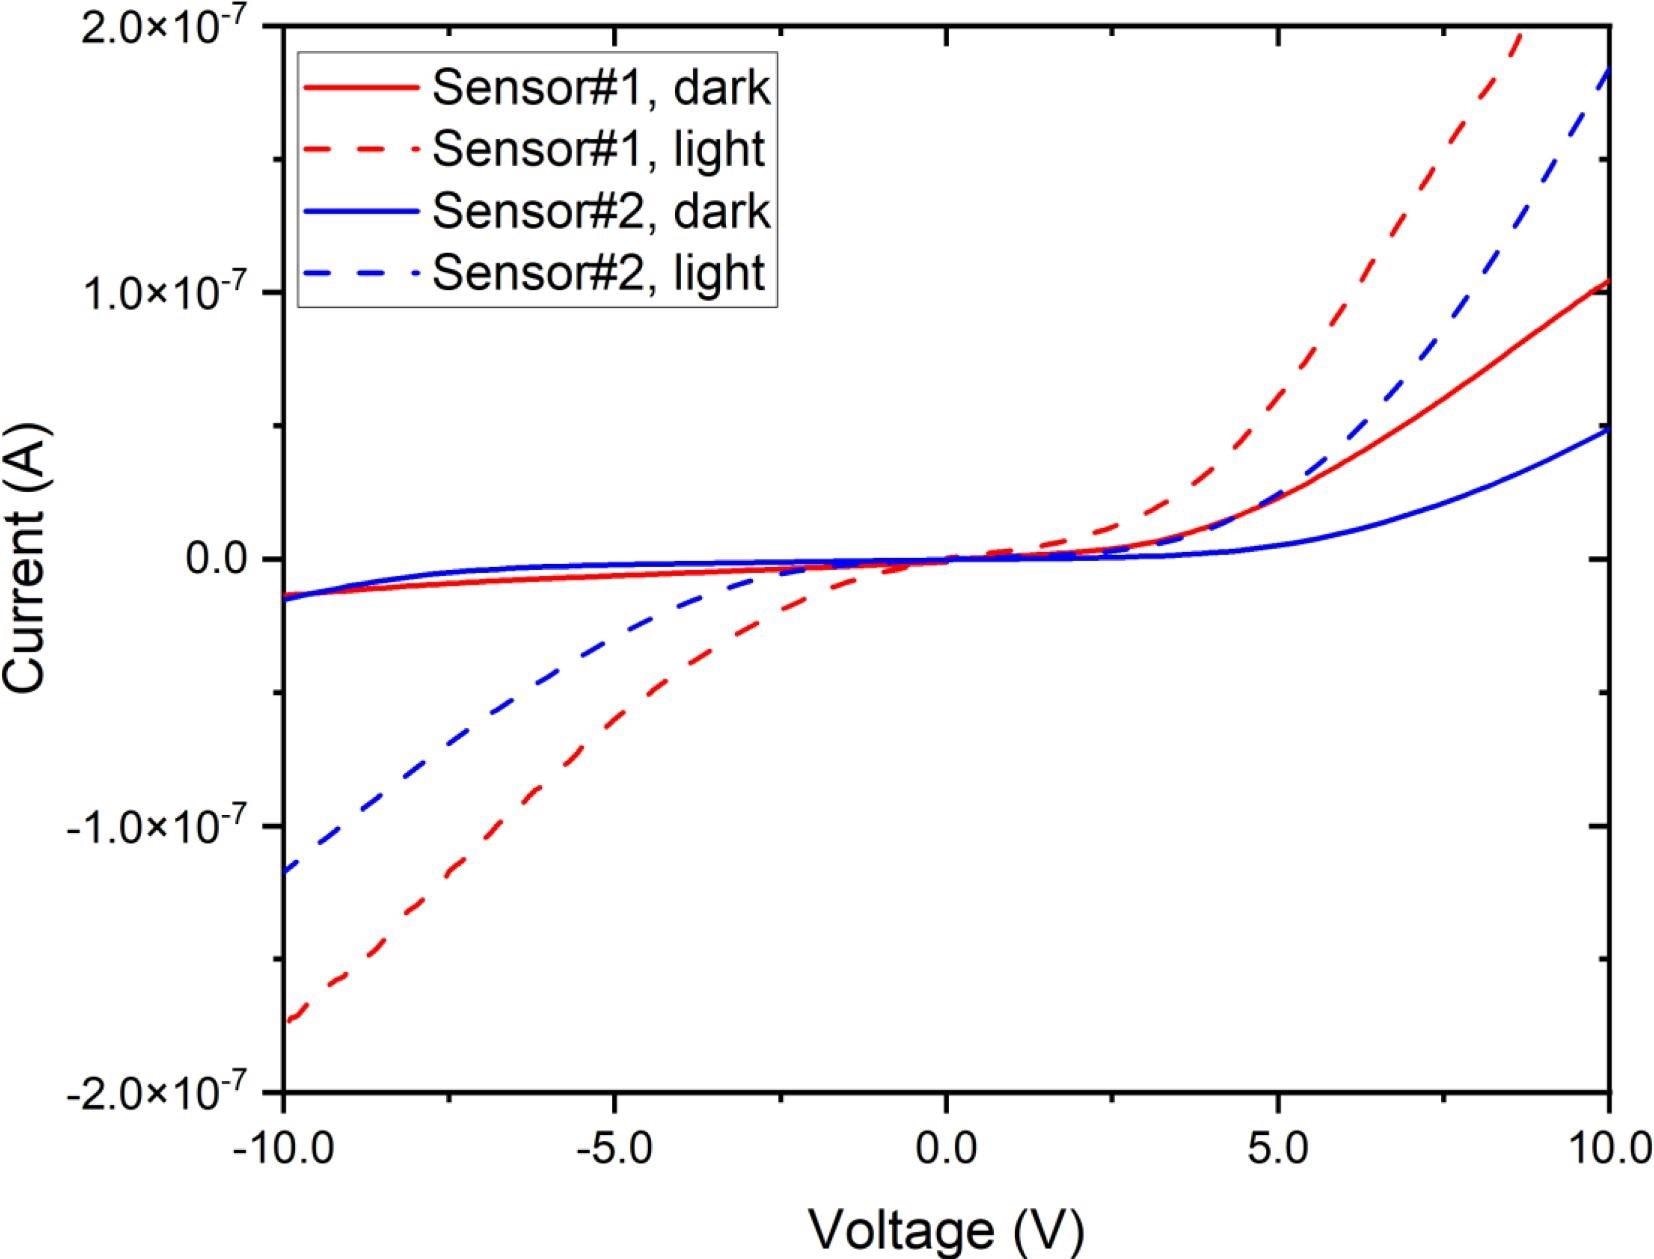
Figure 2. Current voltage characteristics of two FAPbBr3 sensors, acquired in the dark and also under semi-light room conditions. Image Credit: Ayesh, et al., 2022
The optical photocurrent recorded from one FAPbBr3 sensor as a function of wavelength, recorded at various bias voltages, is shown in Figure 3. At a wavelength of 580 nm, the photocurrent response sharply decreases, corresponding to the material bandgap at 2.13 eV.
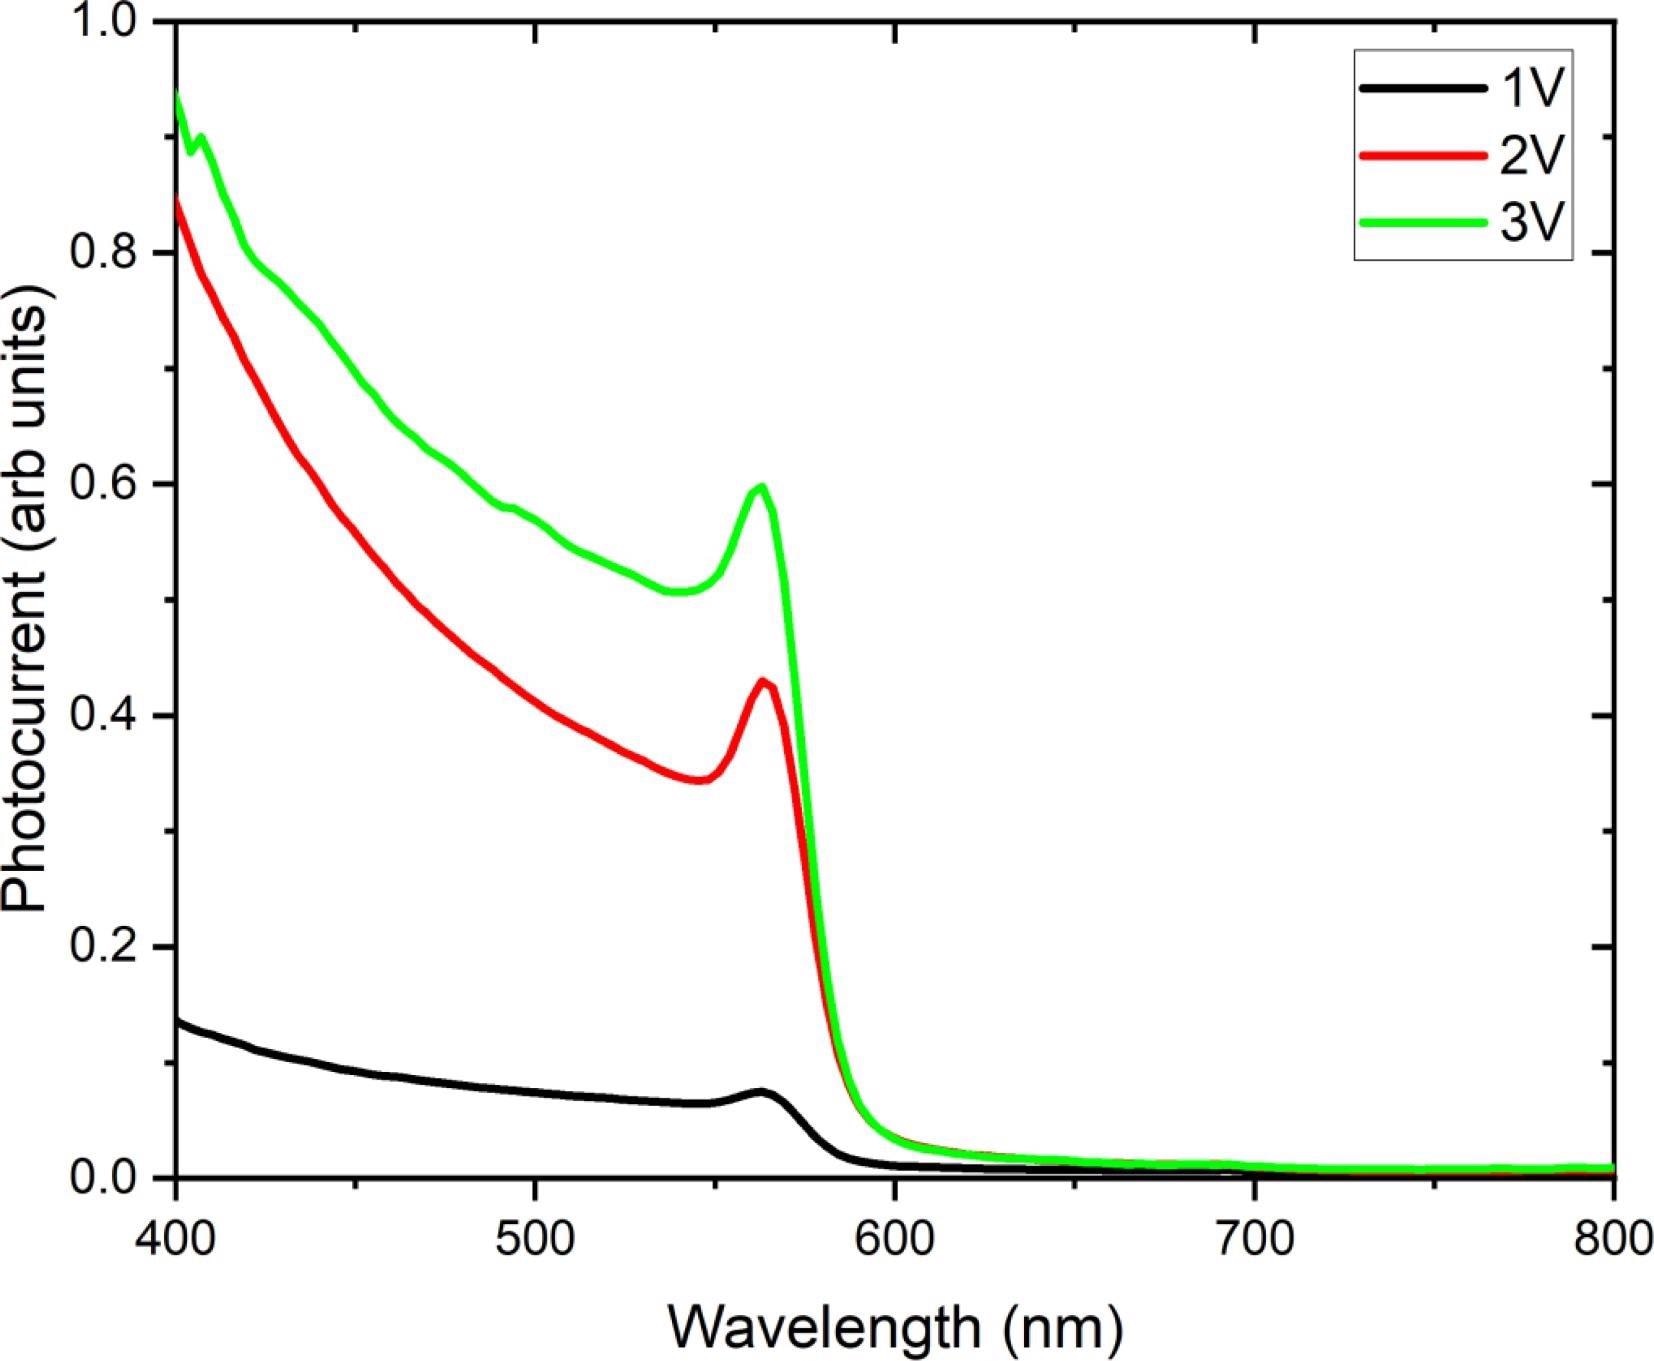
Figure 3. Optical photocurrent measured from one FAPbBr3 sensor as a function of wavelength, acquired under three bias conditions of 1 V, 2 V, and 3 V. The photocurrent response edge at 580 nm corresponds to the material bandgap at 2.13 eV. Image Credit: Ayesh, et al., 2022
At room temperature (∼25 °C), Figure 4a illustrates the sensor gas reaction against H2S gas at various concentrations. Because FAPbBr3 is light-sensitive, the gas response test is performed in the dark (Figure 4b). The sensor’s reaction to H2S gas concentration follows a similar pattern to that seen under semi-light illumination, while the response signal is smaller (the only change of the response is in the intensity upon exposure to light).
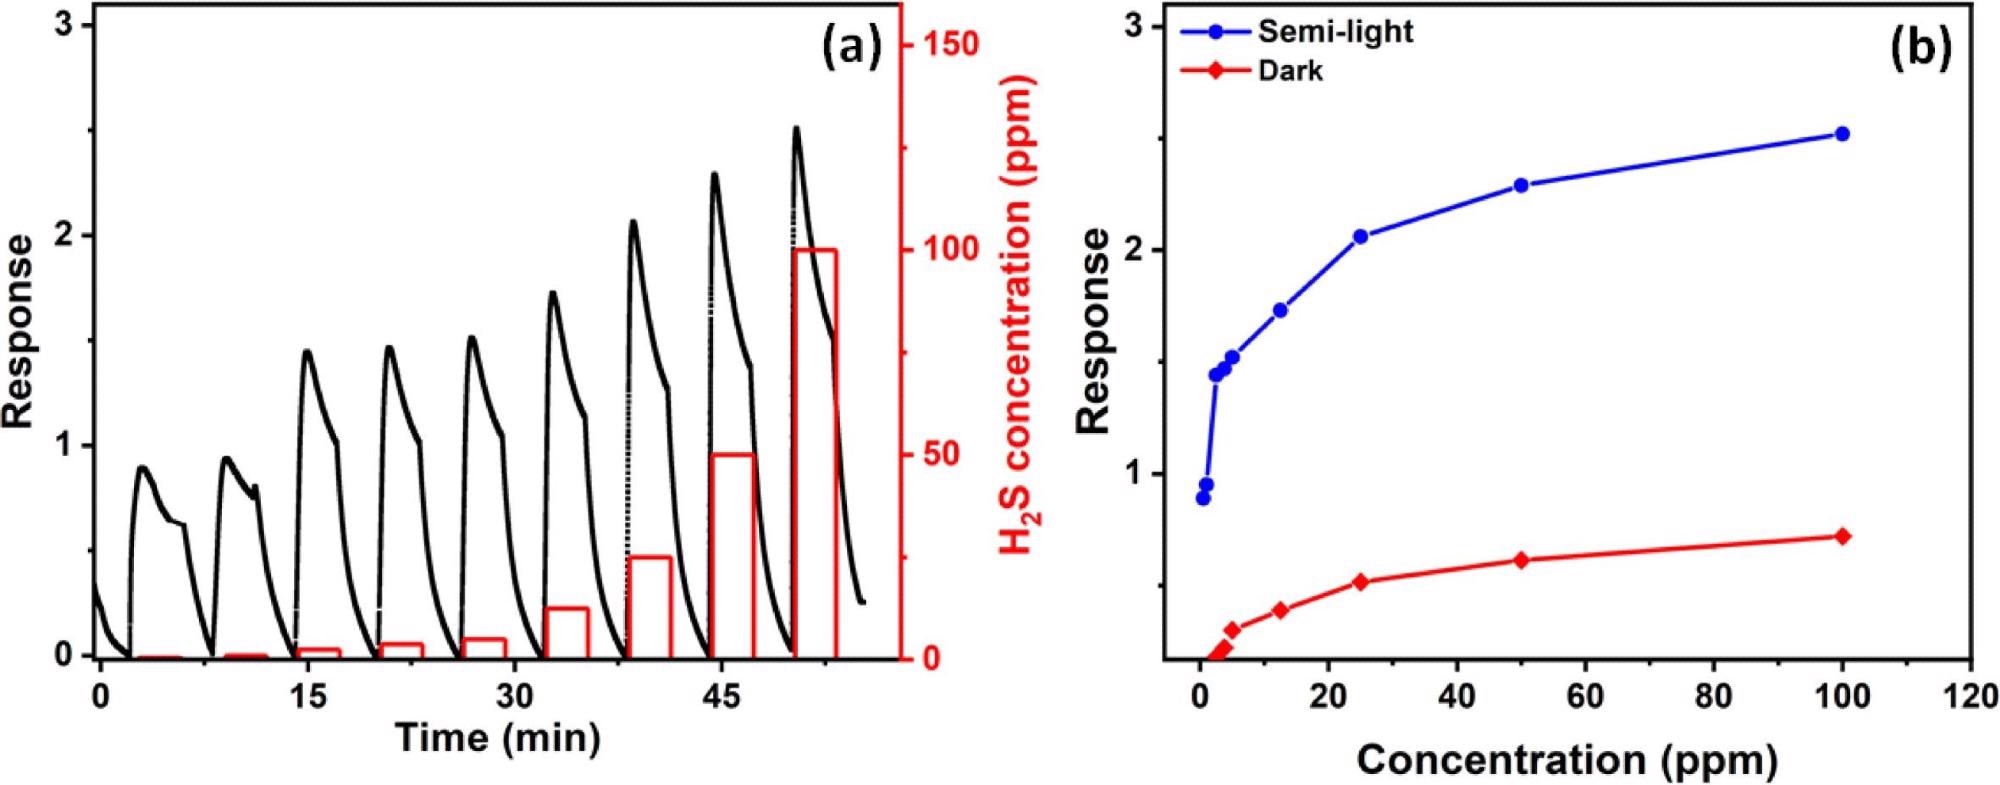
Figure 4. (a) Sensor gas response at different gas concentration while the sensor is inside the Teflon chamber and room light is on. (b) Electrical gas response of the sensor as a function of H2S concentration while room light is on and the dark measurements. Image Credit: Ayesh, et al., 2022
The I(V) characterization that was performed during and after exposure to H2S gas, as shown in Figure 5, supports this process. Due to the suspension of free electron creation, the post-exposure I(V) characteristics exhibit lower conductance than those seen during exposure, as shown in the figure.
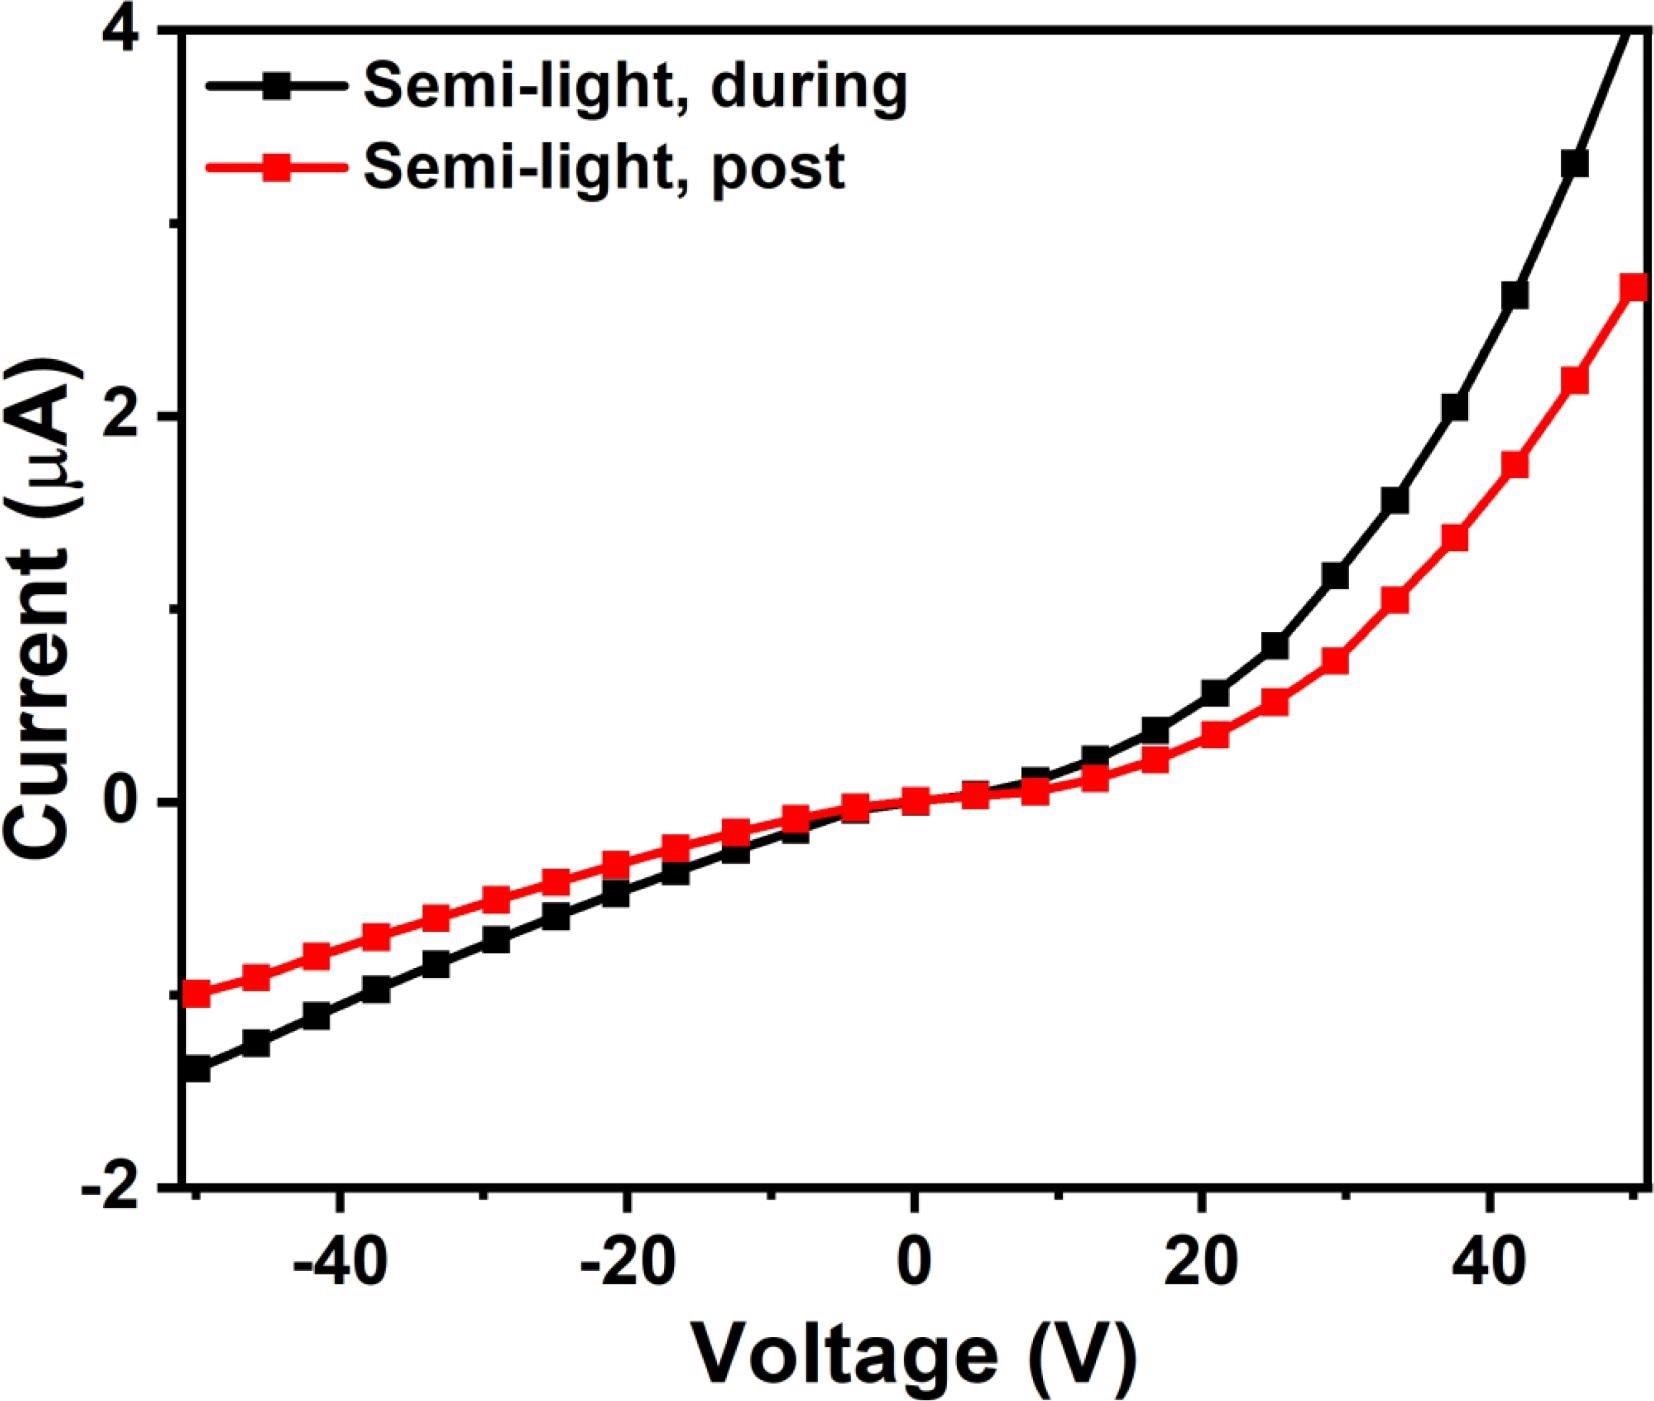
Figure 5. I(V) characterization of FAPbBr3 based sensors during and post exposure to H2S gas. Image Credit: Ayesh, et al., 2022
Gas sensor stability is a crucial test for determining a gas sensor’s suitability for several operating cycles. As shown in Figure 6, the fabricated sensors are evaluated for stability and reversibility for 10 cycles against 10 ppm at 25 °C. The reaction time of the sensors as a result of H2S concentration is shown in Figure 6b for both semi-light and dark instances.
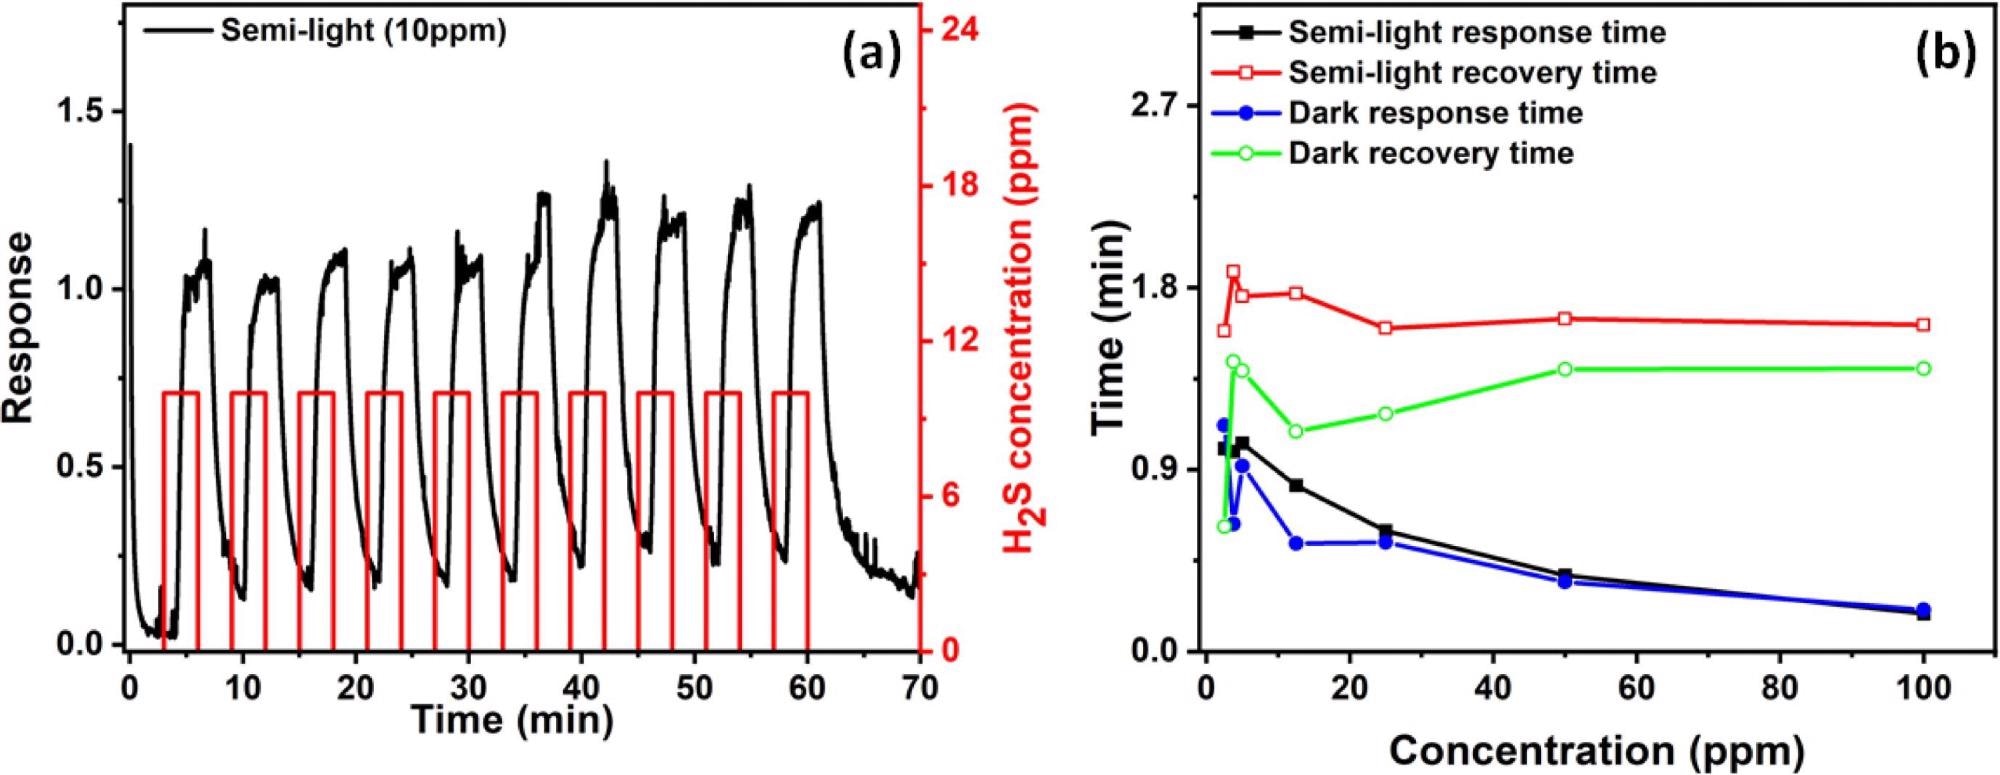
Figure 6. (a) Gas response stability test at 10 ppm of H2S performed at room temperatures. (b) Response and recovery times of the sensor for both semi-light and dark cases. Image Credit: Ayesh, et al., 2022
The figure shows that for varying H2S concentrations, the recovery time is nearly consistent, with average values of 1.6 minutes for semi-light and 1.4 minutes for dark. The dark case’s faster recovery time might be owing to a smaller concentration of photo-generated free electrons. When it comes to safety applications, however, the sensor’s reaction time is a more essential consideration.
Table 1 compares the performance of the current sensor to that of recently reported sensors.
Table 1. Response of recently reported H2S sensors based on perovskites. Source: Ayesh, et al., 2022
| Material |
Response |
Temperature (°C) |
Reference |
| FAPbBr3 |
0.5 |
25 |
Current work |
| hexagonal YMnO3 |
20 |
100 |
[29] |
| NbWO6 |
0.5 |
150 |
[30] |
| ZnO- La0.8Sr0.2FeO3 |
4 |
200 |
[31] |
| Pd-La0.7Pb0.3Fe0.4Ni0.6O3 |
150 |
200 |
[32] |
As a result, when compared to stated values for similar systems for H2S sensors, the constructed sensors have a faster reaction time.
Conclusion
Perovskite nanoparticles of metal halide perovskite formamidinium lead bromide were used to make high-sensitivity conductometric H2S gas sensors (FAPbBr3). A solution-growth approach was used to make the nanoparticles.
The nanoparticles have a cubic shape with an average size of 23 ± 8 nm. FAPbBr3 has a bandgap of 2.13 eV, according to photocurrent experiments. Under ambient room circumstances, the sensors showed remarkable sensitivity to H2S, with readings as low as 0.5 ppm.
The sensors worked in both dark and semi-light situations, with a higher response in semi-light due to the photosensitivity of the nanoparticles. Sensors are also reliable for several test cycles, with minimal response and recovery times of 0.2 and 0.6 minutes, respectively, and low power consumption because the sensor does not need to be heated. As a result, sensors might be regarded suitable for prototype applications.
Journal Reference:
Ayesh, A.I., Alghamdi, S.A., Salah, B., Bennett, S.H., Crean, C., and Sellin, P.J. (2022) High sensitivity H2S gas sensors using lead halide perovskite nanoparticles. Results in physics, 35, p.105333. Available Online: https://www.sciencedirect.com/science/article/pii/S2211379722001152.
References and Further Reading
- Ayesh, A I (2021) Effect of CuOx additive site to graphene nanoribbon on its adsorption for hydrogen sulfide. Results in Physics, 24, p. 104199. doi.org/10.1016/j.rinp.2021.104199.
- Kortidis, I., et al. (2019) Detailed understanding on the relation of various pH and synthesis reaction times towards a prominent low temperature H2S gas sensor based on ZnO nanoplatelets. Results in Physics, 12, pp. 2189–2201. doi.org/10.1016/j.rinp.2019.01.089.
- Wang, R (2012) Physiological implications of hydrogen sulfide: a whiff exploration that blossomed. Physiological Review, 92, pp. 791–896. doi.org/10.1152/physrev.00017.2011.
- Haija, M. A., et al. (2017) Characterization of H2S gas sensor based on CuFe2O4 nanoparticles. Journal of Alloys and Compounds, 690, pp. 461–468. doi.org/10.1016/j.jallcom.2016.08.174.
- Abu-Hani, A. F. S., et al. (2017) Design, fabrication, and characterization of low-power gas sensors based on organic-inorganic nano-composite. Organic Electronics, 42, pp. 284–292. doi.org/10.1016/j.orgel.2016.12.050.
- Ayesh, A. I., et al. (2016) Selective H2S sensor based on CuO nanoparticles embedded in organic membranes. Sensors and Actuators B: Chemical, 231, pp. 593–600. doi.org/10.1016/j.snb.2016.03.078.
- Ayesh, A, I (2016) Metal/metal-oxide nanoclusters for gas sensor applications. Journal of Nanomaterials, 2016, pp. 1–17. doi.org/10.1155/2016/2359019.
- Ayesh, A. I., et al. (2017) Spinel ferrite nanoparticles for H2S gas sensor. Applied Physics A, 123, p. 682. doi.org/10.1007/s00339-017-1305-7.
- Ayesh, A I (2016) Linear hydrogen gas sensors based on bimetallic nanoclusters. Journal of Alloys and Compounds, 689, pp. 1–5. doi.org/10.1016/j.jallcom.2016.07.320.
- Rosenberg, M., et al. (1991) Reproducibility and sensitivity of oral malodor measurements with a portable sulphide monitor. Journal of Dental Research, 70, pp. 1436–1440. doi.org/10.1177%2F00220345910700110801.
- Moradi, Z., et al. (2018) Nanocomposite perovskite based optical sensor with broadband absorption spectrum. Sensors and Actuators A, 280, pp. 47–51. doi.org/10.1016/j.sna.2018.07.033.
- Comini, E., et al. (2002) Stable and highly sensitive gas sensors based on semiconducting oxide nanobelts. Applied Physics Letters, 81, pp. 1869–1871. doi.org/10.1063/1.1504867.
- Gaidi, M (2018) Nanostructured SnO2 thin films: effects of porosity and catalytic metals on gas-sensing sensitivity. Applied Physics A, 124, p. 725. doi.org/10.1007/s00339-018-2111-6.
- Bibi, I., et al. (2021) Structural, electrochemical and photocatalytic properties of zinc doped Co1-xZn1. 5xFeO3 perovskites prepared by auto combustion sol–gel approach. Results in Physics, 26, p. 104392. doi.org/10.1016/j.rinp.2021.104392.
- Zhu, Z., et al. (2018) Metal halide perovskites: stability and sensing-ability. Journal of Materials Chemistry C, 6(38), pp. 10121–10137. doi.org/10.1039/C8TC03164A.
- Zhuang, Y., et al. (2017) High-performance gas sensors based on a thiocyanate ion-doped organometal halide perovskite. Physical Chemistry Chemical Physics, 19(20), pp. 12876–12881. doi.org/10.1039/C7CP01646H.
- Maity, A., et al. (2019) High sensitivity NH 3 gas sensor with electrical readout made on paper with perovskite halide as sensor material. Scientific Reports, 9, pp. 1–10. doi.org/10.1038/s41598-019-43961-6.
- Stoeckel, M. A., et al. (2017) Reversible, fast, and wide-range oxygen sensor based on nanostructured organometal halide perovskite. Advance Materials, 29(38), p. 1702469. doi.org/10.1002/adma.201702469.
- Lee, K.Y., et al. (2021) Ultrasensitive detection of hydrogen sulfide gas based on perovskite vertical channel chemo-sensor. Sensors and Actuators B: Chemical, 326, p. 128988. doi.org/10.1016/j.snb.2020.128988.
- Saidaminov, M. I., et al. (2015) Retrograde solubility of formamidinium and methylammonium lead halide perovskites enabling rapid single crystal growth. Chemical Communications, 51(100), pp. 17658–17661. doi.org/10.1039/C5CC06916E.
- Ayesh, A. I., et al, (2019) Production of sensitive gas sensors using CuO/SnO 2 nanoparticles. Applied Physics A, 125, p. 550. doi.org/10.1007/s00339-019-2856-6.
- Haija, M. A., et al. (2020) Fabrication of H 2 S gas sensors using Zn x Cu 1–x Fe 2 O 4 nanoparticles. Applied Physics A, 126, pp. 1–9. doi.org/10.1007/s00339-020-03661-9.
- Ayesh, A. I., et al. (2020) Production of flexible nanocomposite membranes for x-ray detectors. Applied Surface Science, 528, p. 146958. doi.org/10.1016/j.apsusc.2020.146958.
- Haija, M. A., et al. (2016) Selective hydrogen gas sensor using CuFe2O4 nanoparticle based thin film. Applied Surface Science, 369, pp. 443–447. doi.org/10.1016/j.apsusc.2016.02.103.
- Zhang, F., et al. (2018) Formamidinium Lead Bromide (FAPbBr 3) Perovskite Microcrystals for Sensitive and Fast Photodetectors. National Natural Science Foundation, 10, p. 43. doi.org/10.1111/tgis.12294.
- Ma, D., et al. (2020) Multichannel Room-Temperature Gas Sensors Based on Magnetic-Field-Aligned 3D Fe3O4@SiO2@Reduced Graphene Oxide Spheres. ACS Applied Materials & Interfaces, 12, pp. 37418–37426.
- Salih, E & Ayesh, A I (2020) DFT investigation of H2S adsorption on graphenenanosheets and nanoribbons: Comparative study. Superlattices and Microstructures, 146, p. doi.org/10.1016/j.spmi.2020.106650.
- Salih, E & Ayesh, A I (2021) Computational study of metal doped graphene nanoribbon as a potential platform for detection of H2S, Materials Today. Communications, 26, p. 101823. doi.org/10.1016/j.mtcomm.2020.101823.
- Balamurugan, C & Lee, D W (2015) Perovskite hexagonal YMnO3 nanopowder as p–type semiconductor gas sensor for H2S detection. Sensors and Actuators B, 221, pp. 857–866. doi.org/10.1016/j.snb.2015.07.018.
- Wang, J., et al. (2022) Ultrathin 2D NbWO6 Perovskite Semiconductor Based Gas Sensors with Ultrahigh Selectivity under Low Working Temperature. Advance Materials, 34(2), p. 2104958. doi.org/10.1002/adma.202104958.
- Syue, Y. K. et al. (2022) Characteristics and gas sensor applications of ZnO-Perovskite heterostructure. Ceramics International, doi.org/10.1016/j.ceramint.2022.01.126.
- Jagtap, S., et al. (2008) Chaudhari, H2S sensing characteristics of La0. 7Pb0. 3Fe0. 4Ni0. 6O3 based nanocrystalline thick film gas sensor, Sensors and Actuators B: Chemical, 131, pp. 290–294. doi.org/10.1016/j.snb.2007.11.021.
- Shipway, A. N., et al. (2000) Nanoparticle arrays on surfaces for electronic, optical, and sensor applications. ChemPhysChem, 1(1), pp. 18–52. doi.org/10.1002/1439-7641(20000804)1:1%3C18::AID-CPHC18%3E3.0.CO;2-L.
- Frey, G. L., et al. (1999) Raman and resonance Raman investigation of MoS 2 nanoparticles. Physical Review B, 60, p. 2883. doi.org/10.1103/PhysRevB.60.2883.
- Ayesh, A. I., et al. (2018) Selective gas sensors using graphene and CuO nanorods. Sensor Actuators, A, 283, pp. 107–112. doi.org/10.1016/j.sna.2018.09.068.
- Haija, M. A., et al. (2019) Adsorption and gas sensing properties of CuFe2O4 nanoparticles. Materials Science-Poland, 37, pp. 289–295. doi.org/10.2478/msp-2019-0020.
- Zhu, L & Zeng, W (2017) Room-temperature gas sensing of ZnO-based gas sensor: A review. Sensor Actuators, A, 267, pp. 242–261. doi.org/10.1016/j.sna.2017.10.021.