Sponsored by TOFWERKReviewed by Emily MageeMar 22 2023
Chemical ionization mass spectrometers can accurately examine VOCs in a variety of conditions. However, the analysis becomes murky when a compound is masked by either an isomeric or an isobaric interference. Since there is no conclusive measurement of the structures contributing to a mass spectrum peak, interferences inject ambiguity into identifying the peak.
In flavor and fragrance chemistry, for instance, this is a frequent problem where a single molecular formula (ion) could be present in multiple isomeric forms. Since each ion contributes differently to how flavor or fragrance is perceived, they are all significant.
Methyl salicylate and methyl paraben, two vanillin isomers, are shown in Figure 1. Mass spectrometry requires an additional separation dimension to separate and distinguish between these isomers.
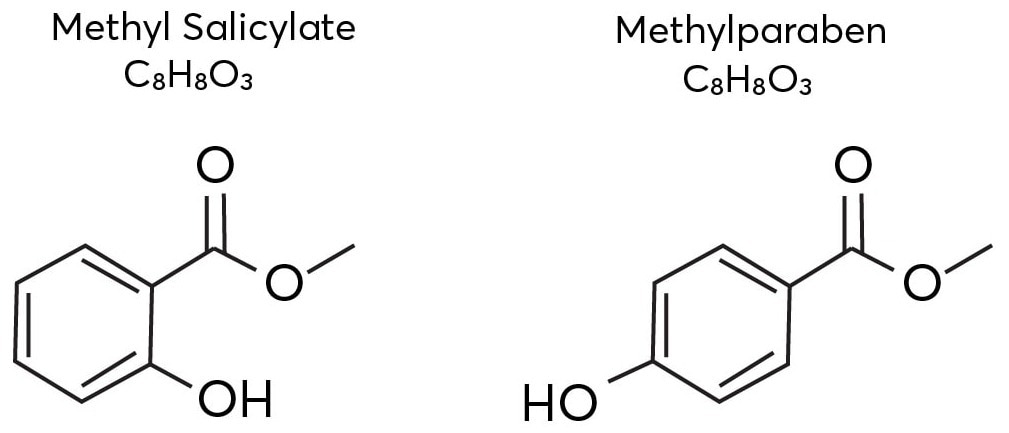
Figure 1. The isomeric structures of methyl salicylate and methylparaben. Image Credit: TOFWERK
Ion mobility spectrometry (IMS) is a method that can be combined with mass spectrometry when it is required to differentiate separate isomers. Ions that adopt configurations with different rotationally averaged collision cross sections (i.e. average molecular size) can be distinguished by IMS.
Chemical ionization is used to ionize the analytes in Vocus IMS-MS, and the resultant ions are separated by their collision cross sections before mass analysis. The mass-to-charge ratio and cross section-related IMS are provided as two-dimensional data. Several isomeric or isobaric components present in a single mass spectra peak are deconvoluted in this way.
Operation of the Vocus CI-IMS-TOF
The Vocus CI-IMS-TOF schematic from TOFWERK is shown in Figure 2. Ions are produced by the Vocus ion source in this device and then directed into the IMS separation chamber.
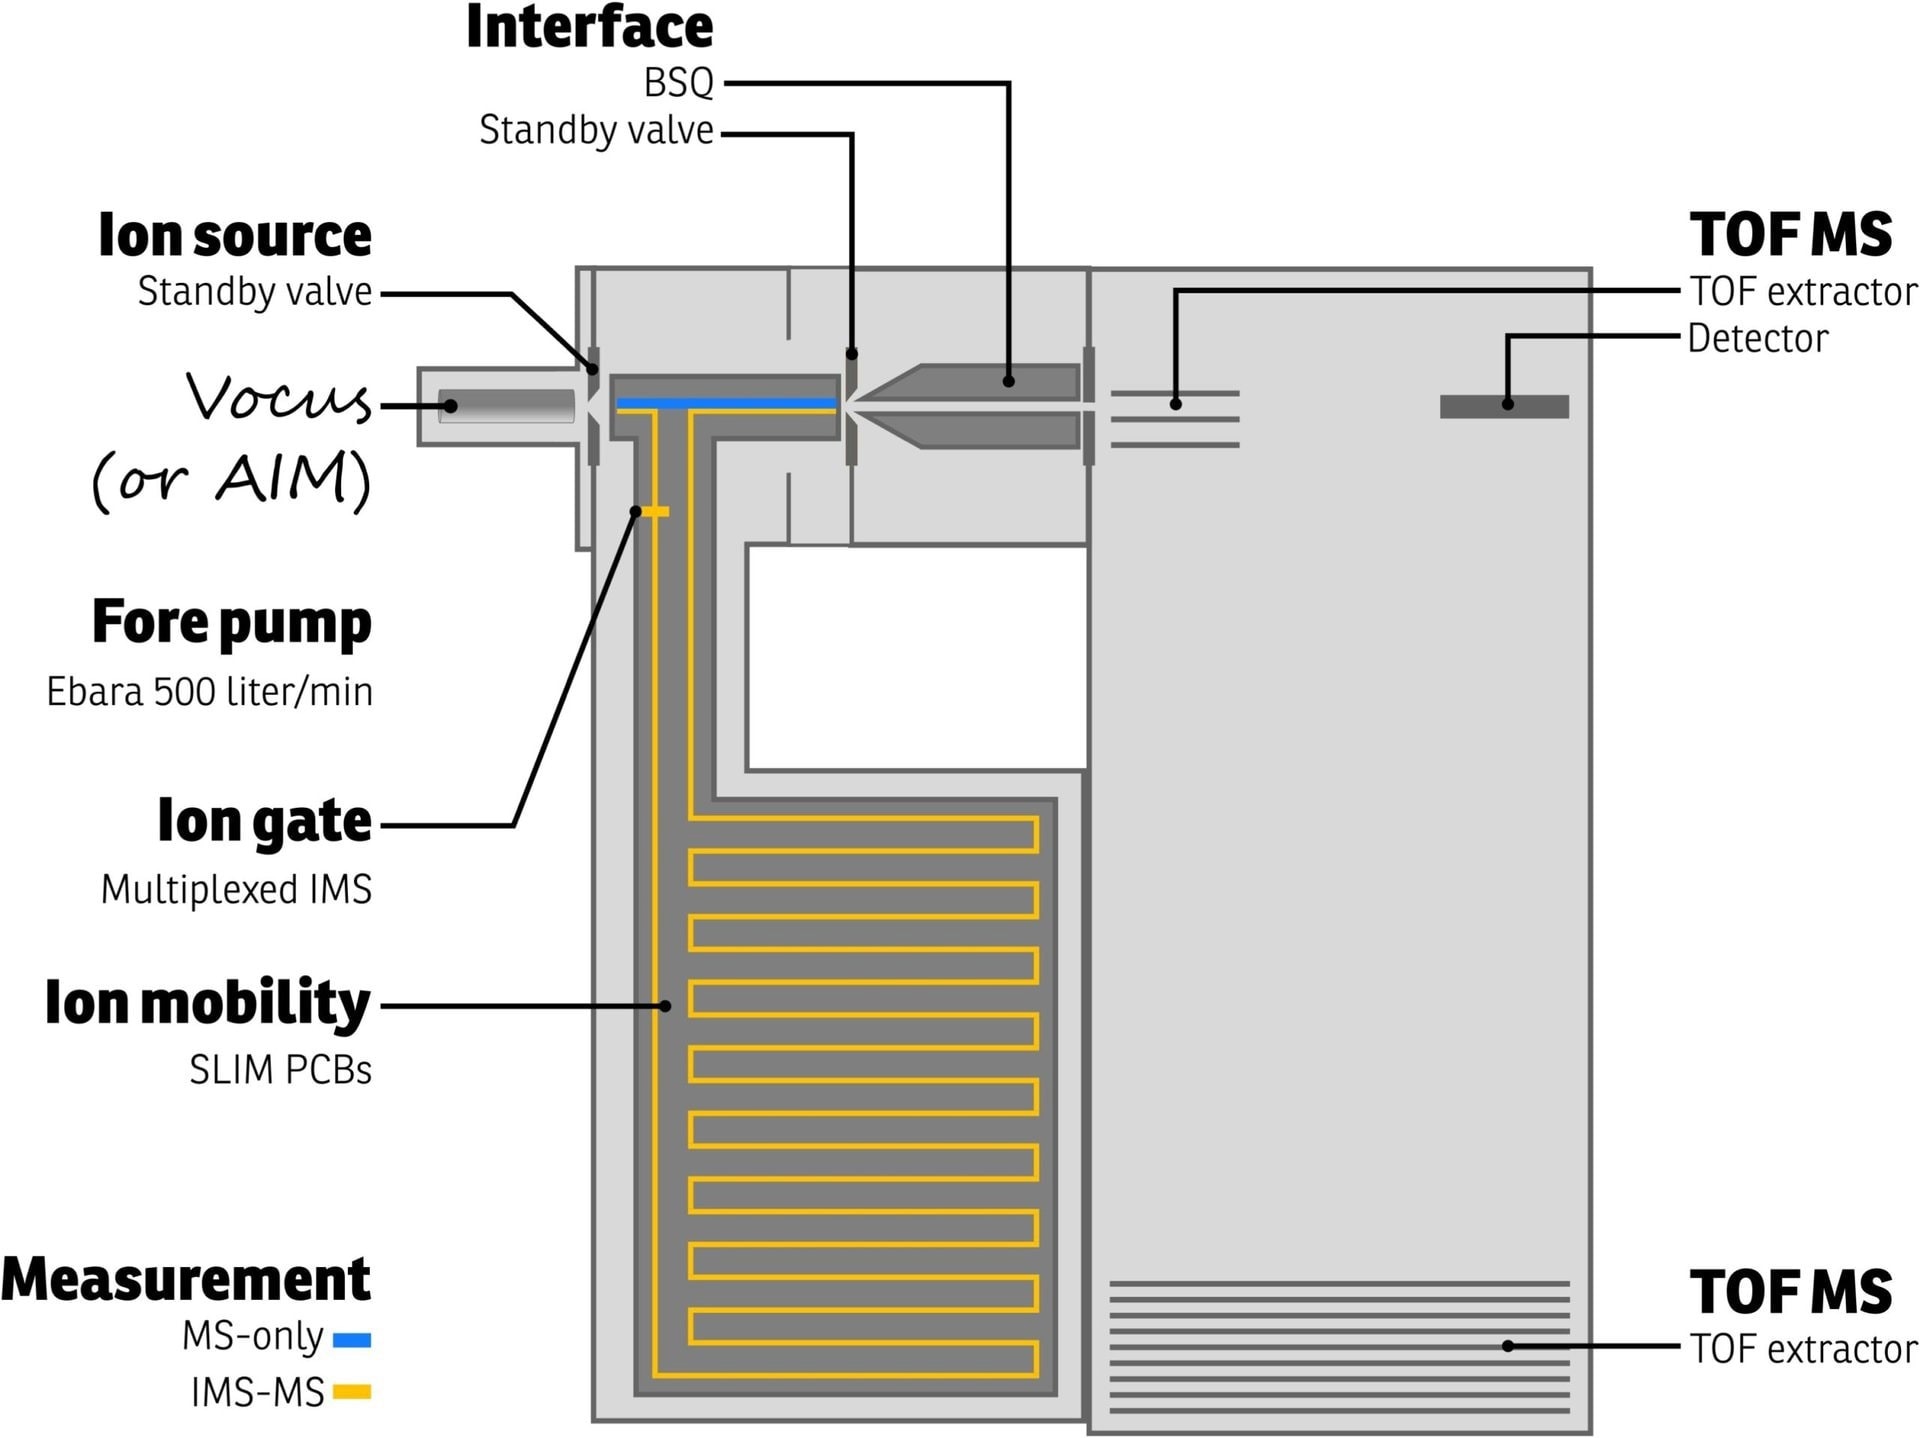
Figure 2. Schematic representation of the TOFWERK Vocus-IMS-TOF instrument. Both MS-only and IMS-MS measurements are possible as indicated by the blue and orange ion paths, respectively. Image Credit: TOFWERK
The chamber is kept at a pressure of 3 bar and is purged with an inert buffer gas (such as nitrogen, helium, etc.). Utilizing technology created at Pacific Northwest National Laboratory for lossless ion manipulations (SLIM), the ions are moved along a 9-meter serpentine route.1 Weak electric fields are used to regulate the flow of ions.
Ions with smaller collision cross sections experience less resistance as they move through the buffer gas and reach the drift region’s end faster than ions with larger collision cross sections. The IMS drift time, which is connected to the collision cross section of a molecule, refers to the total length of time an ion travels through the IMS drift zone.
The TOFWERK Vocus CI-IMS-TOF offers two modes of operation. The first mode enables the user to do MS-only measurements by omitting the IMS (blue path in Figure 2).
The second mode of operation employs an ion switch to control the flow of ions through the IMS (orange path in Figure 2), resulting in 2D data that can be used to deconvolute contributions from various isomers or isobars. The Vocus CI-IMS-IMS TOF's capabilities are easy to turn on when required.
Isomer Separation with Ion Mobility
It is possible to demonstrate the Vocus IMS separation by examining the isomers methyl salicylate and methylparaben. In proton transfer reaction (PTR) chemistry, these compounds exhibit identical mass spectrum peaks at the same corresponding protonated mass (153.05 Th), since they only differ in the position of the hydroxyl group on the aromatic ring.
This is experimentally shown in Figure 3’s blue trace. This information was gathered by collecting a methyl salicylate and methylparaben combination in the air in MS-only mode at 500 ppt concentrations (blue path in Figure 2, blue in Figure 3).
This information does not say how many isomers contributed to the peak, only that at least one C8H8O3 compound was present. The only way to do this is by activating IMS analysis.
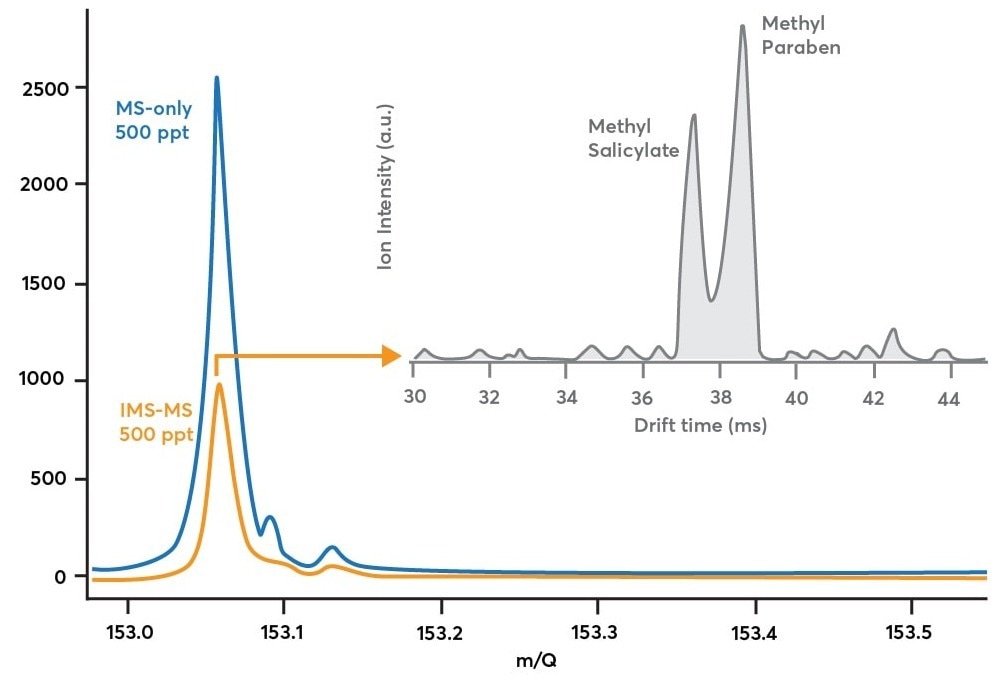
Figure 3. Blue trace: mass spectrum obtained while sampling 500 ppt methyl salicylate and 500 ppt methylparaben in MS-only mode (blue path in Figure 2). Orange trace: mass spectrum obtained while sampling the same methyl salicylate/methylparaben mixture in IMS-mode (orange path in Figure 2). Gray trace: shows how the mass spectrum in orange is decomposed along the ion mobility dimension to reveal multiple components after a 90 second acquisition. Image Credit: TOFWERK
The distinct components of a single mass peak can be distinguished due to the IMS mode activation. Once triggered, the ion gate is subjected to a pseudorandom sequence (multiplexing), which modifies the ion signal and provides crucial timing data for determining drift durations. Ions are then steered into the mobility zone (the orange path in Figure 2).
When comparing the IMS-MS mass spectrum (orange trace) to the MS-only mass spectrum (blue trace) in Figure 3, it is clear that ion modulation induced ion losses.
Theoretically, the IMS-MS mode should measure 50% of the ion signal in comparison to the MS-only mode due to the gate sequence’s 50% duty cycle. A few ions are lost either in the drift zone or at the ion gate, as demonstrated experimentally by measuring 40% of the ion signal in IMS-MS mode compared to MS-only mode (a 10% discrepancy between theory and experiment).
This trade-off in ion intensity enables the production of drift time distributions for a broad range of mass-to-charge ratios. The duty cycle is increased to 50% with multiplexing from <1% in non-multiplexing methods. The gray trace depicts the drift time distribution for 153.05 Th in Figure 3.
This trace, averaged over 90 seconds, demonstrates the effective separation of methyl salicylate from methylparaben. This makes it possible to quickly validate either species' presence and track the evolution of their relative concentrations over time.
The same dataset shown in Figure 3 shows the IMS drift distribution for the first carbon isotope (13C1C7H9O3+, m/Q = 154.05 Th) of the methyl salicylate and methylparaben mixture. This will help users understand how IMS data's S:N ratio degrades at concentrations below 500 ppt. Since only 8% of the 12C parents, or 40 ppt for each compound, are predicted to be present in the initial carbon isotope concentration, this data is beneficial.
The drift time distribution should be identical to that observed for the 12C parent compounds in Figure 3 (gray trace), apart from the lower concentration. Although the drift pattern seen in Figure 4 is qualitatively similar to that in Figure 3, the S:N ratio worsens as the instrument’s LOD approaches.
This indicates that the Vocus CI-IMS-MS device can separate and identify analytes at concentrations up to 40 ppt but requires more extended averaging periods.
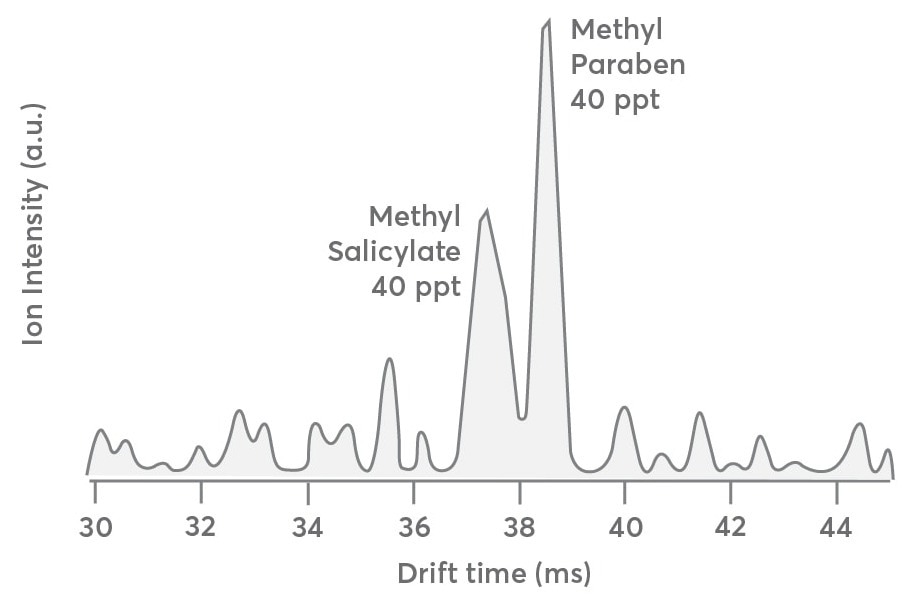
Figure 4. Drift time distribution of the first carbon isotope (13C1C7H9O3+, m/Q 154.05) of methyl salicylate and methyl paraben sampled at 40 ppt each. The spectrum is qualitatively like that presented in Figure 3 except for the lower S:N ratio. Image Credit: TOFWERK
Real-Time Monitoring of Isomer Populations
Even though the data in Figures 3 and 4 were averaged over 90 seconds, typical drift times occurred between 20 and 150 milliseconds. It is conceivable to track isomer populations in real time since mobility separations occur on such short durations.
This is helpful for processes that rapid gas chromatography (GC) instruments struggle with, such as those where isomer ratios shift over less than 60 seconds.
Results from an experiment showing real-time detection of isomer populations are shown in Figure 5. Here, a liquid calibration system (LCS) is used, and a small amount of a methyl salicylate solution is put into it. The instrument response is then recorded.
In this experiment, the methyl salicylate signal is anticipated to rise initially before starting to decline as the methylparaben solution flushes it out of the system. When the methyl salicylate injection stops diluting the methylparaben after the run, the highest concentration is 2.5 ppb.
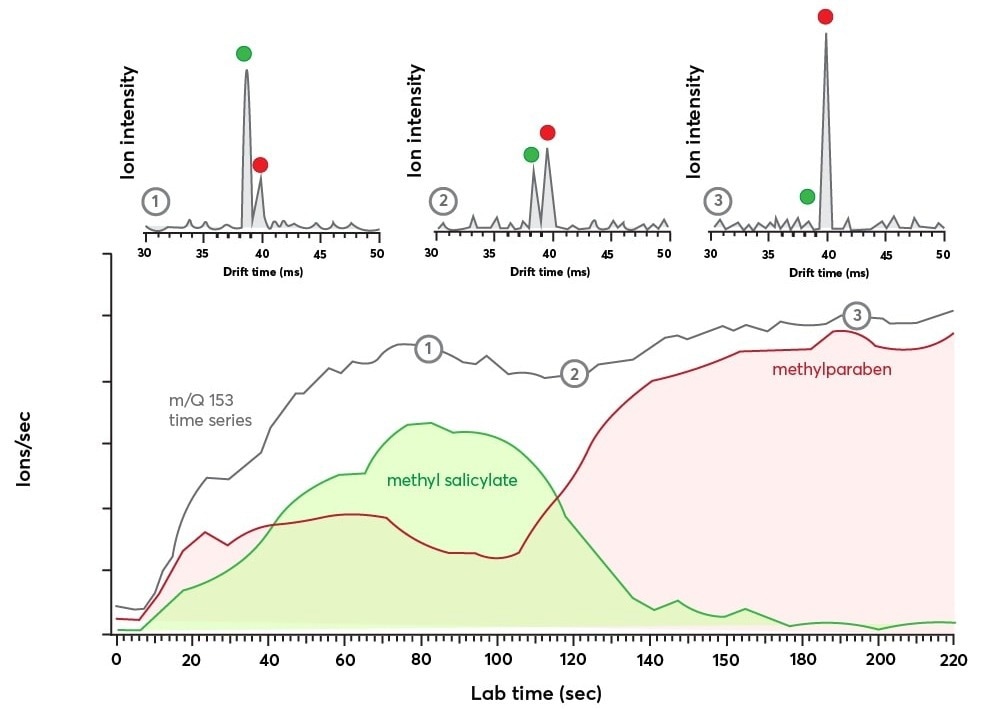
Figure 5. Bottom panel: time series data for m/Q = 153 Th showing the evolution of the ion current with time (in gray). The IMS dimension reveals the transient response of the isomers methyl salicylate (in green) and methylparaben (in red). Top panel: Shows the IMS spectra recorded at three different time points during the m/Q = 153 Th time series as indicated by the numbers 1, 2, and 3. The IMS spectra were each averaged for 2.9 seconds and show a clear exchange of ion population from methyl salicylate to methylparaben. Image Credit: TOFWERK
Three IMS spectrum “snapshots”—each averaged over 2.9 seconds—from separate points in the experiment are shown in the top panel of Figure 5. The mass spectra peaks connected to methyl salicylate and methylparaben, respectively, are indicated by the green and red dots. As these features’ respective intensities shift over time, it implies that the relative population of the two species will also shift.
By integrating the individual IMS signals and dividing the observed ion current by the ratio of the integrated areas, changes in isomer populations can be tracked. The results of using this technique to analyze the methyl salicylate and methylparaben IMS signals are shown in the bottom panel of Figure 5.
The methyl salicylate signal (green) increases rapidly until it peaks at 80 seconds, at which point it declines. The methylparaben signal (red) is still weak until later in the run.
Methyl salicylate and methylparaben time series data are both included as contributions to the m/Q Th channel, which is shown in grey. Here, the signal increases swiftly before stabilizing after around 70 seconds.
There is no obvious evidence that the isomer populations change after this point. The IMS spectra in the top panel were obtained at the times indicated by the corresponding labels, which are represented by the labels “1”, “2,” and “3” along the time series trace.
While the gas chromatography data shown in Figures 3 and 4 might be possible to gather, it would be difficult to duplicate the real-time data shown in Figure 5. For individuals who want quick analysis with isomer separation, the TOFWERK Vocus CI-IMS-TOF performs isomer separations on a significantly quicker timeline than GC.
Reference
- https://www.pnnl.gov/available-technologies/structures-lossless-ion-manipulation-slim

This information has been sourced, reviewed and adapted from materials provided by TOFWERK.
For more information on this source, please visit TOFWERK.