Sponsored by TOFWERKReviewed by Aimee MolineuxMar 18 2024
Thanks to its durable construction and compact size, the Vocus Elf PTR-TOF excels as a real-time mobile monitor for measuring environmental VOCs.
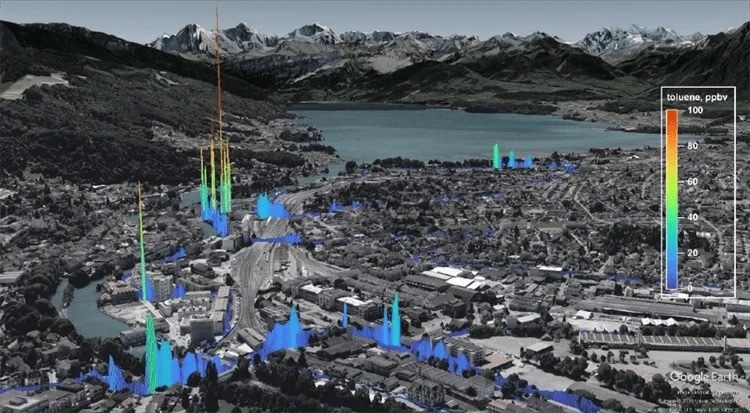
Image Credit: TOFWERK
Characterization of VOC Emissions Using Mobile Laboratories
Researchers and regulatory authorities can create a mobile laboratory to map chemical emissions and dispersal within the air across various areas when equipped with the proper instrumentation.
Alongside direct mapping, these mobile laboratories can locate and “fingerprint” point sources, gather information on ambient concentrations, and understand the real-world lifecycle of VOC emissions. This data reveals crucial information that serves as input for air quality modeling, environmental policy, and public health studies.
Proton-transfer-reaction mass spectrometry (PTR-MS) is a long-established method used in various mobile lab applications as it facilitates the direct measurement of ambient air, and is able to identify and pinpoint individual VOCs across a complex sample matrix. Several studies using mobile lab capabilities have taken advantage of traditional quadrupole PTR-MS (PTR-qMS), and the measurements acquired using these instruments are foundational for the makeup of modern atmospheric science.
Vocus Elf PTR-TOF provides the same advantages as Vocus PTR time-of-flight mass spectrometry (high sensitivity from the Vocus PTR reactor, multiple-Hz measurement speed, and simultaneous measurement of all masses) at the price-point, size, and power requirements of PTR-qMS.
Feature Image: An electric vehicle fitted with a Vocus Elf PTR-TOF was driven through the streets of Thun, Switzerland. The color and height of the markers displayed along the drive path signify the ambient concentration of toluene (C7H9+) at a 4-Hz measurement speed that was measured.
Methods
For this investigation, a Vocus Elf was placed in the rear passenger seat of an electric car and secured with a ratchet strap (Figure 1). The car did not undergo any specific engineering modifications and could be used as standard.
A 1/4” PFA line was passed through the car’s roof window and attached to a longitudinal sampling probe that stretched over the car's hood; this setup was used to sample the external air conditions.
To eliminate the risk of the instrument sampling the car’s emissions during the study, full electric power was used throughout the experiment (90 minutes), and the Vocus Elf was powered using the car battery.
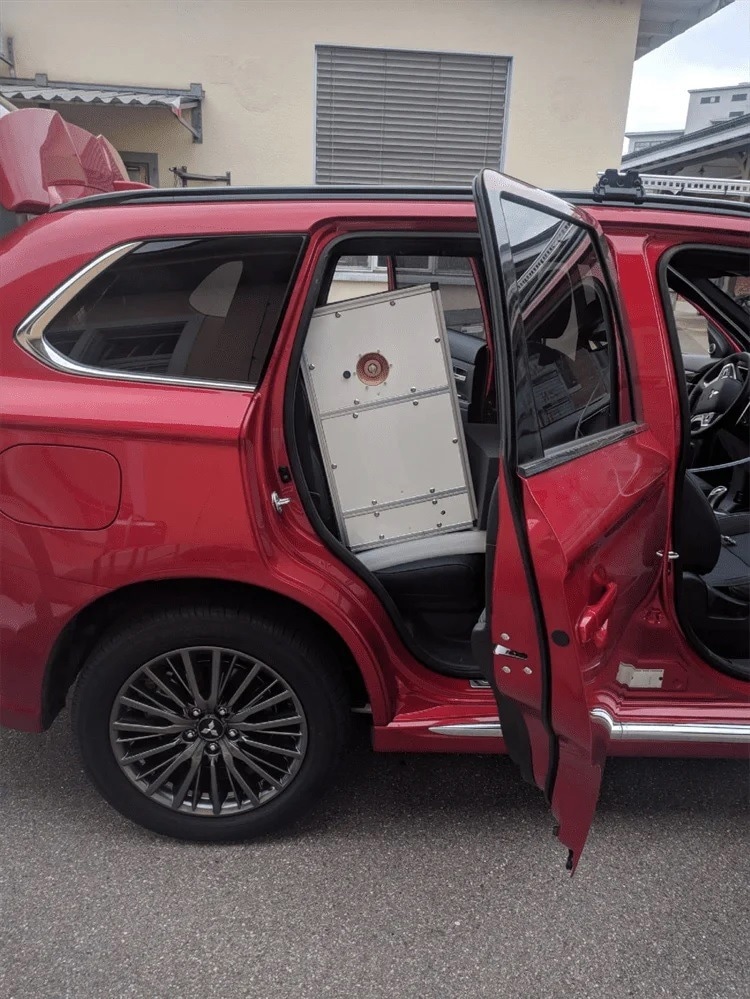
Figure 1. Vocus Elf PTR-TOF installed in a vehicle. A PFA sampling tube attached to a longitudinal roof sampling probe (visible in the upper right corner of the image) was connected to the instrument inlet and small external pump. Image Credit: TOFWERK
This particular drive path was mapped out to pass through several major arterial streets, as well as by the official air quality monitoring station and other key point sources such as gas stations, a water treatment plant, and the train station.
Spatial Characterization of VOC Emissions
Numerous VOC hotspots became immediately apparent to the operators during the drive. An overlay of the measured toluene on a map shows hotspots close to the following areas:
- Arterial roads
- Gas stations
- Intersections
- The train station
The operators discovered that at times there was an ambient concentration in excess of 100 ppbv in these areas (as displayed in the feature image). Concentrations of BTX were detected in excessively high levels close to a large construction site on a major roadway, as shown in Figure 2. Generally, single stationary monitoring stations cannot effectively detect large, transient emission sources such as these.
An elevated signal was observed on over 100 unit-mass-integrated ions, and associations between different compounds can be applied to determine the chemical “fingerprints,” or VOC profile composition, of different sources.
Various sources across the route were distinguished, including two potentially different combustion traffic-related sources, a source abundant in toluene, another rich in acetone, and a source that specifically contained m/Q 73, 91, 101, and 119; a distinctive profile of aromatics makes combustion sources identifiable.
It was assumed that the toluene source could be associated with the construction site. Moreover, it was hypothesized that the VOC detected at m/Q 101 could be hexanal or pentanedione emitted from a nearby medical clinic.
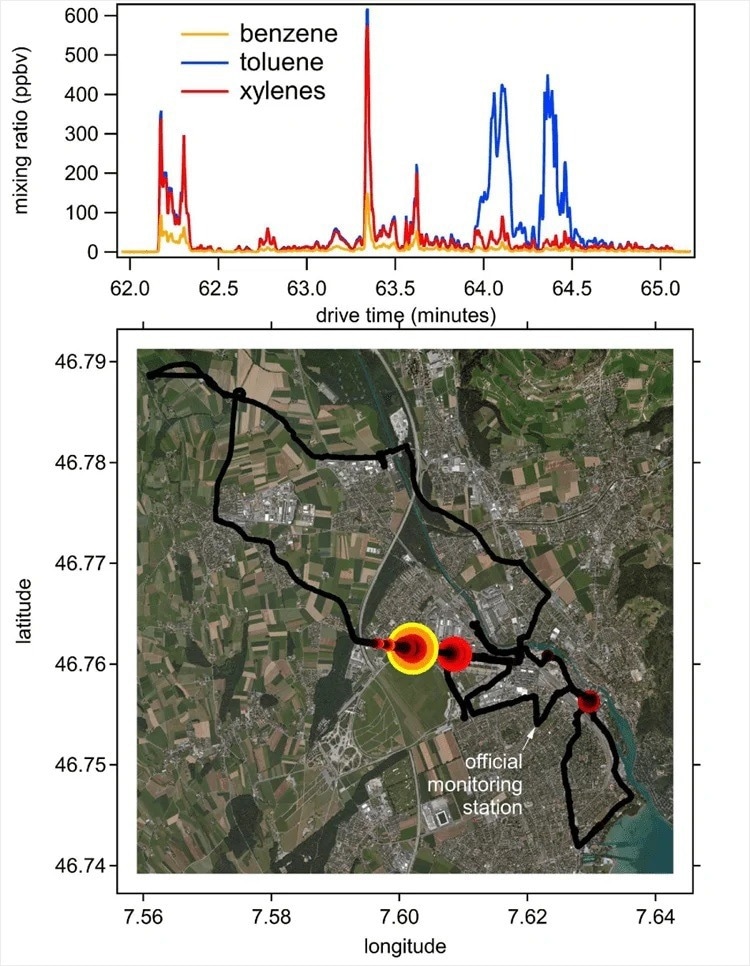
Figure 2. High concentrations of BTX observed near a construction site along the Allmendstrasse. A time series of mixing ratios is shown in the upper panel, and the location of the hotspot is shown in the map in the bottom panel. Image Credit: TOFWERK
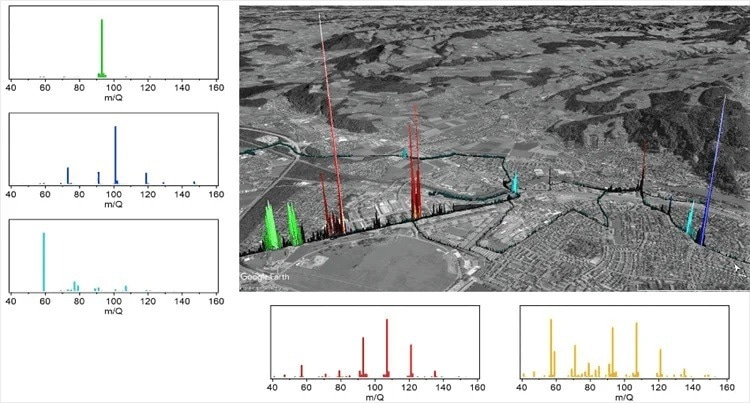
Figure 3. Distinct sources detected in Thun. The map shows the drive track of the mobile laboratory through the city, with color and intensity indicating the identity and relative abundance of each source. The smaller panels show the mass spectral VOC fingerprint of each source. Image Credit: TOFWERK
Acknowledgments
Produced from materials originally authored by Abigail Koss, Luca Cappellin, Christoph Gasser from TOFWERK.

This information has been sourced, reviewed and adapted from materials provided by TOFWERK.
For more information on this source, please visit TOFWERK.