Instron® machine applied an identical load to all sensing technologies. The purpose of this is to analyze the abilities and limitations of load cells, pressure sensing film, and tactile pressure sensors. To make an accurate comparison, a 2” x 2” aluminum plate interface is applied. 800 lbs (363 kg) of force is applied to the sensor and is then increased to 1600 lbs (726 kg).
Load Cell
Data collection software and an analog-to-digital interface support the data measurement, and accurate force data is measured on the force applied by the plate.
Figure 1 shows the results of data collected at 5 Hz for a duration of 100 seconds. The resulting force is measured against the time profile, and it demonstrates an increase of force for 20 seconds, constant force for 10 seconds, and then a second increase in force.
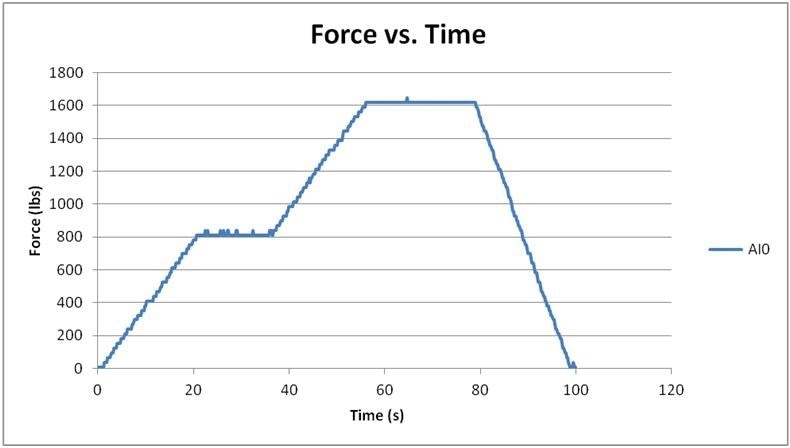
Figure 1. Output from Load Cell
Measurement of up to 22,480 lbs (10,200 kg) is possible using the load cell for data collection. Low analog-to-digital converter resolution creates small bumps along the curve. The data shown is extremely consistent and linear. The precision of the data is affected by the limitations of the input card A/D resolution. Despite this, the measurement is still very accurate across a wide range of forces.
High precision over a wide range of forces is one of the greatest strengths of this technology. The user divides the reported force by the area of the plate, applying the force to it. The average pressure determines that the two plateaus have 200 (1.38 MPa) and 400psi (2.76 MPa), respectively.
A straightforward adjustment calculation is available for controlled experiments. However, for unique shapes that have non-flat surfaces or where the contact area is not known, the pressure estimate is less accurate.
Pressure Indicating Film
The pressure indicating film was only used to measure the 800 lbs load applied to the interface.
Super Low Pressure (LLW) film collected data which is rated for 71-355 psi (0.5 to 2.5 MPa). However, other pressure ranges are also available. The resulting peak pressure is shown in Figure 2.
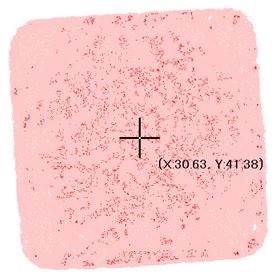
Figure 2. Photo of Super Low Pressure (LLW)
The only pressures indicated in the resulting images from the pressure indicating film are the peak ones. Thus, there is no data that reflects the dynamic nature of the pressure applied.
In this experiment, only 800 lbs (363 kg) was applied to the film. If the Instron were to also apply a 1600 lbs (726 kg) load to the film, the higher measurement would have “covered up” the 800 lbs (363 kg) reading. This could create problems if a measurement application applies a spike force on the film before the two interfaces reach a resting pressure.
The film was canned and the data was analyzed in film analyzing software. Figure 10 shows the evaluation that results from this and provides key metrics, such as overall load, loaded area, peak pressure, average pressure, and Prescale Effective Rate percentage. Assessment of the quality of the data collected is provided by the Prescale Effective Rate percentage. This is also an indication of how accurate the data in the report is.
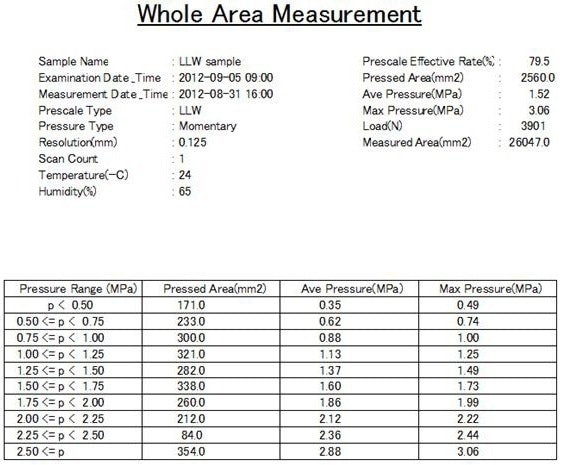
Figure 3. Film Analytics
With a Prescale Effective Rate percentage in the range of 80%, the data provided is somewhat unreliable. The reported load of 3901N (877 lbs) and the average pressure of 1.52 MPa (220 psi) represent an approximate 10% error from the load actually applied by the Instron.
The simplicity of the pressure indicating film provides versatility to collect interface pressure in a variety of applications. However, this simplicity also has drawbacks. For example, only peak pressures can be recorded, resulting in a loss of information regarding the dynamic nature of the applied pressure.
Tactile Pressure Sensor
There is a variety of tactile pressure sensor form factors available, that provide options for sensing area, spatial resolution, and pressure range. A wealth of data is collected due to the density of the sensing elements.
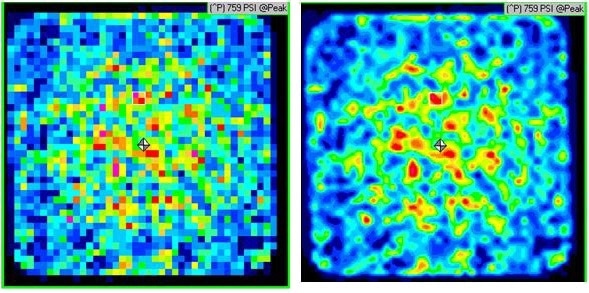
Figure 4. Pressure Mapping System Display
Figure 4 shows the image generated by the tactile pressure mapping system software. The first image is pixelated because it represents the raw data collected from the sensor. Each pixel represents the data captured from an individual sensel in the sensor.
The second image demonstrates the ability of the software to interpolate, average, and contour the data in the image. This creates a clearer representation of the measured object. The data analysis in the software is not affected by the algorithms used for interpolation; rather, only the image is. Therefore, the accuracy of the data is maintained, and clearer images are provided for review at the same time.
In addition to the color representing the pressure distribution, the image plots two icons on the screen: a white box, which identifies where the peak pressure is located, and a grey-white diamond that identifies where the center of the force in the contact area is.
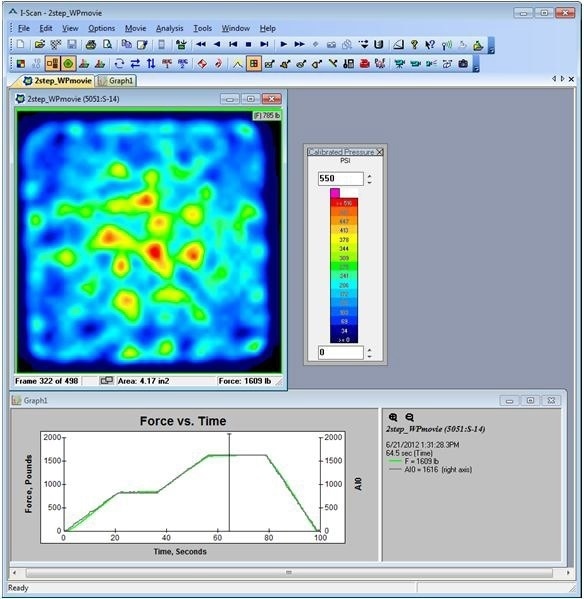
Figure 5. Screen Shot of Software
The software provides multiple ways to view and analyze the data. Just under 100 seconds of data was recorded as the Instron applied various forces. A plot of the total of the force applied versus time is shown on the graph at the bottom of Figure 5. Collected sensor frames can be synchronized with video to enhance the evaluation of data collection.
The graph in Figure 5 plots two data series: the pressure sensor data and the analog input from the load cell. Force is defined by the left vertical axis, and it correlates with the output of the tactile pressure sensor. The load cell reading is defined by the right axis. An analog-to-digital converter connects the load cell to the system.
In the experiment, force from the Instron was applied to the tactile pressure sensor and load cell simultaneously. The thinness of the tactile pressure sensors makes this possible. The tactile pressure sensor was positioned directly on top of the load cell and was non-intrusive when taking measurement.
The input from the load cell was used by the software to calibrate the tactile pressure sensor, which created an accurate measurement, as the overlap of the two curves in Figure 5 indicates. This configuration leverages the strengths of load cells and tactile pressure sensors to provide the user with a complete and accurate analysis. In this experiment, the tactile pressure sensor reports that the force data applied is within 3% of the actual applied force.
The software can perform several different tasks, including identifying the center of force, highlighting the peak pressures of each of the sensels, tracking the trajectory of the center of force, viewing the data in a 3D graph, and observing the force value of each sensel. The data can then be reviewed in Microsoft Excel or exported in ASCII format where it can subsequently be analyzed in depth. Graph options can be adjusted to show object area, contact area, force, and pressure over time, as well as frame, or position in line/histogram graphs.
Data from Three Technologies
The most reliable data is provided by the load cells while measuring interface pressure. Nevertheless, the size and number of load cells limit the range of possible applications. Additionally, while total load can be reported easily, the size of the load cells makes it difficult to acquire fine granularity of pressure distribution. It is possible to manipulate the pressure indicating film to make it suitable for a variety of applications. However, this data is less accurate and cannot report the range of forces applied in dynamic applications.
Detailed dynamic measurements of interface pressure can be attained using tactile pressure sensors, which have a minimum impact on system dynamics. Proper calibration of the sensing elements helps to provide accurate data, but the most in depth analysis of interface system dynamics is provided by the resulting measurements.
Load cells, pressure indicating film, and tactile pressure sensors each provide advantages and constraints, depending on what information is needed and what the physical constraints of the system are. Understanding how these strengths and limitations influence an application is critical.

This information has been sourced, reviewed and adapted from materials provided by Tekscan, Inc.
For more information on this source, please visit Tekscan, Inc.