The job of a design engineer often involves identifying potential issues as well as seeking new ways to advance a product’s design and optimizing manufacturing processes. Tasks such as these can be laborious, but new interface pressure analysis tools – including pressure indicating film and tactile pressure sensors – hold the key to solving key design challenges.
These analysis tools help designers understand how components fit together and how they perform during use.
Pressure indicating film and tactile pressure sensors both have advantages and constraints when attempting to provide accurate and meaningful data, and this depends on what the physical limitations of the system being measured are and also what information is required. It is thus essential to understand to what degree these strengths and weaknesses influence an application.
Pressure Indicating Film
The interface pressure between two surfaces is measured using pressure indicating film. This basic method uses color-developing material with very small microcapsules layered over a polyester material.
Each color microcapsule breaks when pressure is applied. Different microcapsules rupture at different pressures, and the more pressure is applied to a given location; the more capsules get broken. This increases the intensity of the color on the film (Figure 1) and produces a clear image of the force applied across the sensing area.
It is relatively easy to implement an indicating film. The thinness of the film allows it to be used in a variety of applications to capture images of pressure profiles. It also can be cut into unique shapes to fit into applications with obstructions.
There are no electronics attached, which allows the film to collect pressure distribution information with no concern of crushing wires or expensive electronics. The user can also run a digital analysis of the scanned sheet using an optional scanner and software solution.
Indicating film works well if a user only requires a snapshot of the peak pressures between objects. If the testing process is more complicated, i.e., measuring variations below peak pressure, or attempting to understand changes in pressure over time, a different tool would be more appropriate. Static measurements can be adversely affected by the initial spike force on the film as the two interfaces are initially brought together.
One example of this is how the measurement of pressure distribution between an engine block and its head is obtained. As each fastener is tightened to secure the two halves together, the fastener will relax the stress on a neighbor. When measuring this distribution dynamically, only the peak pressure during the tightening process will be indicated. As the resting pressure between interfaces is not measurable, designers can overestimate the actual final pressure when using pressure indicating film.
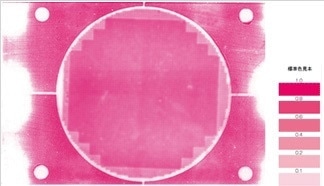
Figure 1. Pressure indicating film produces an image of the pressure applied across the sensing area. The user then determines the pressure measurement based off the color chart provided.
Another disadvantage is when repeated tests are needed, namely when adjustments are being made. This can potentially put the operator at risk if the tests are conducted in a hazardous environment, for example, when a film needs to be repeatedly placed on moving parts. Indicating film is consumable as each adjustment requires a piece to be cut and placed, which takes up time and increases the cost of materials.
Tactile Pressure Mapping
Tactile pressure sensors can also be used for pressure measurement. This approach allows for dynamic pressure mapping, analysis, and reporting. A common tactile pressure sensor is comprised of a piezoresistive layer sandwiched between two pieces of flexible polyester. Printed silver conductors are on each half. The sensor incorporates a vertical and horizontal array of traces (Fig. 2).
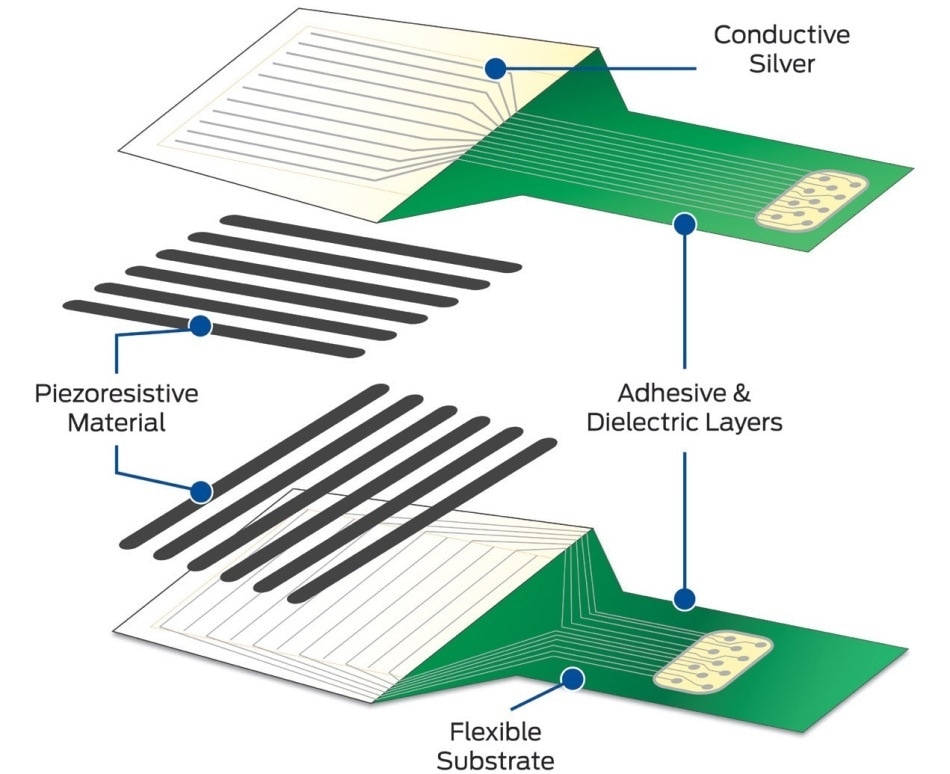
Figure 2. The construction of this tactile pressure sensor includes horizontal and vertical sensing materials to provide special coordinates for analysis.
Each sensing element placed in the intersection of each row and column is a single, independent sensing unit called a sensel. The spatial resolution of the sensor is defined by the number of sensels in the array, providing the array of pressure over an area of the surface measured.
Sensing elements are densely packed in the tactile pressure sensor, which makes possible the delivery of a high level of spatial resolution of pressure distribution. The sensors are also very diverse in their size and pressure ranges, and for this reason it is easy to customize them for almost any application. This thin 0.004 in. (0.1 mm) sensor can be adapted to suit a high number of applications, with minimal disturbance to the behavior of the system being tested.
Scanning electronics transmit a signal through the silver traces and piezoresistive layer; the resistance of the piezoresistive layer changes with the pressure that is applied to the sensing area. The analog data is then measured by the scanning electronics and converted to a digital signal, which is transmitted to a PC. The entire sensing area can be scanned at speeds as high as 20 kHz.
The tactile pressure system software features multiple tools for analysis, making it a vital part of the overall pressure system (Figure 3). For example, a window in the pressure mapping software shows the activity in the sensor area, which enables the user to observe the impact of their adjustments in real-time.
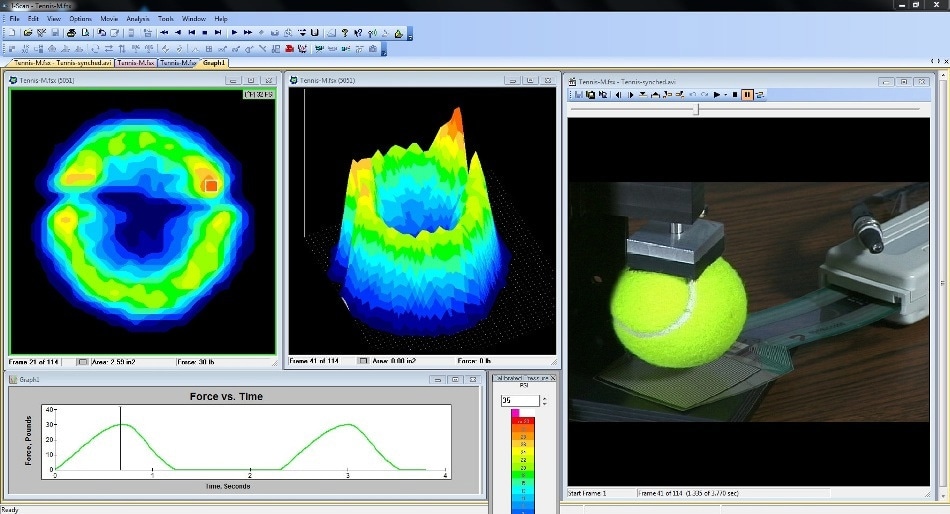
Figure 3. The tactile pressure mapping software includes ways to both view and analyze data and video recording. Those are done in real time. The blue-to-red color spectrum indicates areas of low and high pressure.
In dynamic applications, a recording of the pressure distribution can be collected and saved for a frame-by-frame analysis. This analysis is provided by the software in the form of graphs that show force, pressure, contact area, and other parameters versus time or position on the sensor. The software can also identify the center of force for the contact region.
One difficulty that arises when using tactile pressure sensors and associated electronics is the extended setup times that are required to ensure calibration has been implemented properly. To acquire a precise measurement, the calibration of the sensor should be carried out using materials that are very similar to those in the application. Sensors can be used to take multiple measurements, and different sections of the sensor tend to become sensitive over time. However, these differences in sensitivity can be normalized using a periodic equilibration.
Conclusion
Despite the fact that pressure indicating film is versatile in its uses, the data it produces has less accuracy and cannot report the range of forces applied in dynamic applications. Tactile pressure sensors, on the other hand, provide detailed and dynamic measurements of interface pressure that have a minimal impact on system dynamics. Proper calibration of the sensing elements is needed to provide precise data, but the most in-depth analyses come from the resulting measurements of the interface system dynamics.

This information has been sourced, reviewed and adapted from materials provided by Tekscan, Inc.
For more information on this source, please visit Tekscan, Inc.