Below are three examples of technologies that can be used to measure force or interface pressures. Despite the overlap of information that may occur between them, they each provide something unique to the problem-solving process.
Load Cell
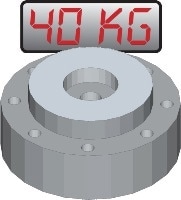
Reliable, but does not provide pressure distribution data.
Pressure Sensitive Film
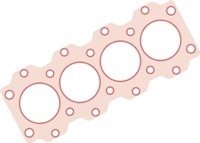
Flexible, but can only measure peak pressure.
Tactile Pressure Sensor
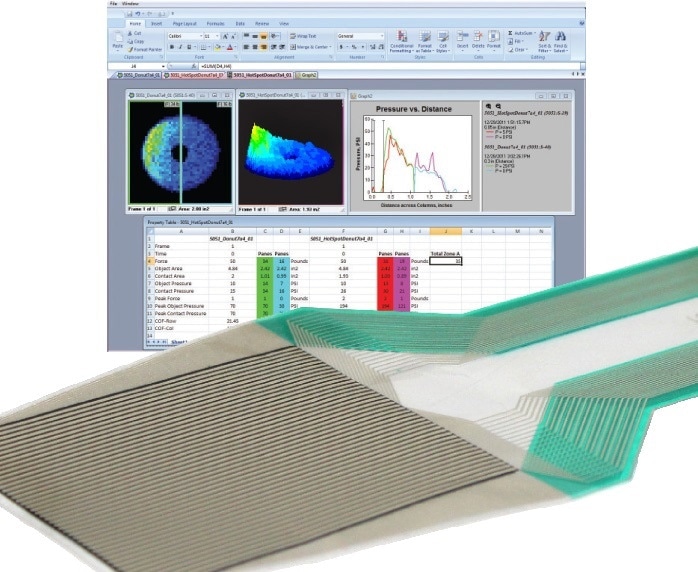
Versatile, with unique pressure distribution data.
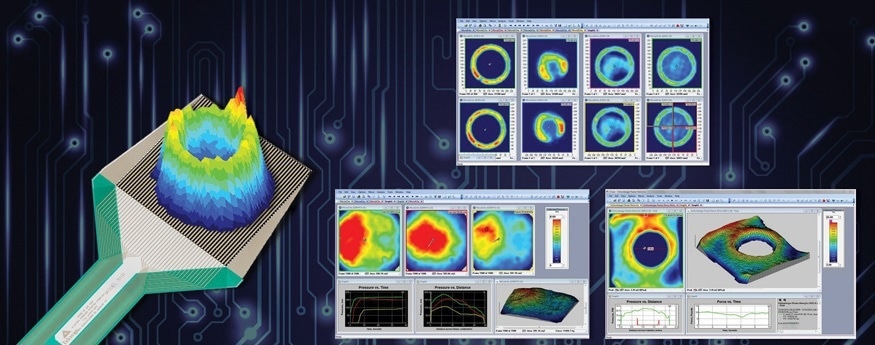
The Advantages of Using a Pressure Mapping System
- Pressure distribution represented in a visually clear way
- Real-time feedback as adjustments are being made
- Thin sensor provides minimal interference between the objects being measured
- Versatility: single analysis tool for a broad range of applications
- Sensors can be customized to specific form factors, resolutions, and pressure ranges, to meet the needs of unique applications
- Sensors are available for high temperatures and humid conditions
- Third-party analysis tools can be interfaced with the software
- Product design, manufacturing, quality, and research are improved with the help of the insights provided
Packaging Applications
Some conventional packaging applications are reviewed in the following section, along with the information that a Tactile Pressure Mapping System can provide. Engineers can improve the general quality of the production area with the help of the pressure mapping technology because it gives them insight into the machine setup. This actionable data enables manufacturers to optimize their manufacturing process.
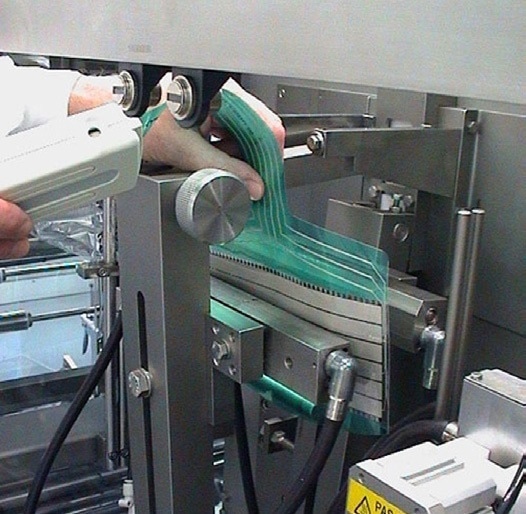
Figure 1. I-Scan System Testing the Pressure Produced During Sealing Process
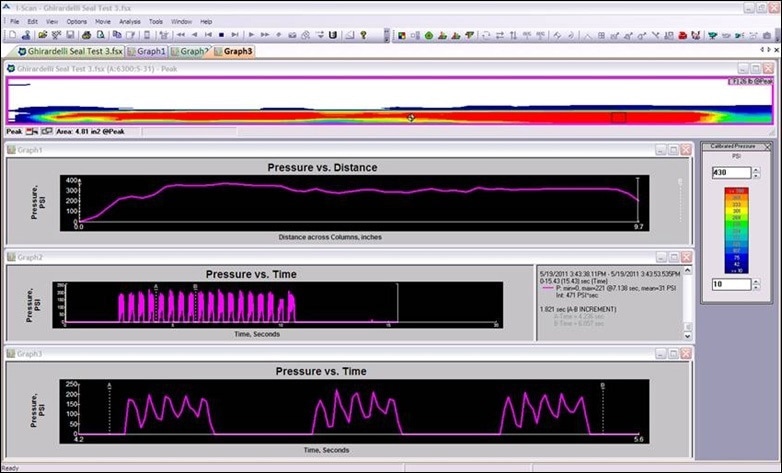
Figure 2. Pressure Output Displaying Unsteady Sealer Bar Contact
Sealing Jaws
Uneven bars, low forces, and/or worn parts in the clam sealing assembly are indications of a poor quality seal, which can result in a tremendous amount of product waste for the manufacturer. These problems are mechanical and can be detected with the Pressure Mapping system as utilized in packaging application, with the aim of identifying such issues (Figure 1).
It is possible to measure the pressure produced by the clamp during the sealing process. Tekscan systems test this pressure to determine how effective a seal is. One possible way to avoid product waste for the manufacturer is to adjust the sealing forces before a production run begins. Ultimately, this pressure data can be used in other areas, such as in research and in development projects to improve sealing machine design.
The images below show before and after tests of the pressure output of sealing jaws.
Weak pressure on the outside of the seal (left side) is observed in the ‘before’ test image. After being reviewed, adjustments were made and a second test was conducted. The second test revealed a more even seal.
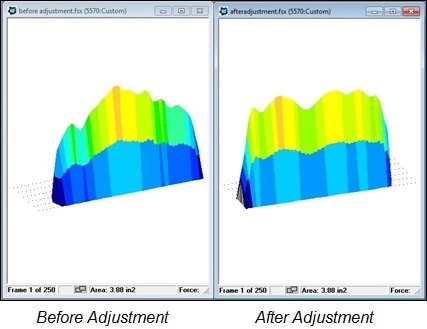
Figure 2 shows a study of the same seal, in which pressures on the right side of the seal were higher than those on the left side. The first Pressure vs. Time (center) graph shows the full recording of 18 seal cycles performed during this test. The second Pressure vs. Time graph (bottom) is zoomed in to show seal strike numbers five, six and seven. The graph reveals that, rather than having a solid, steady sealer bar contact, each seal strike had a “ringing” effect on the sealer bar impact.
High-Temperature Sealing Bar
The distribution of pressure between two surfaces as hot as 200 °C (400 °F) can be mapped using Tekscan’s high-temperature pressure sensors. High-temperature sensors are perfect for measuring heat seal packaging equipment. High-temperature sensors can be used in two common scenarios
- To understand interface pressures at application temperatures, as the heat may affect the shape of the bar.
- When the production schedule is tight, and there is not enough time to wait for the bar to cool down.
Figure 3 shows a high-temperature sensor being placed between two sealing bars to measure their pressure uniformity. The first test (below left) shows low and uneven pressures. The data from the first test was gathered and used to adjust the sealing bars, after which, a second measurement was taken (below right). The second test shows a higher and more uniform seal in most of the sealing bar.
Package Drop/Impact
To test the impact of a package dropped at different angles and heights, a high-speed pressure mapping system was utilized (Figure 4). A low-resolution sensor that measures at 20 KHz was used to identify the concentration the pressure. Packaging durability is one important area for manufacturing and design engineers. The company wanted to test package designs to ensure that the design could endure various scenarios that could potentially lead to damage, for example, being dropped during shipping or while being handled by customers.
The test was conducted to make sure that the bottom of the package could withstand being dropped, without any breaks or leaks.
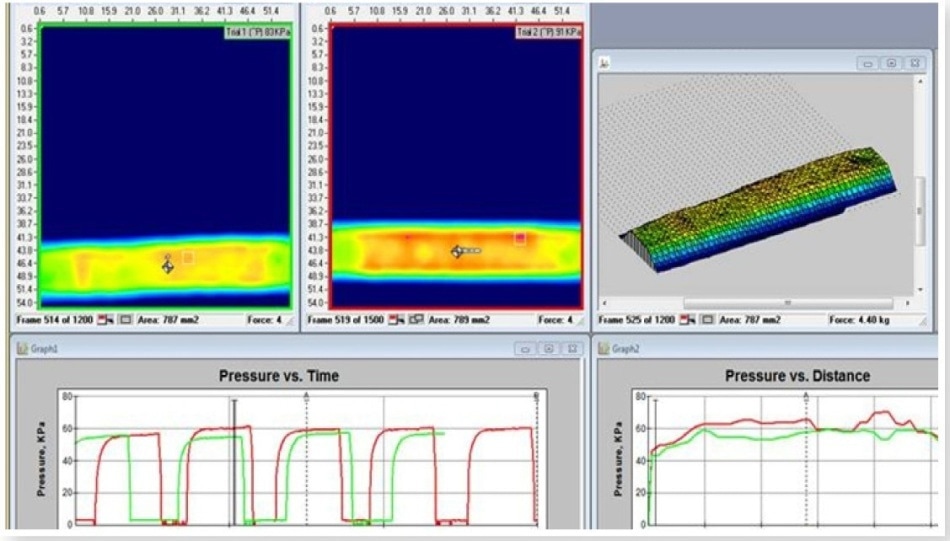
Figure 3. Output of High Temp Sealing Bar
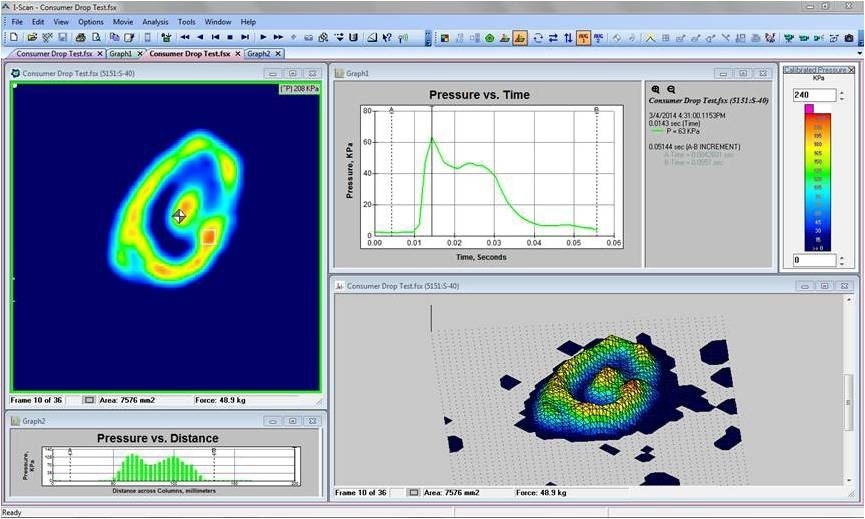
Figure 4. Pressure Display of Dropped Package
Package Stacking
Another important characteristic that manufacturers must keep in mind when shipping or storing a product is the pressure that is exerted on both the container and the product. Figure 5 shows a study in which a pressure mapping system was used to investigate the pressure effects of stacking products on top of one another for storage purposes. The image (below right) shows higher pressures of the product stacked along the bottom of a box. This data is essential to prevent product damage or storage disasters.
UltraSonic Welding
Ultrasonic plastic welding consists of utilizing the heat generated from a high-frequency mechanical motion in order to weld thermoplastics together. The plastic metal is melted as a result of the mechanical motion, along with the applied force, forming a bond between the parts that are sealed.
Figure 6 shows an example of ultrasonic welding that is used to seal the packaging of individual contact lens packets. A weak seal at the five o’clock position was identified by the pressure mapping system during the welding process. Because this weakness was identified, it was possible to make adjustments to the machine and ensure a proper seal. This insightful data provided manufacturing engineers with a reliable welding process, better packaging quality, and reduced the chances of producing a damaged product.
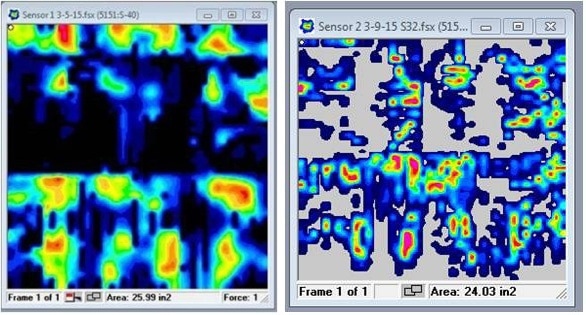
Figure 5. Data Displaying High Pressures of Bottom Product
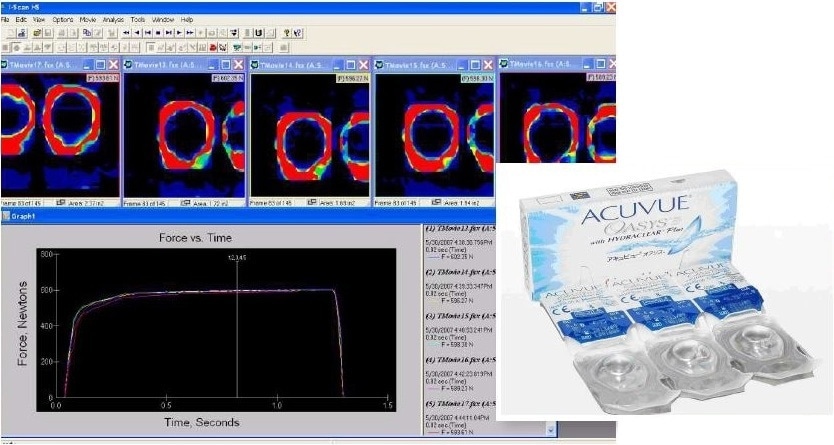
Figure 6. Data of Contact Package Seal Showing Uniform Pressures
Sealing Die Measurement
Beverage manufacturers can also use pressure mapping technology to verify the contact pressure distribution of the of their sealing die during their syrup bag and seal process. During this process, the die opens and closes as a bag, and a spout passes through the sealing station. This technology was tested to make sure the sealing between the bag holding the syrup and the spout was effective.
These bags were then used for fountain soda machines in retail locations. The freshness of the product is dependent on the seal, which means that eliminating leaks and wasted product is vital in the production of this particular product. Figure 7 shows data that was collected from the test, which indicates that there is consistent contact pressures from both sides of the die.
Tool Die Setup
The verify the alignment of a tool die and how uniform the pressure distribution is, a pressure mapping system was used. The system was utilized with the aim of aligning the top and the bottom of a tool die and making the two pieces come together in parallel. The engineers used to do the same with carbon paper, but this was very time-consuming as it provided a static measurement. The carbon paper was placed in between the two pieces of equipment, the data was evaluated, adjustments that needed to be made to the tool were identified, and then a retest was conducted. The tool that engineers were evaluating was used to seal the lids on coffee packets, such as K-cups.
Figure 8 shows how the Tekscan system was used to provide feedback on the adjustments as they were being made. The pressure mapping system made sure that the distribution of the pressure tool was even during the sealing process, and also that it was properly aligned with the cup holding the coffee grinds.
It was possible to conduct numerous tests, and engineers had the chance to make proper adjustments in order to achieve a uniform pressure distribution. The testing ensured that the setup of the machine and tool was adequate, which, in turn, resulted in a reliable packaging process.
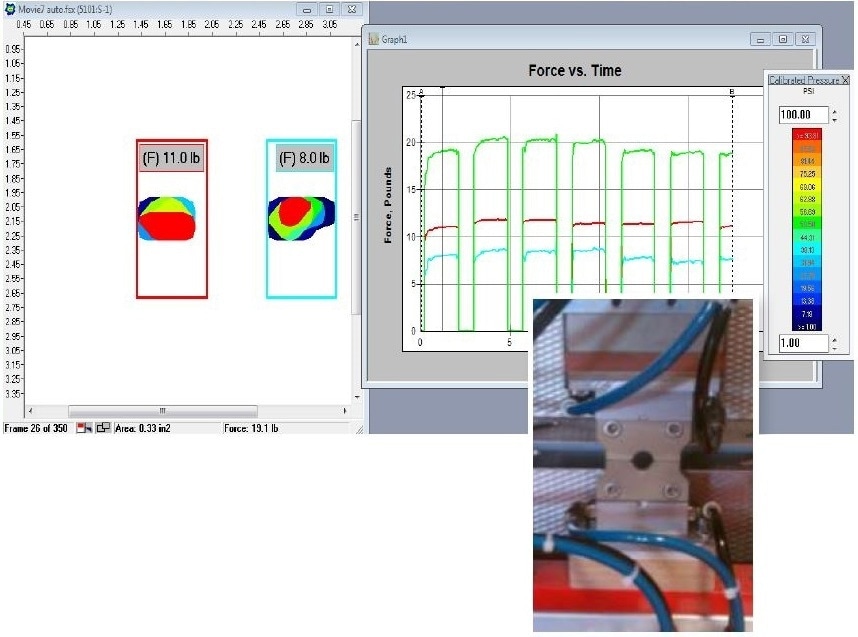
Figure 7. Pressure Distribution of the Top and Bottom of Seal Die
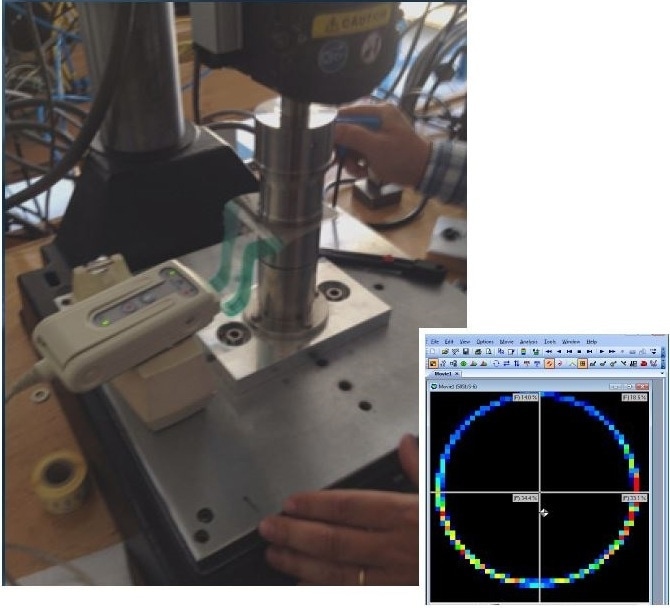
Figure 8. Pressure Distribution of the Top and Bottom of Tool Die
Package Assembly
The proper amount of pressure required for package assembly can be identified with the pressure mapping system. This example demonstrates how a company used a tool that enabled the manual assembly of packaging boxes. The box was assembled, the epoxy was applied, and then the tool applied pressure.
A few runs were conducted, after which the pressure tool seemed to be lessening, which weakened the bond between the box and the epoxy. Figure 9 shows an example of how the pressure mapping system can be used to periodically check the efficiency of the process. The system was also able to test and verify the proper amount of pressure needed to create an assembly process that was consistent and produced an overall better product.
Blister Pack
To keep the product fresh, sanitary and free of damage, it is crucial to identify defects in the packaging of products, as well as optimize the manufacturing process. Blister packs must have an even seal. Pressure mapping system can be used to measure the effectiveness of blister pack seals to prevent leakage and maintain quality.
Figure 10 exemplifies a potential leak in the cavity of a blister pack that could be the result of a weak seal in the lower right corner, which can cause product damage and quality problems.
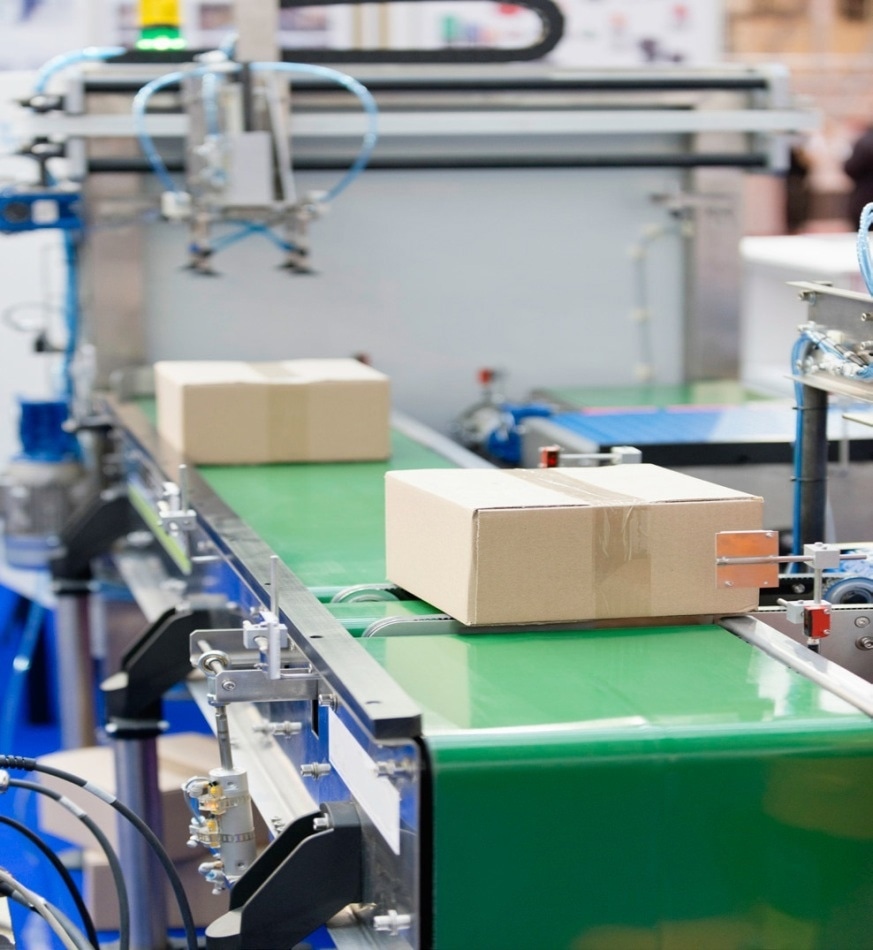
Figure 9. Machine Used for Package Assembly
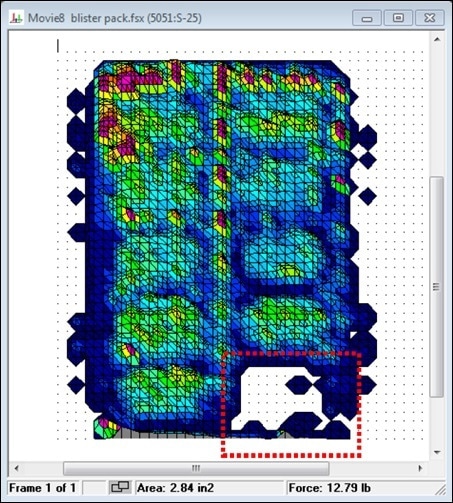
Figure 10. Pressure Distribution of Blister Pack; Showing Weakness in Right Corner
Customer Application: Integrating Pressure Mapping into Packaging Machines
Bonfiglioli Engineering physically integrated the I-Scan system into their machine with the use of API (Pressure Mapping Software Development Kit) software. By detecting cavities with low pressure, they were able to determine whether air was leaking from blister packs.
The sensor is embedded in the lid of the machine, and after the lid is closed, the chamber is sealed, the machine generates a vacuum and depressurizes the chamber.
As the blister cavities within the package swell, the sensor measures the pressure distribution of each cavity. The machine display shows the resulting data using Tekscan’s Pressure Mapping Software Development Kit. Consequently, failure points (i.e. where air is leaking from the blister) can be identified. This new process saved customers time and money, allowing Bonfiglioli to be more competitive.
Figure 12 shows a 3D image of the pressure output from a pill blister pack. It shows that there is uneven pressure within the blisters, which is the result of a poor seal.
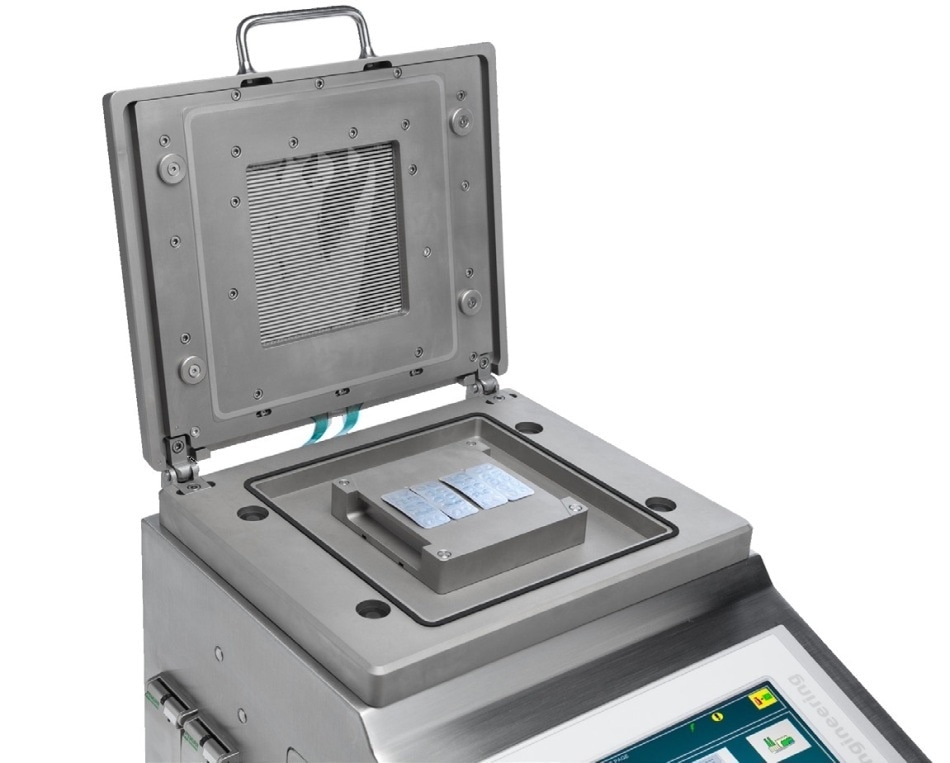
Figure 11. Pill Blister Machine with Integrated Pressure Mapping System
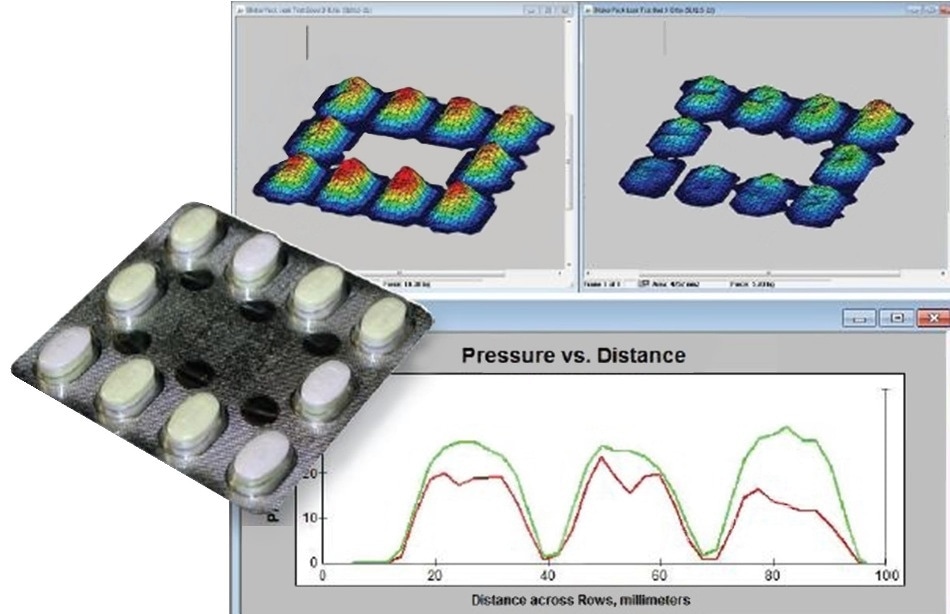
Figure 12. Pressure Distribution of the Pill Blister Pack
The Pressure Mapping Software Development Kit
The Pressure Mapping Software Development Kit (SDK) is an Application Programming Interface (API) that allows users to access the functionality of Tekscan’s pressure mapping software. Developers can use the interface to embed a program within their monitoring and user interface environment. Tekscan’s Pressure Mapping SDK has a set of functions that are related to the Dynamic Link Libraries (DLLs), which control data acquisition and analysis. These DLLs can be run on Windows XP or later and are compatible with any language that can use .NET assemblies.
For efficiency, the Pressure Mapping SDK provides sample code for functions in third party applications, including C#, MATLAB, LabVIEW, and VB, in order to:
- Get Data – Communicate with Tekscan data acquisition electronics
- Record Data – Control acquisition parameters for saving data
- Read Data – Read data from previously saved files

This information has been sourced, reviewed and adapted from materials provided by Tekscan, Inc.
For more information on this source, please visit Tekscan, Inc.