Ottawa is ranked as the 68th most congested city in the world according to the INRIX 2018 Global Traffic Scorecard. Not only does congestion have negative impacts on the environment, it also negatively affects businesses that depend on the roads for the transportation of their goods and services. As the main contributor of congestion is traceable to the large and ever-increasing number of individual cars on the road, the question remains: what is the best way to reduce the number of personal vehicles on the roads and encourage transit usage?
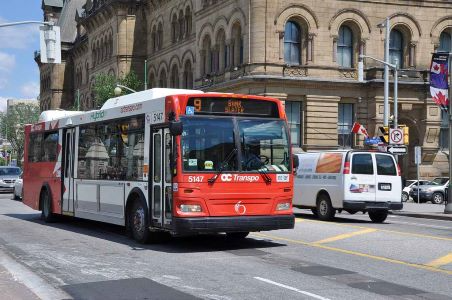
Image Credit: SMATS Traffic Solutions Inc.
It is commonly understood that public transport is the most important and affordable mode of transport that will reduce traffic congestion and make efficient use of existing roads. However, there is a stigma against public transportation, as it has been labeled as crowded, unreliable, and unpredictable. This is a stigma that is still prevalent today. To encourage people to reduce their reliance on private vehicles, public transport must address this stigma and be well-designed, reliable, and comfortable to use.
Even with these arguments against public transport, the benefits are clear and are becoming more important. For instance, a bus carrying 40 or more people takes up far less room on the road per passenger when compared to a person driving themselves to work in a private vehicle, which the vast majority of society chooses to do. Private cars are also expensive to own. Cutting transit investment in favor of car infrastructure negatively discriminates against low-income citizens, who are burdened with crowded commutes and infrequent services.
Lastly, there is an argument for the effects on the climate, for example, that buses are more emission-friendly than single-occupancy cars. This point alone should be appealing, especially with urgency increasing around climate issues, and region climate goals becoming more regulated.
All in all, public transit agencies need to make ideal operational decisions to increase the efficiency of their services. These decisions would rely on estimating the number of passengers, identifying their origins and destinations, and optimizing the travel cost.
Considering all of the above, our objective with this particular study was to capture the travel route and origin-destination information along the OC Transpo Bus in Ottawa and use this information to better manage and optimize Ottawa transit.
Current Methods
Conventional methods of gathering data on transit passenger’s origin-destination are derived from field-based studies, including observational surveys or passenger interviews. Observational surveys are conducted to help understand the subject’s behavior without needing a specific response from the subjects themselves.
In observational studies, they are observed as they carry out their usual activities, such as getting on or off a bus at a certain stop. This type of survey measures the system as it currently exists, but it is often necessary to gain understanding of any changes in travel behavior that have occurred because of changes in operating systems.
Passenger interviews or surveys as well as observational studies are also commonly used. These require interviewers to be physically present to choose individuals to participate and ask them questions.
In a wide range of situations, passenger interviews and surveys are not practical to carry out. As a result, surveyors are unconsciously subject to ‘convenience-based sampling’. In-person sampling opens the data up to bias, as there is a high probability that the surveyors will approach people who are friendly or who are are similar to the surveyor.
Ideally, field-based transit studies should be conducted on as many stops along the bus route as possible. However, this approach is limited by both manpower and the cost limitations for the surveys themselves. These limit the amount of stops that can be included in the survey, narrowing the pool from which data is collected. Traditional methods of traffic studies are therefore not suitable for efficient and cost-effective transit planning and optimization.
SMATS Innovation
SMATS offer an innovative approach for solving the traffic congestion problem. It is based on utilizing Wi-Fi and Bluetooth sensors not only for route travel times, but for passenger origins and destinations.
For this case, a SMATS TrafficBox™ portable sensor was located inside the bus to capture and store signals from mobile devices. The TrafficBox™ was also equipped with a GPS module, a battery, and a processing unit.
The SMATS TrafficBoxTM captured the Wi-Fi and Bluetooth MAC address passively and anonymously from passengers’ devices. It also stored the detecting signals’ time stamps, their received signal strength indicator (RSSI), and the location of the sensor. TrafficBoxTM detects three types of Bluetooth signals, including:
- Bluetooth Connected
- Bluetooth Discovery
- Bluetooth LE.
These are in addition to the WiFi signals the TrafficBoxTM is able to detect.
The main challenge in using traffic sensors is that they collect signals from passengers’ devices and all of the signals that are within the range of the traffic sensor antennas. Because of this, the sensors can receive signals being transmitted from mobile devices in other vehicles, from pedestrians, or from nearby buildings. Beneficially, SMATS iNodeTM is able to tell passengers’ signals and non-passenger signals apart, and estimate their origin-destination by using a variety of parameters and advanced filtering algorithms.
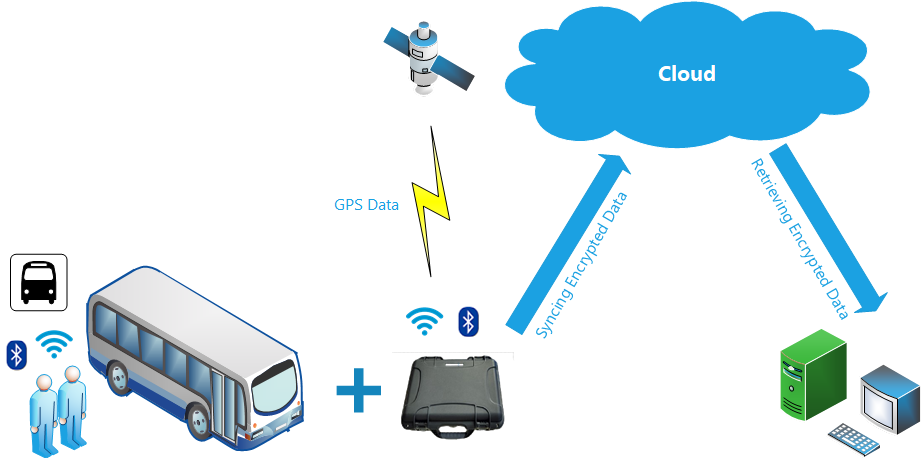
Image Credit: SMATS Traffic Solutions Inc.
Results
One key factor in this study was the user’s ability to choose specific sensor monitoring days and times for relevant data capture. It became apparent while structuring the study that people were using public transport more during rush hours, meaning that it was possible to collect data during these peak times to gather the largest amount and most relevant data concerning congestion.
As a result, the study identified the peak times as 4:00 PM to 5:30 PM (evening rush hour). This window of time was monitored for six days. Route 87-Baseline was chosen for this study out of the other urban routes along the Ottawa Transpo line, because it serves downtown Ottawa and includes a high number of stops.
The TrafficBoxTM sensor was situated in the middle of the bus for each day of the study to capture Wi-Fi, Bluetooth signals and GPS data with 1-second resolution. The sensor captured the device signals and the raw data was automatically synced to the cloud in real time.
The raw data contains a large amount of noise, outliers, and other inconsistencies as it captured all the signals within the antenna range. After cleaning the data set from these outliers, clustering techniques were applied to separate passenger signals from non-passenger signals automatically. The following features were extracted from the raw data set:
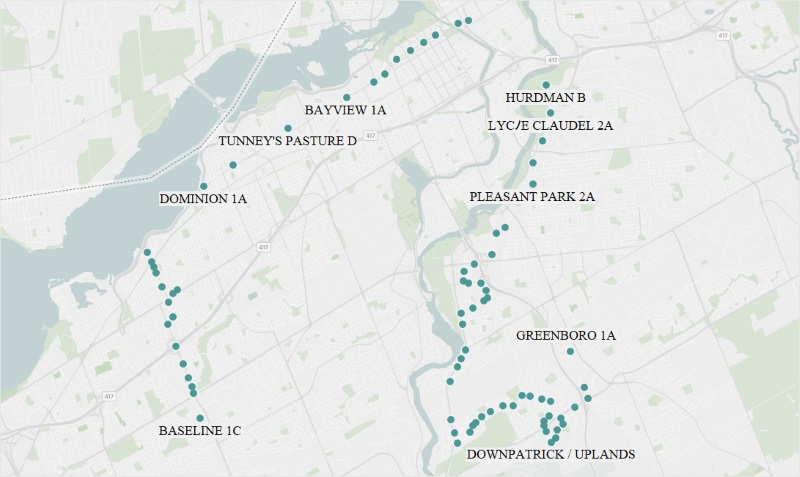
Map showing OC Transpo Route. Image Credit: SMATS Traffic Solutions Inc.
- The average of RSSI: Summary of all the RSSI values for each MAC address divided by its counts.
- The variance of RSSI: Variance of all the RSSI values for each MAC address.
- The number of detection: Number of all the records for each MAC address.
- Travel time: Difference between the last and first detection time.
- Travel Distance: The route distance between entry and exit coordinates.
By applying filtering algorithms with the collected data, it was possible to distinguish the signals of passengers from non-passengers and work out their origin-destination information using GPS and stop location data.
When comparing the passenger manual counts, an average sample rate of 20% was calculated, and, by comparing ground-truth origin-destination data and passengers’ cluster, the passengers’ origin-destination was estimated to approximately 90% accuracy.
This information has been sourced, reviewed and adapted from materials provided by SMATS Traffic Solutions Inc.
For more information on this source, please visit SMATS Traffic Solutions Inc.