The flow curves of polymer melts (the shear rate in the log-log scale versus the graph of viscosity) exhibit two different behaviors of Power and Newtonian law.
The Newtonian behavior is evident at very low shear rates, where the viscosity is independent of the shear rate and it reaches the value, which is known as the zero-shear viscosity.
The viscosity starts to decrease at some critical shear rate (y0). The Power law behavior is evident at higher shear rates, where the viscosity declines with increasing shear rate with a negative slope of (n - 1). The Power-law index is the term for the n parameter.
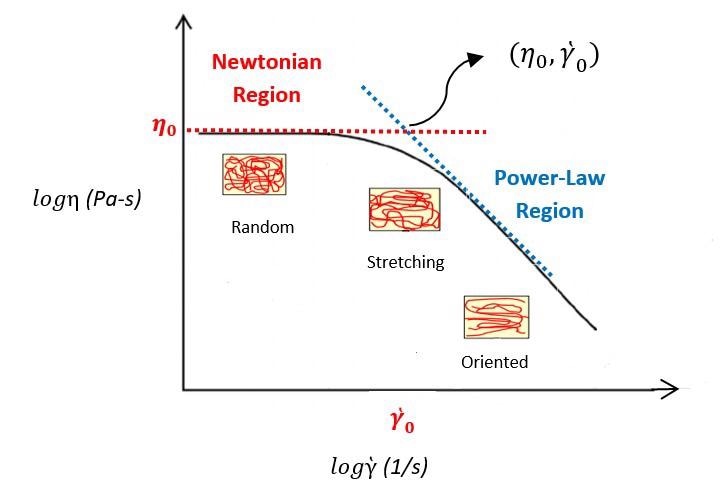
Figure 1. Typical flow curve of polymer melts. Image Credit: Dynisco
As demonstrated in Figure 1, two limiting sloes (dashed lines) surround the flow curve of the polymer, which establish the zero-shear viscosity value (n00 and the Power-Law index value (n)).
The breadth of molecular weight distribution (MWD) and molecular weight (Mw) can be estimated using these parameters. Pressure, temperature, lubricant, plasticizer and filler are additional parameters that can influence the complex shape of the viscosity-shear rate curve.
Not many quantitative relationships have been established to depict how the viscosity of polymer materials is affected by shear rate. Available models are the Cross-WLF model, the Cross model, the Bird-Carreau-Yasuda model, and the Power-Law model. The Power-Law model has been depicted in the equation below:
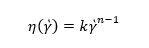
Where k is consistency (Pa-s) and n is Power-law index. Normally, polymer melts have n value in the range of 0.2 to 0.6 according to the polymer type.
The Power-law model only describes the shear-thinning (Power law) region of the curve and it is a beneficial model for process control. The Newtonian section of the curve cannot be described by this model.
Usually, the capillary rheometer data falls into the shear-thinning section of the curve and can be ideally fitted by the Power-law model. Figure 2 depicts the Power-law model fitting analysis (using LabKars software) on two kinds of polyethylene (PE) materials utilizing a Dynisco LCR7001 capillary rheometer.
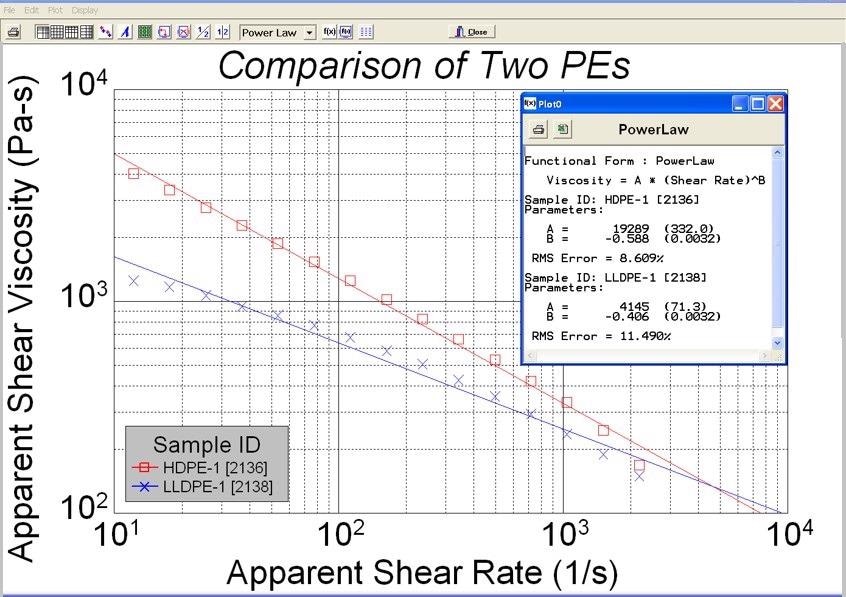
Figure 2. Power-law model fitting analysis. Image Credit: Dynisco
The equation below outlines the Cross model:
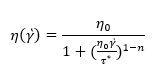
where [] is the shear viscosity (Pa-s), t is the critical shear stress (Pa) or stress at the break in the curve and is the Power-law index. The modified Cross model fitting analysis (from LabKars software) is depicted in Figure 3 on two types of PE materials employing a Dynisco LCR7001 capillary rheometer.
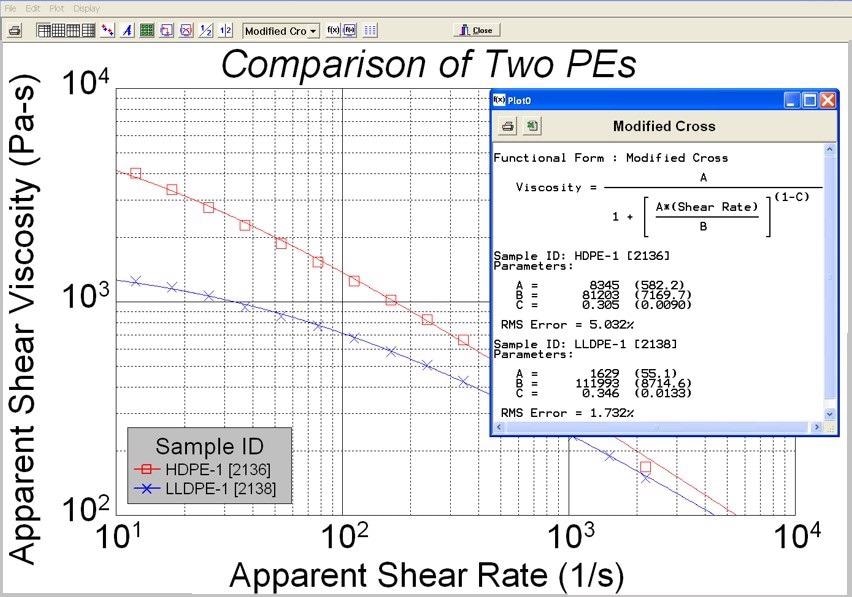
Figure 3. Modified Cross model fitting analysis. Image Credit: Dynisco
A more complete description of the flow curve is represented by this model, which combines the Power-law and Newtonian regions. The zero-shear viscosity value can be effectively captured using this model.
References
- J.M. Dealy, and K.F. Wissbrun, Melt Rheology and its Role in Plastics Processing: Theory and Applications, Van Nostrand Reinhold, New York (1990).
- C.L. Rohn, Analytical Polymer Rheology, Hanser (1995).
Acknowledgments
Produced from materials originally authored by Azadeh Farahanchi from Dynisco.

This information has been sourced, reviewed and adapted from materials provided by Dynisco.
For more information on this source, please visit Dynisco.