The Need for Pressure Measurement in Extrusion
It is necessary to keep both the output rate and the melt condition constant (1,2) in order to maintain the dimensional stability needed to create extruded products that adhere to today's precise quality and tolerance specifications.
Although it is not possible to continuously measure these quantities, closely related variables like melt pressure and melt temperature may be quantified or controlled. The output rate can be considered constant (2) if there is uniform melt temperature, a constant feed condition, and constant melt pressure at the die.
In practice, melt pressure measurements are invaluable for various reasons. Minute alterations in head pressure have been related to dimensional variations in the extrudate. Studies have demonstrated that, depending on the rheological properties of the polymer melt (3), a head pressure variation of 1% is equivalent to a 1-3% alteration in extruder output.
Die pressure modifications have been demonstrated to accurately follow output rate alterations (surging), although due to changes in melt viscosity (4), they cannot be directly related to output.
Melt pressure has also been related to the cellular quality of foamed extrudates. Results show that as the extrusion pressure increases, foam density decreases, cell size decreases, and the overall quality of the foam increases (5).
Extrusion head pressure calculations can also be utilized as a diagnostic tool. Alterations in head pressure can show die or barrel heater troubles, the condition of the screen pack, material feed problems, screw/barrel wear or damage, and start up or shut down related problems (6).
Accurate pressure measurements can generally enhance product quality, improve production, protect equipment and personnel from damage, and can be utilized as a diagnostic tool. However, industry-wide data suggest that only 50% of all extruders are equipped with melt pressure sensing equipment (7).
Pressure Sensors
Although pressure is not a fundamental quantity, it is derived from force and area, which in turn are derived from mass, length and time, which are fundamental quantities. Most practical pressure measurement devices are elastic transducers and utilize a diaphragm, Bourdon tube, or bellows as their sensitive element.
The gross deflection of these elements may actuate a pointer/scale readout directly via suitable linkage, or by one means or another, the motion may be transducer to an electrical signal. Strain gages bonded to diaphragm actuate beams are largely utilized to measure local strains that are directly related to pressure (8).
When used in extrusion applications, melt pressure sensors must adhere to certain requirements. The sensors are exposed to high pressures (up to 30,000 psi) and high temperatures (up to 700 °F) for long periods of time and may work in corrosive or abrasive environments. The most commonly employed types of melt pressure sensors are outlined below.
Bourdon Tube
The silicone grease filled Bourdon tube gage, equipped with a grease gun fitting at the dial end of the gage for filling and cleaning obstructions, is the most simple variety of melt pressure sensor.
In order to minimize contamination, these gages should be located on the underside of the equipment as the polymer melt is in direct contact with the silicone grease (9, 10). These gages may become plugged with polymer without proper attention.
Routine maintenance during extruder operation will lead to grease contamination of the extrudate (11). Bourdon gages cannot act as the sensing element for control systems, but they are able to monitor pressure.
To some extent, the Bourdon tube gage is still employed, but other mechanical sensors have been developed to carry out a similar function, without the drawbacks that are associated with direct grease/melt contact.
Mechanical Pressure Sensors Incorporating a Lower Diaphragm
These mechanical pressure sensors work on a similar principle to that of the silicone grease filled Bourdon gages, but they possess a solid diaphragm between the polymer melt and strain transfer media. This eliminates the contamination problems (9).
The motion of the diaphragm in contact with the melt is transferred to the gage portion of the instrument by utilizing a push rod or a fluid-filled capillary. These sensors are better than the grease filled Bourdon gage, and typically work as melt pressure monitors, although pneumatic types can act as the sensing element for melt pressure control systems.
Electronic Pressure Transducers
Electronic Melt Pressure sensors or transducers are versatile and accurate instruments. They possess a metal diaphragm flush with the extruder's die or barrel wall. The motion of this lower diaphragm is transferred to the elastic electronic displacement transducer that is not close to the process heat by a push rod or fluid-filled capillary tube (4).
Figure 4 shows the internal structure of the capillary transducer stems and push rod. The upper elastic displacement transducer is mechanically deformed by the fluid filled capillary or push rod and an electrical signal proportional to the melt pressure is gathered.
Although other electronic displacement transducers, like piezoelectric elements, are widely utilized (8), bonded foil-type strain gage pressure transducers are of interest here. The electrical output pressure signals from these transducers can be shown, recorded or fed to control systems (9).
Electronic pressure transducers which utilize the fluid-filled capillary system to transfer lower diaphragm deflections to the electronic sensing element have some advantages over the push rod type. They have an increased diaphragm fatigue life, are insensitive to mounting torque, usually have higher accuracy (generally ±0.5 of the full-scale range as opposed to ±1.0% of the full-scale range for push rob types), and have the ability to incorporate flexible stems if needed (12).
One concern to processors of certain products, for example, food packaging, is the liquid mercury fill in the capillary system, around 0.003 cubic inches per transducer. Lower diaphragm rupture could lead to extrudate contamination, which would not happen with push rob transducers.
Push rob transducers are unfortunately sensitive to mounting torque and are thought to be sensitive to ambient temperature alterations (12). This study was carried out to establish the relative effect of ambient temperature fluctuations on the output signal of both push rod and fluid-filled capillary type transducers. This study is outlined below.
Experimental
Pressure Variation Vs. Production Variation
A simulated surging experiment was carried out in order to show the importance of melt pressure measurement in extrusion and to obtain a relationship between melt pressure variation and product dimensional variation.
The experimental equipment was made up of a 2½ inch, 24:1 L/D ratio, Welex Extruder, fixed with a strand die and a pressure valve. Low melt index Arco 2800 F"Dylan" LDPE was extruded through the die, with the head pressure valved to 2500 psig.
A mechanical device that was fixed to the pressure valve caused the valve to screw in and out of the melt stream regularly, leading to sinusoidal variations in the melt pressure.
The frequency of oscillation (∆P) was varied. The strand was then hauled off at a constant rate, with a draw-down ratio of 1.2:1, cooled, and the diameter measured at increments across the length of the strand.
Pressure Transducer Environmental Study
Run 1: ‘Normal’ Extrusion Environment
The extruder shown schematically in Figure 3 and also described above was employed for this study. An extrusion die with melt pressure transducer ports located 180 ° apart but at an equivalent length along the die was utilized.
A fluid-filled capillary transducer (Dynisco Model PT420A-1M-6) was placed in pressure port A and a push rod transducer (Dynisco Model PT411-1M-6) was placed in pressure port B. The positions were later swapped. Both transducers had a range of 0-1000 psig and an overall accuracy rated at ±1.0% of the full-scale range.
The melt pressure at locations A and B were recorded when Arco 6560 ‘Super Dylan’ HDPE was extruded. Ambient air temperatures in the vicinity of the extrusion die were also collected.
Run 2: Stem Environmental Temperature Chamber
Figure 7 shows the environmental chamber, which was mounted around the extrusion die. This chamber was created to isolate the ambient temperature conditions where the stem portion of the pressure transducers operate.
Air at a rate of 40 cubic feet/minute and at controlled temperatures was circulated through the chamber. The transducer outputs were recorded while extruding at steady state conditions, as controlled alterations in the environmental temperature were acting on the transducer stems.
Run 3: Full Transducer Environmental Chamber
The larger chamber, which can be seen in Figure 11, was mounted around the extrusion die for this test. This chamber was utilized to establish how environmental temperature changes acting on the full transducer, i.e., the stem and upper strain gage housing, affect the output signals of the transducers during steady state extrusion.
The results, which were gathered from Runs 1,2 and 3, were employed to establish the relative magnitude of the ambient temperature sensitivity of the transducer components.
Results and Discussion
The results of the simulated surge experiment demonstrate that product dimensional variation can be related to alterations in melt pressure. How an extruded strand diameter changes with a sinusoidal disturbance in the process is shown in Figure 1. The dimensional variation’s frequency correlates well with that of the disturbance.
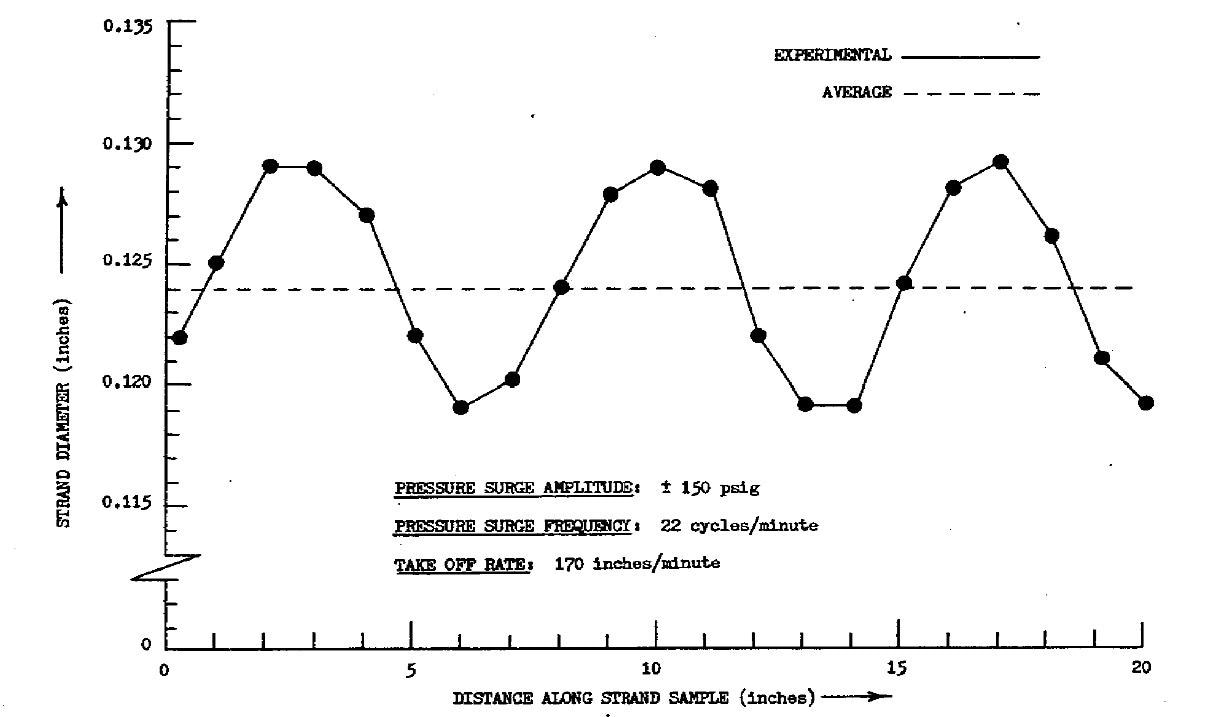
Figure 1. Strand diameter vs. Strand length; simulated melt pressure surge experiment. Image Credit: Dynisco
The dimensional uniformity of the product decreases as the amplitude of pressure fluctuation increases, as shown in Figure 2 shows that. Although melt pressure instability was only simulated in the experiment, it is clear from the results that even minute alterations in melt pressure lead to a change in the extruder's output.
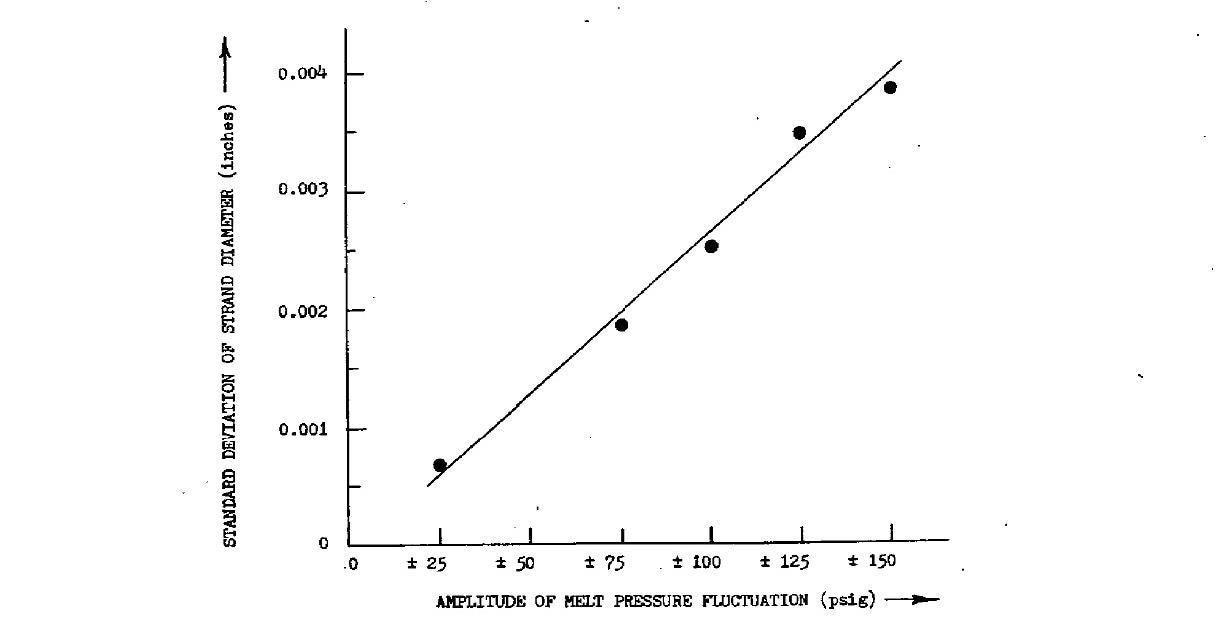
Figure 2. Extrudate variation vs. Melt pressure variation; simulated surge experiment.
Surge frequency: 22 cycles/minute
Average strand diameter: 0.124 inches
Average melt pressure: 2500 psig
Extrudate drawdown ratio: 1.2:1.
Image Credit: Dynisco
Figure 5 shows the results of the ambient temperature study, Run 1. The pressure output signals of both the capillary transducer and push rod are illustrated as a function of time. The transducers operated in the ‘normal’ ambient temperature environment and were positioned as shown in Figure 3.
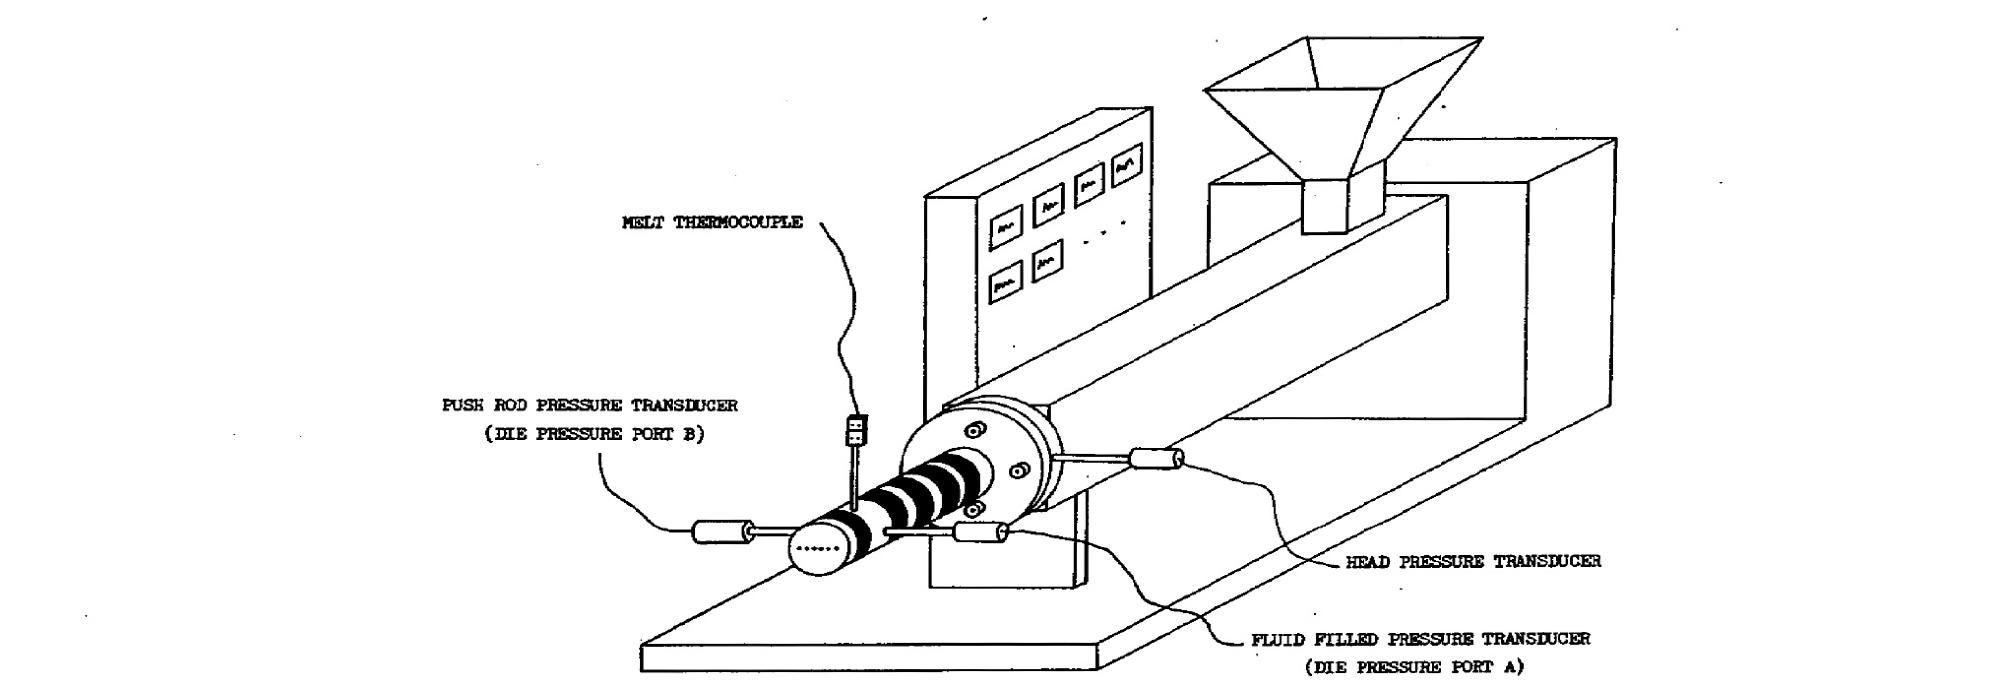
Figure 3. Push rod and fluid filled pressure transducer locations. Image Credit: Dynisco
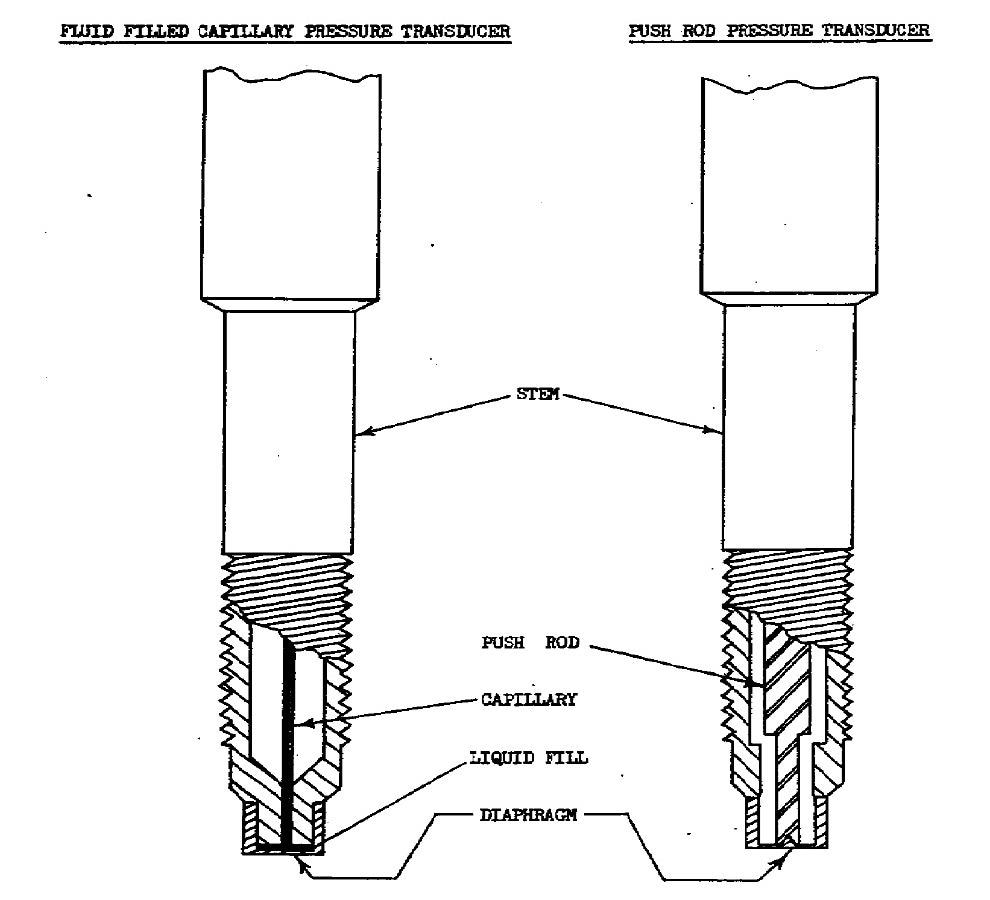
Figure 4. Internal stem construction; push rod and fluid filled pressure transducers. Image Credit: Dynisco
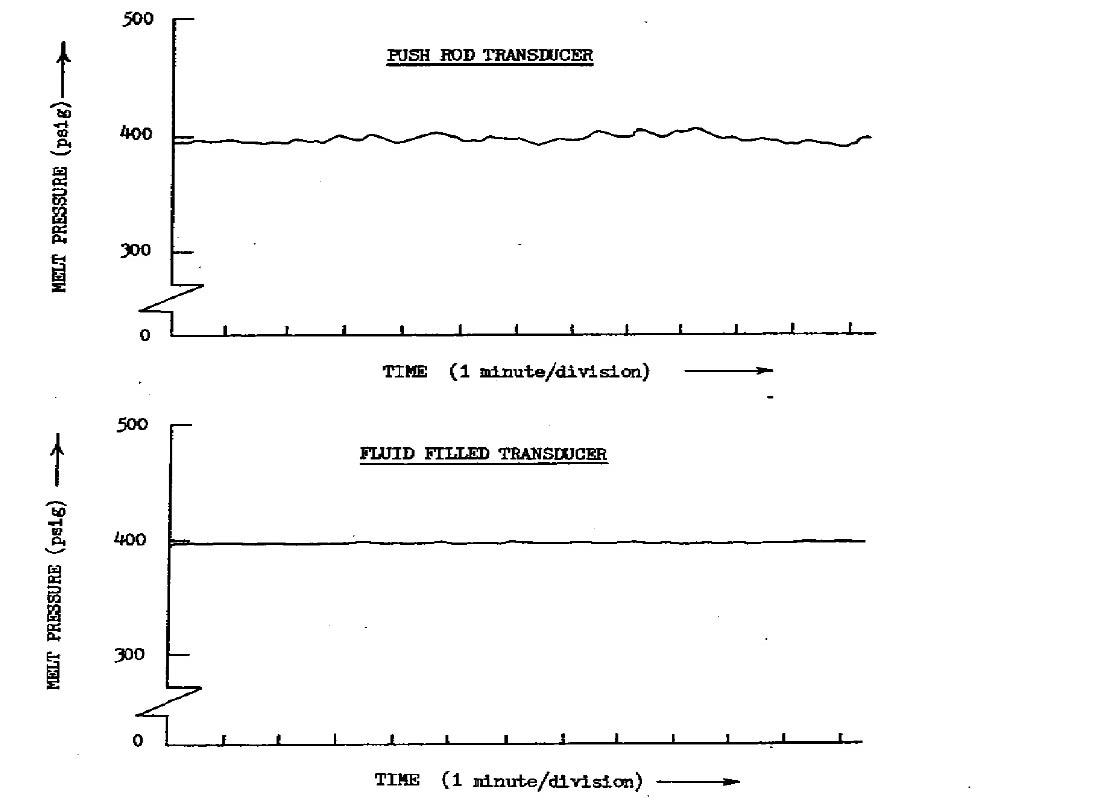
Figure 5. Transducer outputs vs. Time; steady state extrusion, natural environment. Image Credit: Dynisco
It would be expected that the melt pressure recorded at ports A and B would be equivalent during steady state extrusion conditions. The average values which were gathered are equivalent, but the push rod transducer indicates a pressure fluctuation of 20 psig or 0.5% of the full-scale value.
The difference in apparent melt pressure stability was worth examining, although both transducers were operating within their overall accuracy limits. Thermocouples were placed in the vicinity of the die in order to assess the pressure transducers operating environment.
Figure 6 exhibits that the air temperature near the extrusion die is changing constantly and that within a few seconds, it can change by up to 100 °F. The operating environmental temperature of the transducer stems was controlled by utilizing the apparatus in Figure 7 for Run 2.
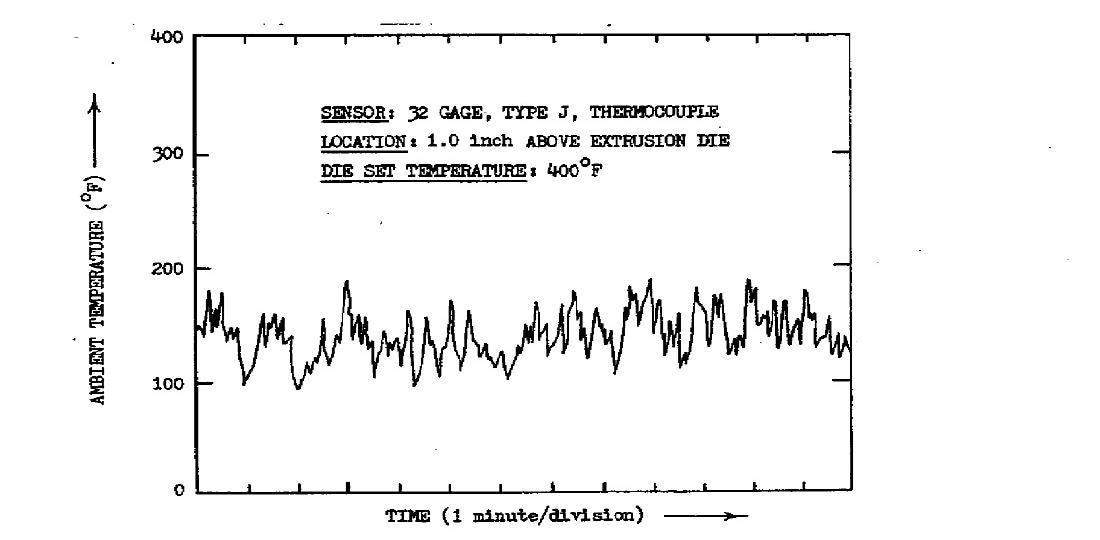
Figure 6. Ambient temperature near an extrusion die vs. Time, during steady state extrusion. Image Credit: Dynisco
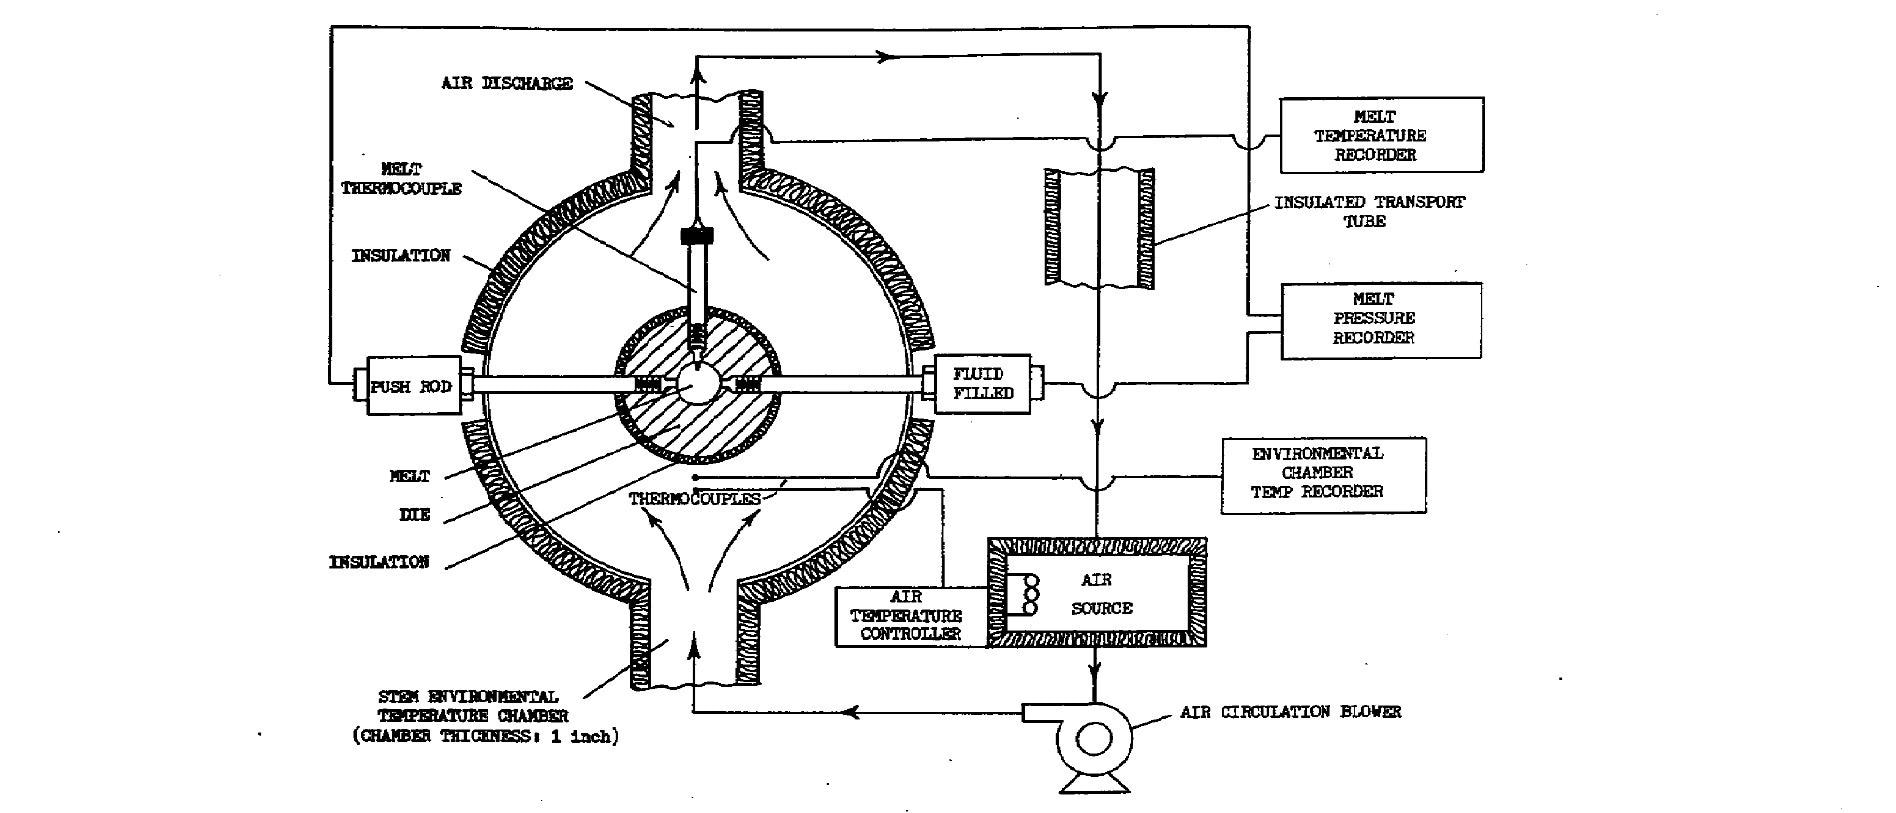
Figure 7. Die mounted, pressure transducer stem environmental temperature control apparatus. Image Credit: Dynisco
Figure 8 demonstrates that both transducers show a melt pressure fluctuation of just 0.5% of the capillary transducer when operating in the ‘natural’ environment when the environmental temperature surrounding the transducer stems is constant.
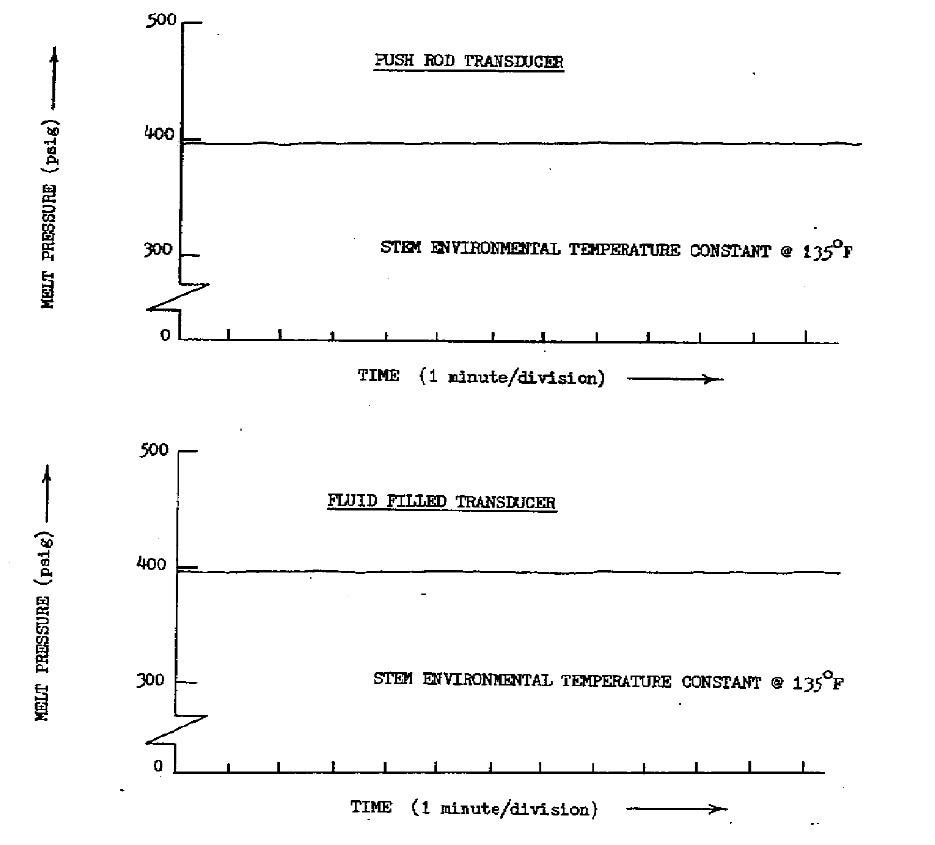
Figure 8. Transducer outputs vs. Time; steady state extrusion, with transducer stems exposed to a constant environmental temperature. Image Credit: Dynisco
It can be seen from this data the true magnitude of melt pressure fluctuation demonstrated by the push rod transducer. The error was because of changing ambient temperature conditions, similar to those which can be seen in Figure 6. In both situations, the capillary transducer performed well.
The environmental temperature around the transducer stems was altered in a controlled manner to further demonstrate this point. Figure 9 illustrates that a gradual ramp change in the operating environment of around 1 °F/minute, had no effect on the output of either transducer.
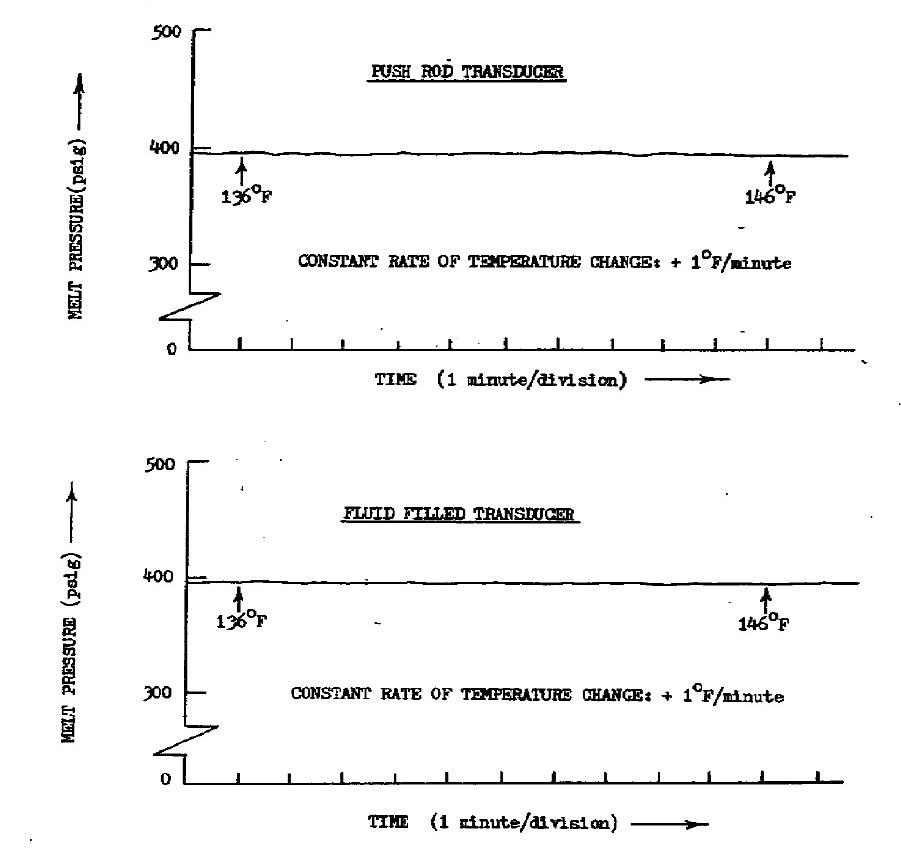
Figure 9. Transducer output responses to a slow ramp increase in this stem environmental temperature during steady state extrusion. Image Credit: Dynisco
A large step change in temperature, from 175 °F to 80 °F had a significant temporary effect on the output of the push rod transducer, 7.5% of the full-scale range, and minimal or no change in the output of the capillary transducers, Figure 10 shows this result.
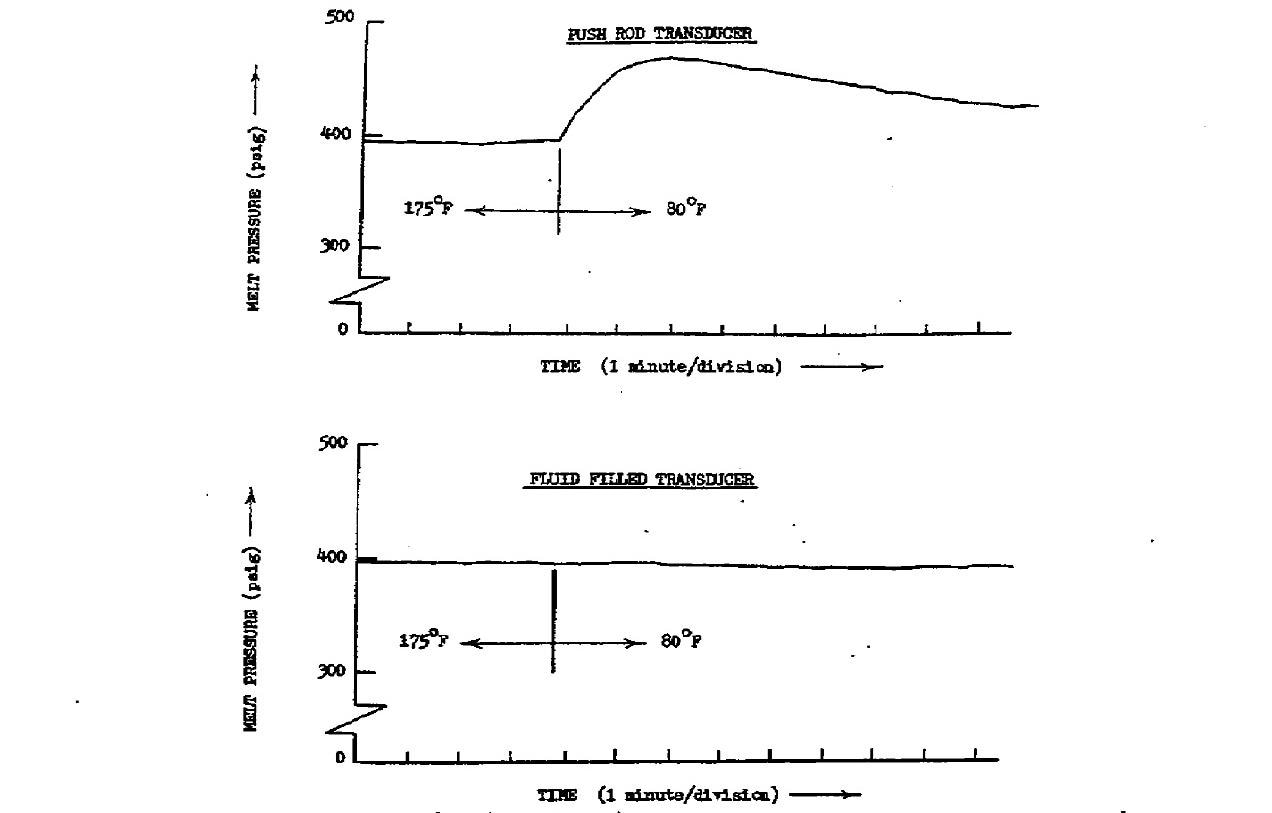
Figure 10. Transducer output responses to a step decrease in the stem environmental temperature during steady state extrusion. Image Credit: Dynisco
The melt pressure itself remained constant, as confirmed by independent measurement of melt pressure and temperature. This huge alteration in the push rod transducer's output was because of environmental effects, i.e., changes in the air temperature around the transducer's stem.
The result can be explained qualitatively by reasoning that, to some extent, the thermal expansion or contraction of the push rod lags behind that of the stem. A decrease in the ambient temperature will lead to a reduction in the stem length, leading the relatively longer push rod to exert a strain on the sensing element, indicating a higher pressure.
The push rod should contract if given enough time and this trend can be seen in Figure 10. It is the nature of the semiflexible capillary system and the small volume of fluid contained within that accounts for the temperature stability for fluid-filled transducers.
Although large steady state step changes in temperature of this type are unlikely to happen, large pulse changes in the ambient operating temperature are common, leading to the result seen in Figure 5.
If the push rod transducer was to act as the sensing element in a closed loop melt pressure control system, then a problem of this type would be particularly concerning. The control system would actually be destabilizing the melt pressure when attempting to remove the ‘apparent’ melt pressure fluctuation.
Ambient temperature changes on the full transducer (stem and upper strain gage housing) were simulated in Run 3 by utilizing the apparatus seen in Figure 11. It was discovered that alterations in the upper strain gage housing environmental temperature had no significant influence on the output signal for either type of transducer.
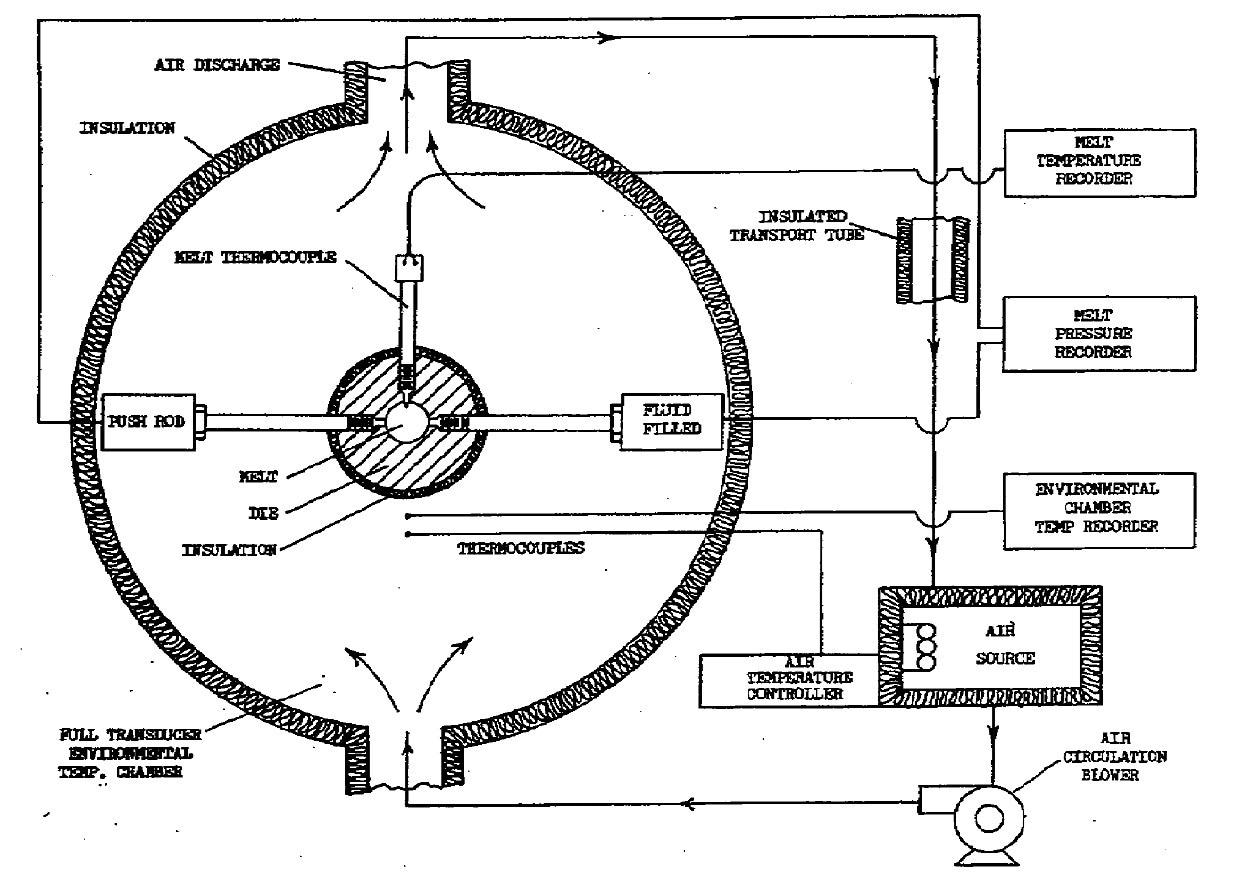
Figure 11. Die mounted, full pressure transducer environmental temperature control apparatus. Image Credit: Dynisco
Results have also demonstrated that by applying a wrap of thermal insulation around the stem of the transducer, the overall performance of the push rod transducer could be enhanced.
Conclusion
Alterations in extrusion melt pressure can be due to dimension changes in the extruded product. The operating environment of melt pressure transducers may be subject to rapid pulse type changes in temperature, with a magnitude as large as 100 °F.
It was found that the stem portions of the push rod electronic strain gage pressure transducers assessed are sensitive to thermal shock. Changes in the ambient operating temperature affect the output signals of these transducers, showing melt pressure instability, when actually the melt pressure may be stable.
The Fluid-Filled Capillary Strain Gage Pressure Transducer studied is not influenced by ambient temperature fluctuations much. Thermal insulation placed around the stem portion of push rod strain gage pressure transducers can reduce undesirable ambient temperature effects somewhat.
References
- S.J. Chen, Plastics Design and Processing, 15 (8), 19 1975.
- D. Fingerle, D., SPE ANTEX, 24, 551 (1978).
- W. Rahim, Plastics Engineering, 35 (9), 51 (1979).
- I. Patterson and T. DeKerf. SPE ANTEC, 24, 483 (1978).
- N. Schott and C. Weininger, SPE ANTEC, 23, 549 (1977).
- Dynisco, Newsletter, Transducers News, June (1983).
- R, Van Hooft, Design News, 39 (14), 73 (1983).
- E. Doebelin, "Measurement Systems, Application and Design", McGraw Hill, Inc., New York (1983) 406.
- S. Levy, "Plastics Extrusion Technology Handbook", Industrial Press, New York, (1981)111
- E.G. Fisher, "Extrusion of Plastics", John Wiley and Sons, New York, (1976) 210.
- A. Griff, "Plastics Extrusion Technology", Robert Krieger Publishing Co., Malabar, Florida (1981) 20, 302.
- R. Rowland, Ed., British Plastics, 42 (12), 109 (1969).

This information has been sourced, reviewed and adapted from materials provided by Dynisco.
For more information on this source, please visit Dynisco.