Gas sensors are typically employed for continuous monitoring of gases and chemicals. It is a vital requirement in process control in industries, biomedical applications, and environmental monitoring.
Gas sensors may be bulky due to Gas-chromatography/Mass-spectrometry and Optical Absorption Spectroscopy components compared to small sensors based on the surface acoustic wave, electrochemistry, semiconducting metal oxide (SMO), etc. Most portable sensors have nanoscale structures for various sensing applications.
The semiconducting metal oxide (SMO) based gas sensor devices are of small size, cost-effective, and have the ease of fabrication and scalability for bulk production. The gas sensing mechanism of an SMO material depends on the change in resistance developed due to the oxidation/reduction reaction it experiences because of the gases found in its immediate environment. This sensor is mainly known as a chemi-resistor.
Semiconducting metal oxides for gas sensing have their disadvantages, such as broad selectivity. However, this can be converted into an advantage by employing an array of sensors combined with suitable pattern recognition tools and is deemed a promising approach. By introducing deliberate discrimination among the sensors of array to any particular target gas of known concentration, the broad selectivity can be employed as an advantage.
This discrimination can be introduced by employing various sensing materials, adding dopants and catalysts, changing the operating temperature, and combinations of all these.
Current research shows that the temperature modulation (altering the operating temperature of the sensor) is enough to tailor the response of the sensor and introduce discrimination among the sensors of an array.
The researchers employed intrinsic, intentionally undoped ZnO nanostructures grown by microwave-assisted wet chemical growth to illustrate. The study elaborates the gas sensing response of intrinsic, intentionally undoped ZnO nanomaterial grown by microwave-assisted wet-chemical growth, to three gases: oxygen, carbon dioxide, and carbon monoxide.
Methodology
ZnO nanostructures were developed using microwave-assisted wet-chemical growth using the reagents Zn(CH3COO)22H2O (99.99%, Sigma Aldrich) and KOH (99.99%, Sigma Aldrich), analytical grade. The ZnO nanomaterial was then characterized for structural and compositional characteristics and surface morphology.
Later, the grown ZnO nanomaterial was dropcasted over inter-digitated electrodes (gold inter-digitated electrode (IDE) screen printed on alumina substrates with an interdigit spacing of 200 μm) to create chemi-resistive sensors (Figure 1).
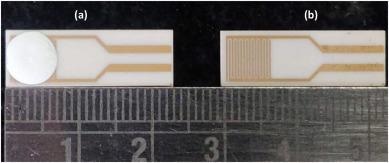
Figure 1. (a) ZnO nanomaterial drop-casted over IDE and (b) inter-digitated electrode (IDE). Image Credit: Radhakrishnan and Geetika, 2021
Figure 2 depicts the response of the sensor to analyte gases, O2, CO, and CO2 measured in a gas-sensing set-up.
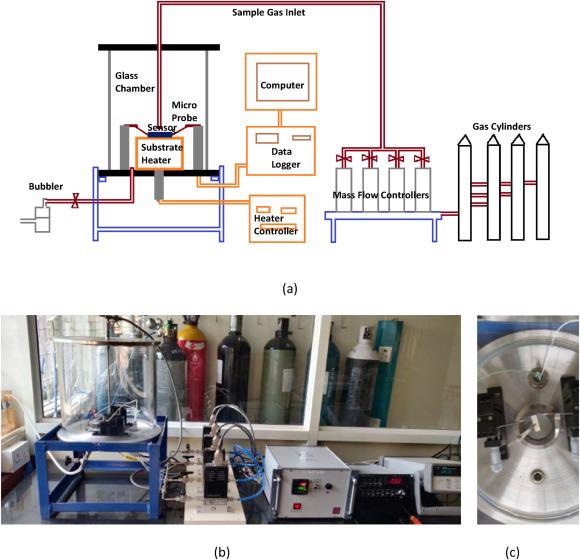
Figure 2. (a) Schematic of the gas sensing set-up, (b) its image, and (c) sensor over the heater with micro-probes. Image Credit: Radhakrishnan and Geetika, 2021
The researchers supplied the analyte gases from three cylinders containing calibrated gas mixtures, and also diluted the gases further by introducing Nitrogen (N2 cylinder with the purity of 99.99%) as the carrier gas, to accomplish the final required concentration levels.
The researchers continuously logged the sensor resistance. Initially, 400 ccm flow of inert carrier gas N2 was used to measure the sensor baseline resistance. Later, a specified flow of analyte gas corresponding to a desired final concentration was added to it to measure the final resistance of the sensor. Measurements were repeated multiple times.
Results and Discussion
Gas Sensing Material
ZnO morphological analyses show that they are in the form of bunches of flower-like super-structures, where each flower-like structure has a central node from which cones/hexagonal-rods of ZnO extend/diverge (Figure 3).
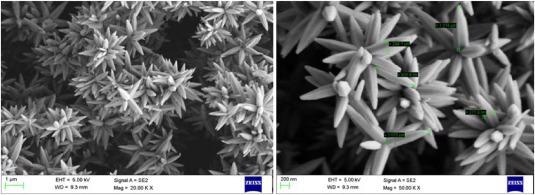
Figure 3. Typical SEM images of the ZnO nanostructures used in this study. Image Credit: Radhakrishnan and Geetika, 2021
Figure 4 shows the X-ray diffraction pattern of the ZnO nanomaterial. The peaks of the XRD pattern match with the hexagonal Wurtzite structure of ZnO.
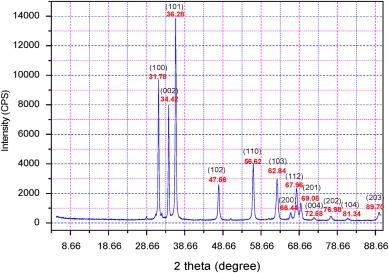
Figure 4. Typical X-ray diffraction spectra of the ZnO nanostructures used in this study. Image Credit: Radhakrishnan and Geetika, 2021
Figure 5 shows the Energy Dispersive Spectra (EDS) and the atomic ratio of elements in the ZnO nanostructures; the spectra do not reveal any foreign element in the grown material.
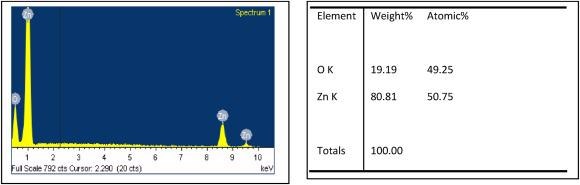
Figure 5. Typical (a) EDS spectra and (b) atomic ratio of elements in the ZnO nanostructures used in this study. Image Credit: Radhakrishnan and Geetika, 2021
The typical XPS spectra of the ZnO nanomaterial is shown in Figure 6 and it depicts the Zn-2p and O-1s core-level regions.
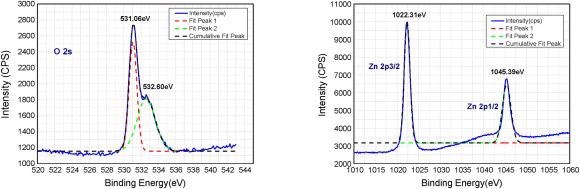
Figure 6. XPS of the ZnO nanostructures used in this study. Image Credit: Radhakrishnan and Geetika, 2021
Gas Sensing Characterization
At the time of the gas-sensing measurements, the baseline resistance (Rb) of the sensor, the final resistance (Rs) of the sensor, continuous logging of the resistance values to obtain the response time were measured along with other parameters like change-in-resistance (Rs-Rb) and sensitivity.
Sensor Response to Oxygen
Figure 7 depicts the typical sensor response to O2 and it was noted that the exposure of the ZnO nanomaterial to O2 gas increases the sensor resistance.
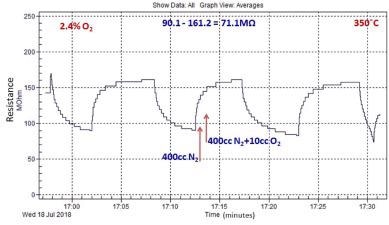
Figure 7. Typical O2 sensing response of ZnO nanomaterial grown by microwave-assisted wet chemical method. Image Credit: Radhakrishnan and Geetika, 2021
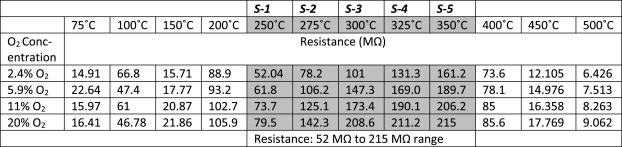
Figure 8 shows the sensor resistance with O2 flow as a function of sensor operating temperature for all the measured O2 concentrations. The corresponding resistance data is depicted in Table 1.
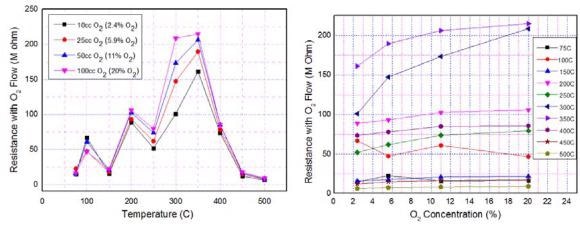
Figure 8. Typical (a) temperature and (b) concentration dependence of O2 sensing characteristics of ZnO nanomaterial. Image Credit: Radhakrishnan and Geetika, 2021
Table 1. Sensor resistance data, for O2 sensing, at five operating temperatures 250 °C, 275 °C, 300 °C, 325 °C, and 350 °C. Source: Radhakrishnan and Geetika, 2021
Sensor Response to Carbon Monoxide
Figure 9 shows the typical sensor response of ZnO nanomaterial exposure to Carbon Monoxide. It can be noted that the resistance of the sensor is reduced.
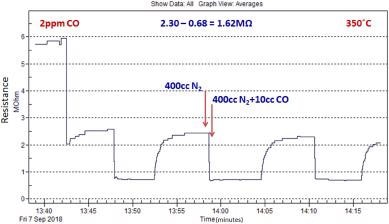
Figure 9. Typical CO sensing response characteristics of ZnO nanomaterial grown by microwave-assisted wet chemical method. Image Credit: Radhakrishnan and Geetika, 2021
Figure 10 shows the sensor resistance with CO flow as a function of operating temperature. The resistance is seen to increase with temperature.
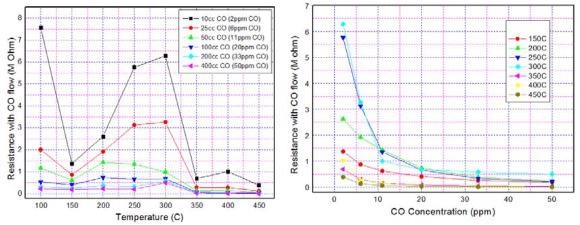
Figure 10. Typical (a) temperature-dependent and (b) concentration-dependent CO sensing characteristics of ZnO nanomaterial. Image Credit: Radhakrishnan and Geetika, 2021
Figure 10(b) shows the sensor resistance as a function of CO concentration. The dependence is exponential.
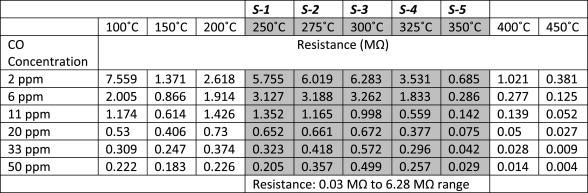
Table 2 also depicts the resistance data corresponding to graph 10(a) and it confirms that by modulating/fixing the sensor operating temperature, discrimination can be introduced among the sensors of an array for any particular CO concentration.
Table 2. Sensor resistance data for CO sensing, at five fixed temperatures 250 °C, 275 °C, 300 °C, 325 °C, and 350 °C. Source: Radhakrishnan and Geetika, 2021
Sensor Response to Carbon Dioxide
Figure 11 depicts the typical response of ZnO nanomaterial and was seen that the resistance decreases on exposure to CO2.
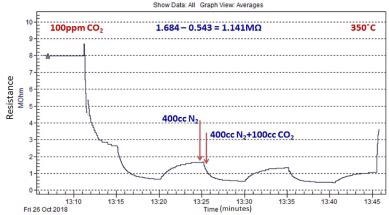
Figure 11. Typical CO2 sensing response of ZnO nanomaterial grown by microwave-assisted wet chemical method. Image Credit: Radhakrishnan and Geetika, 2021
Figure 12(a) shows the sensor resistance with CO2 flow, as a function of sensor operating temperature. It is seen that the resistance increases with temperature, attains a maximum at 350 °C, and later decreases for further increase in temperatures.
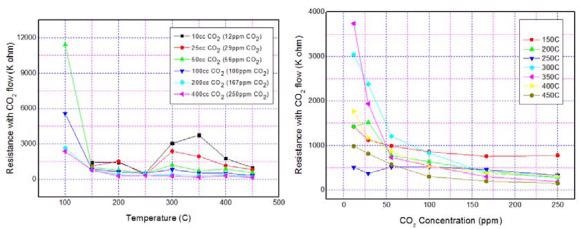
Figure 12. Typical (a) temperature and (b) concentration dependence of CO2 sensing characteristics of ZnO nanomaterial. Image Credit: Radhakrishnan and Geetika, 2021
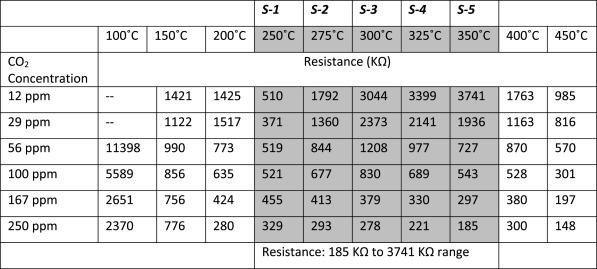
The sensor resistance as a function of CO2 concentration is depicted in Figure 12(b). It can be noted that the sensor resistance decreases with the CO2 concentration. Table 3 depicts the resistance data corresponding to graph 12(a).
Table 3. Sensor resistance data for CO2 sensing, at temperatures 250 °C, 275 °C, 300 °C, 325 °C, and 350 °C. Source: Radhakrishnan and Geetika, 2021
Applications
The proposed sensor is capable of analyzing the gases CO, CO2, and O2 in confined environments. Monitoring of gases and chemicals is a vital requirement, particularly in confined environments inhabited by humans such as bunkers in extremely cold regions, or submarine environments.
Continue reading: Self-Calibrating Gas Sensor Technology - TruCal®
Journal Reference:
Radhakrishnan, J K and Geetika, M K (2021) Effect of temperature modulation, on the gas sensing characteristics of ZnO nanostructures, for gases O2, CO and CO2. Sensors International, 2, p.10059. Available at: doi.org/10.1016/j.sintl.2020.100059.
References and Further Reading
- Fine, G F., et al. (2010) Metal oxide semi-conductor gas sensors in environmental monitoring. Sensors, 10, pp. 5469–5502. doi.org/10.3390/s100605469.
- Wetchakun, K., et al. (2011) Semiconducting metal oxides as sensors for environmentally hazardous gases. Sensors and Actuators, B: Chemical, 160, pp. 580–591. doi.org/10.1016/j.snb.2011.08.032.
- Munawar, A., et al. (2019) Nanosensors for diagnosis with optical, electric and mechanical transducers. RSC Advances, 9, pp. 6793–6803. doi.org/10.1039/C8RA10144B.
- Purohit, B., et al. (2020) Biosensor nanoengineering: design, operation and implementation for biomolecular analysis. Sensor International, 1, p. 100040. doi.org/10.1016/j.sintl.2020.100040.
- Chandra, P & Prakash, R (Eds) (2020) Nanobiomaterial Engineering Concepts and Their Applications in Biomedicine and Diagnostics, Springer.
- Kumar, A., et al. (2019) Engineered nanomaterial assisted signal-amplification strategies for enhancing analytical performance of electrochemical sensors. Electroanalysis, 31, pp. 1–16. https://doi.org/10.1002/elan.201900216.
- Mahato, K., et al. (2018) Fundamentals and commercial aspects of nanobiosensors in point-of-care clinical diagnostics. 3 Biotec, 8, p. 149. doi.org/10.1007/s13205-018-1148-8.
- Shankar, P & Rayappan, J B B (2015) Gas sensing mechanism of metal oxides: the role of ambient atmosphere, type of semiconductor and gases - a review. Science Jet, 4, p. 126.
- Buzanovskii, V A (2014) Gas chemical nanosensors with Zinc Oxide-based sensing elements. Review Journal of Chemistry, 4, pp. 276–340. doi.org/10.1134/s2079978014040013.
- Wang, Z L (2004) Zinc oxide nanostructures: growth, properties and applications. Journal of Physics: Condensed Matter, 16, pp. R829–R858. doi.org/10.1088/0953-8984/16/25/r01.
- Paraguay, F. D., et al. (2000) Influence of Al, In, Cu, Fe and Sn dopants on the response of thin film ZnO gas sensor to ethanol vapour. Thin Solid Films, 373, pp. 137–140. doi.org/10.1016/s0040-6090(00)01120-2.
- Tyagi, P. et al. (2015) Metal Oxide Catalyst assisted SnO2 thin film based SO2 gas sensor. Sensors and Actuators, B: Chemical, 224, pp. 282–289. doi.org/10.1016/j.snb.2015.10.050.
- Yamazoe, N. (1991) New approaches for improving semiconductor gas sensors. Sensors and Actuators, B: Chemical, 5, pp. 7–19. doi.org/10.1016/0925-4005(91)80213-4.
- Yamazoe, N. et al. (2003) Oxide semiconductor gas sensors. Catalysis Surveys from Asia, 7, pp. 63–75. doi.org/10.1023/A:1023436725457.
- Graunke, T., (2015) Organic membranes for selectivity enhancement of metal oxide gas sensors. Journal of Sensors, 2016, pp. 1–22. doi.org/10.1155/2016/2435945.
- Tomchenko, A. A., et al. (2003) Semiconducting metal oxide sensor array for the selective detection of combustion gases. Sensors and Actuators, B: Chemical, 93, pp. 126–134. doi.org/10.1016/s0925-4005(03)00240-5.
- Bhattacharyya, N., et al. (2008) Electronic nose for black tea classification and correlation measurements with tea taster marks. IEEE Transactions on Instrumentation and Measurement, 57, pp. 1313–1321. doi.org/10.1109/tim.2008.917189.
- Sudarmaji, A & Kitagawa, A (2015) Application of temperature modulation-SDP on MOS gas sensors: capturing soil gaseous profile for discrimination of soil under different nutrient addition. Journal of Sensors, 2016, pp. 1–11. doi.org/10.1155/2016/1035902.
- Radhakrishnan, J K & Geetika K M (2021) Growth of ZnO nanostructures: cones, rods and hallow-rods, by microwave assisted wet chemical growth and their characterization. Ceramics International, 47(4), pp. 5300–5310. doi.org/10.1016/j.ceramint.2020.10.110.
- Al-Gaashani, R., et al. (2013) XPS and optical studies of different morphologies of ZnO nanostructures prepared by microwave methods. Ceramics International, 39, pp. 2283–2292. doi.org/10.1016/j.ceramint.2012.08.075.
- Kashyout, A. B., et al. (2010) Fabrication of ZnO and ZnO:Sb nanoparticles for gas sensor applications. Journal of nanomaterials, 20, pp. 1–8. doi.org/10.1155/2010/341841.
- Capone, S & Siciliano, P (2004) Gas sensors from nanostructured metal oxides. H.S. Nalwa (Ed.), Encyclopedia of Nanoscience and Nanotechnology, vol. 3, American Scientific Publishers, pp. 769–804.
- Dhahri, R., et al. (2017) CO sensing characteristics of In-doped ZnO semiconductor nanoparticles. Journal of Science: Advanced Materials and Devices, 2, pp. 34–40. doi.org/10.1016/j.jsamd.2017.01.003.
- Zeng, Y., et al. (2012) Development of microstructure CO sensor based on hierarchically porous ZnO nanosheet thin films. Sensors and Actuators, B: Chemical, 173, pp. 897–902. doi.org/10.1016/j.snb.2012.05.090
- Dam, V. A. T., et al. (2010) Quasi 2D-ZnO thin film for CO sensing at room temperature. Procedia Engineering, 5, pp. 172–175. doi.org/10.1016/j.proeng.2010.09.075.
- Fort, A., et al. (2010) Metal-oxide nanowire sensors for CO detection: characterization and modeling. Sensors and Actuators, B: Chemical, 148, pp. 283–291. doi.org/10.1016/j.snb.2010.04.034.
- Hübner, M., et al. (2010) CO sensing mechanism with WO3 based gas sensors. Sensors and Actuators, B: Chemical, 151, pp. 103–106. doi.org/10.1016/j.snb.2010.09.040.
- Wurzinger, O & Reinhardt, G (2004) CO-sensing properties of doped SnO2 sensors in H2-rich gases. Sensors and Actuators, B: Chemical, 103, pp. 104–110. doi.org/10.1016/j.snb.2004.04.041.
- Kanaparthi, S & Singh, S G (2019) Chemiresistive sensor based on zinc oxide nanoflakes for CO2 detection. ACS Applied Nano Materials, 2, pp. 700–706. doi.org/10.1021/acsanm.8b01763.
- Dhahri, R., et al. (2015) ZnO:Ca nanopowders with enhanced CO2 sensing properties. Journal of Physics D: Applied Physics, 48(7pp), p. 255503. doi.org/10.1088/0022-3727/48/25/255503
- Kannan, P. K., et al. (2014) CO2 gas sensing properties of DC reactive magnetron sputtered ZnO thin film. Ceramics International, 40, pp. 13115–13122. doi.org/10.1016/j.ceramint.2014.05.011.
- Ostrick, B., et al. (2000) Investigation of the reaction mechanisms in work function type sensors at room temperature by studies of the cross-sensitivity to oxygen and water: the carbonate–carbon dioxide system. Sensors and Actuators, B: Chemical, 68, pp. 197–202. doi.org/10.1016/s0925-4005(00)00429-9
- Samarasekara, P., et al. (2007) CO2 gas sensitivity of sputtered zinc oxide thin films. Bulletin of Materials Science, 30, pp. 113–116. doi.org/10.1007/s12034-007-0020-y.