Individuals nowadays spend most of their time sitting and sleeping without giving much care to sitting postures. Sitting is not a problem, however sitting in the wrong posture for a longer time on a daily basis can lead to major health issues like back pain, sciatica, and cervical spondylosis.
Conventional methods to analyze patient sitting postures involve letting a patient sit on the chair of the hospital in front of an observer like a therapist or doctor, completing QAs regarding sitting postures. These investigations replaced this with a smart cushion system that combines pressure sensors and IMU to monitor the sitting behavior at the workplace, in the car, and in a wheelchair.
Sitting posture monitoring systems (SPMSs) are also employed to evaluate the real-time postures of the individual and enhance the sitting behaviors. To enhance the analysis of sitting postures, it is necessary to replace the conventional techniques and think of sophisticated techniques. The research analyzed five various sitting postures, as shown in Figure 1.
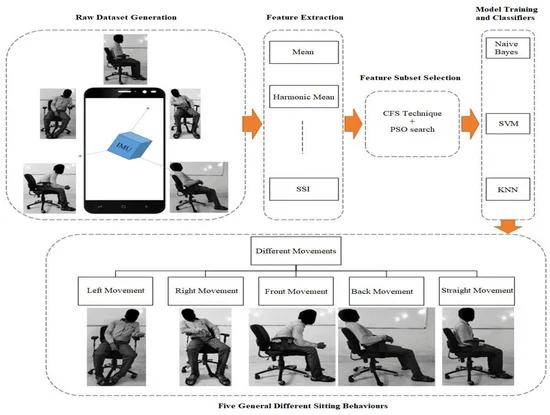
Figure 1. A framework of the proposed system. Image Credit: Sinha, et al., 2021.
Smartphones feature in daily life, containing inbuilt inertial sensors. These consist of a gyroscope, accelerometer, and magnetometer. Researchers track the body's movement with an IMU sensor attached to the upper rear trunk to track the exact movement of the spine, which in turn helps identify body postures.
Table 1 lists some of the major related articles discussed based on used sensors, classifiers, and their accuracy.
Table 1. Literature review on the basis of previous papers. Source: Sinha, et al., 2021.
| S. No |
Authors |
Type of
Sensors |
Classifiers |
Accuracy (%) |
Limitations |
| 1 |
Xu, Wenyao
et al. [4] |
Textile sensor array in a smart cushion chair |
Naïve Bayes network |
85.90 |
The recognition rate is less. |
| 2 |
Roh, Jongryun et al. [6] |
Low-cost load cells (P0236-I42) |
SVM using RBF kernel |
97.20 |
No. of subjects used is less, and power consumption is more. |
| 3 |
Taieb-Maimon, Meirav et al. [12] |
Webcam, Rapid Upper Limb Assessment (RULA) tool. |
Sliced inverse regression |
86.0 |
Analyzed only three symptom scales as back symptoms, arm symptoms, and neck pain severity. |
| 4 |
Arif, Muhammad
et al. [33] |
Colibri wireless IMU |
kNN |
97.90 |
Dataset tested is small, and the optimal set of sensors need to be placed at the appropriate locations on the body. |
| 5 |
Zdemir et al. [34] |
The MTw sensor unit, MTw software development kit |
Random forest |
90.90 |
Cost is high, and the convergence time is more. |
| 6 |
Rosero-Montalvo et al. [18] |
Ultrasonic sensor, pressure sensor, Arduinonano, LiPobattery |
kNN |
75.0 |
Accuracy reported is much less. |
| 7 |
Benocci et al. [35] |
FSR, digital magnetometer, accelerometer |
kNN |
92.70 |
The number of subjects used in the experiment is less. |
| 8 |
Shumei
Zhang
et al. [36] |
HTC smartphone
(HD8282) |
kNN |
92.70 |
A posture-aware reminder system can be attached. |
Framework of Smartphone-Based Sitting Detection
In the approach discussed, the inertial sensor of the smartphone is employed as a sitting behaviors detector. The research also prioritized data access, cost, compatibility, unobtrusive use, and system deployment.
The system gathered data for the five different static movements of the body while sitting in the chair (Figure 1). The smartphone was attached to the rear upper trunk at second thoracic vertebrae T2 to gather the measurable dataset (Figure 2). The system can identify the postures when the subject moves from the correct sitting posture to incorrect sitting postures.
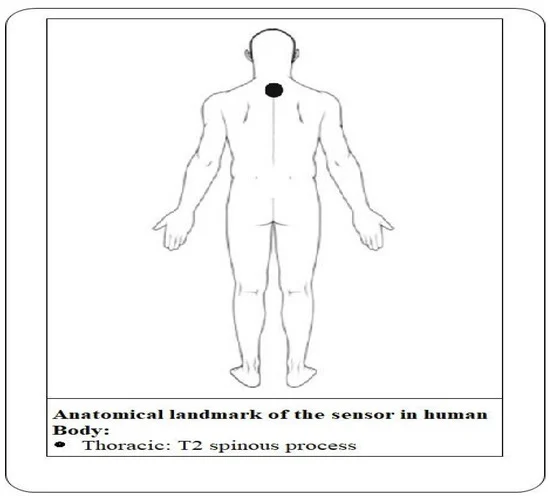
Figure 2. Wearable sensor location in the human body. Image Credit: Sinha, et al., 2021.
Data Collection and Preprocessing
The study created a new dataset for analyzing human sitting behavior while sitting on a chair. A total of five general movements were taken into consideration - Left movement, Right movement, Front movement, Back movement, Straight movement.
The activities were carried out by the people under the supervision of an instructor to generate the dataset effectively. Table 2 shows the total number of instances for each activity, and the same is analyzed with a pie chart in Figure 3.
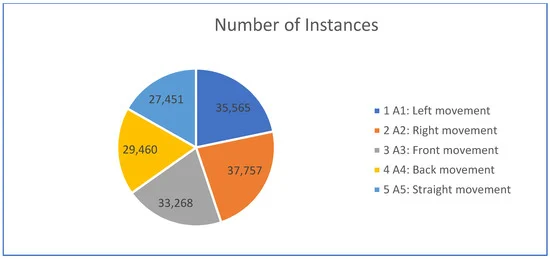
Figure 3. Pie chart representation for a number of instances. Image Credit: Sinha, et al., 2021.
Table 2. Number of instances per activity. Source: Sinha, et al., 2021.
| S. No |
Physical Activities |
No. of Instances |
Time (in Seconds) |
| 1 |
A1: Left movement |
35,565 |
712 |
| 2 |
A2: Right movement |
37,757 |
756 |
| 3 |
A3: Front movement |
33,268 |
665 |
| 4 |
A4: Back movement |
29,460 |
590 |
| 5 |
A5: Straight movement |
27,451 |
549 |
| |
Total |
163,501 |
3272 |
Hardware Platform
Researchers used the One Plus 6 smartphone as a hardware platform for dataset gathering. Data pre-processing is a vital step after data collection and before feature extraction.
Feature Extraction
The feature vectors are calculated from the collected dataset. The total acceleration of the accelerometer, gyroscope, and magnetometer are also calculated.
Morphological Features
The morphological features comprise the study of the morphological features like structure and shape from the dataset of sitting behaviors.
Entropy-Based Features
The article introduces two kinds of entropy-based features - wavelet entropy, the measure of relative energies in various signals, and is employed to determine the degree of the disorder and log energy entropy (LEE).
Feature Subset Selection
In this study, the researchers employed a filter method called correlation-based feature selection (CFS) as a feature selection algorithm. Table 3 shows the subset of features depending on their contributions.
Table 3. Selected features with contribution ratings. Source: Sinha, et al., 2021.
| S. No |
Selected Features |
|
| 1 |
Total-acceleration |
| 2 |
Total-magnetometer |
| 3 |
Y-accelerometer-MAV |
| 4 |
X-gyroscope-MAV |
| 5 |
Y-gyroscope-MAV |
| 6 |
Y-magnetometer-MAV |
| 7 |
X-accelerometer-HM |
| 8 |
X-gyroscope-HM |
| 9 |
Y-accelerometer-Var |
| 10 |
Z-accelerometer-Var |
| 11 |
Z-magnetometer-Var |
| 12 |
X-gyroscope-SD |
| 13 |
Y-gyroscope-SD |
| 14 |
X-magnetometer-SD |
|
|
| 15 |
Z-magnetometer-SD |
| 16 |
Z-accelerometer-skewness |
| 17 |
X-gyroscope-skewness |
| 18 |
Y-gyroscope-skewness |
| 19 |
Z-gyroscope-skewness |
| 20 |
Y-magnetometer-skewness |
| 21 |
Y-accelerometer-LEE |
| 22 |
Y-magnetometer-LEE |
| 23 |
X-gyroscope-SSI |
| 24 |
X-accelerometer-WE |
| 25 |
X-gyroscope-WE |
| 26 |
X-magnetometer-WE |
| 27 |
Y-magnetometer-WE |
The scientists combined the CFS technique and particle swarm optimization (PSO) search technique, a total of 27 features were selected out of 85 calculated features (Table 3).
Sitting Behavior Recognition Techniques
This article used three classifier techniques and compared them to the most popular recognition techniques like support vector machine (SVM), K-nearest neighbor (KNN), and naive Bayes after feature selection algorithm to recognize the sitting behaviors.
Results and Discussion
MATLAB R2021a was employed to carry out all calculations and analyses of the dataset of human sitting behaviors of office workers in the office environment.
Performance Analysis of Classifiers with Feature Selection of Accelerometer, Gyroscope, and Magnetometer
The performance evaluation of the KNN, naive Bayes, and SVM classifiers for feature selection with a gyroscope, accelerometer, and magnetometer is illustrated in Table 4. This table also depicts the comparison of the performance of each classifier for all five sitting behaviors.
Table 4. Classifier results with feature selection of accelerometer, gyroscope, and magnetometer. Source: Sinha, et al., 2021.
| S. No |
Activities |
KNN
(K = 3) |
KNN
(K = 5) |
KNN
(K = 7) |
KNN
(K = 11) |
SVM |
Naive
Bayes |
| 1 |
A1: Left movement |
99.20 |
99.91 |
99.91 |
99.92 |
99.99 |
98.51 |
| 2 |
A2: Right movement |
99.97 |
99.97 |
99.97 |
99.95 |
99.98 |
99.06 |
| 3 |
A3: Front movement |
99.96 |
99.96 |
99.96 |
99.94 |
99.98 |
99.15 |
| 4 |
A4: Back movement |
99.67 |
99.72 |
99.70 |
99.68 |
99.76 |
91.89 |
| 5 |
A5: Straight movement |
99.89 |
99.58 |
98.31 |
97.68 |
99.77 |
98.71 |
And Table 5 shows the confusion matrix of all five sitting behaviors by the SVM classifier.
Table 5. Confusion matrix of SVM classifier of selected features of accelerometer, gyroscope, and magnetometer. Source: Sinha, et al., 2021
| |
S. No |
Activity |
A1 |
A2 |
A3 |
A4 |
A5 |
| True Class |
1 |
A1 |
10,669 |
0 |
0 |
0 |
1 |
| 2 |
A2 |
1 |
11,476 |
0 |
0 |
0 |
| 3 |
A3 |
1 |
0 |
10,055 |
1 |
0 |
| 4 |
A4 |
0 |
0 |
0 |
8762 |
21 |
| 5 |
A5 |
0 |
0 |
2 |
16 |
8044 |
| |
|
|
Predicted Class |
Performance Analysis of the Classifiers with Feature Selection of Accelerometer and Gyroscope
Table 6 shows the results of classifiers for feature selection employing accelerometer and gyroscope sensors and Figure 4.
Depicts the overall comparison of classifier results with all input postures.
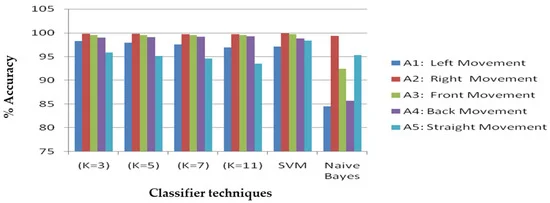
Figure 4. Different classifier results with feature selection of accelerometer and gyroscope. Image Credit: Sinha, et al., 2021.
Table 6. Classifiers result with feature selection of accelerometer and gyroscope. Source: Sinha, et al., 2021.
| S. No |
Activities |
KNN
(K = 3) |
KNN
(K = 5) |
KNN
(K = 7) |
KNN
(K = 11) |
SVM |
Naive
Bayes |
| 1 |
A1: Left Movement |
98.24 |
97.88 |
97.56 |
96.95 |
97.10 |
84.55 |
| 2 |
A2: Right Movement |
99.78 |
99.76 |
99.73 |
99.69 |
99.88 |
99.37 |
| 3 |
A3: Front Movement |
99.55 |
99.53 |
99.52 |
99.51 |
99.66 |
92.43 |
| 4 |
A4: Back Movement |
98.95 |
99.08 |
99.17 |
99.26 |
98.78 |
85.66 |
| 5 |
A5: Straight Movement |
95.87 |
95.12 |
94.57 |
93.51 |
98.31 |
95.31 |
Table 7 illustrates the confusion matrix for all considered sitting behaviors of office workers by employing an accelerometer and gyroscope with the SVM classifier.
Table 7. Confusion matrix of SVM classifier of selected features of accelerometer and gyroscope. Source: Sinha, et al., 2021.
| |
S. No |
Activity |
A1 |
A2 |
A3 |
A4 |
A5 |
| True Class |
1 |
A1 |
10,341 |
7 |
108 |
8 |
185 |
| 2 |
A2 |
3 |
11,460 |
3 |
2 |
5 |
| 3 |
A3 |
130 |
2 |
10,038 |
1 |
2 |
| 4 |
A4 |
1 |
1 |
0 |
8746 |
106 |
| 5 |
A5 |
69 |
4 |
1 |
59 |
7868 |
| |
|
|
Predicted Class |
Performance Analysis of the Classifiers with Feature Selection of Accelerometer
Table 8 shows the result of all the applied classifiers by employing the accelerometer sensor and the confusion matrix in Table 9 is generated for five various sitting behaviors confused with each other.
Table 8. Classifier results with feature selection of accelerometer. Source: Sinha, et al., 2021
| S. No |
Activities |
KNN
(K = 3) |
KNN
(K = 5) |
KNN
(K = 7) |
KNN
(K = 11) |
SVM |
Naive
Bayes |
| 1 |
A1: Left movement |
99.63 |
99.57 |
99.50 |
99.46 |
98.94 |
82.18 |
| 2 |
A2: Right movement |
99.95 |
99.93 |
99.92 |
99.91 |
99.89 |
99.80 |
| 3 |
A3: Front movement |
99.90 |
99.88 |
99.87 |
99.87 |
99.84 |
90.62 |
| 4 |
A4: Back movement |
99.68 |
99.72 |
99.70 |
99.75 |
99.60 |
91.06 |
| 5 |
A5: Straight movement |
99.31 |
99.20 |
99.15 |
98.88 |
99.30 |
96.28 |
Table 9. Confusion matrix of KNN (K = 3) classifier of selected features of accelerometer. Source: Sinha, et al., 2021
| |
S. No |
Activity |
A1 |
A2 |
A3 |
A4 |
A5 |
| True Class |
1 |
A1 |
10,634 |
6 |
18 |
1 |
14 |
| 2 |
A2 |
3 |
11,467 |
1 |
0 |
1 |
| 3 |
A3 |
9 |
0 |
10,049 |
0 |
1 |
| 4 |
A4 |
1 |
0 |
0 |
8769 |
127 |
| 5 |
A5 |
15 |
1 |
0 |
39 |
7994 |
| |
|
|
Predicted Class |
Analysis of Results
The current study used smartphone technology as the sensor for analysis of the sitting behavior of test subjects. Based on the results, it was noted that the SVM classifier outdid the other classifiers. However, when considering the other classifiers, the performance is not that precise while considering all the postures.
Conclusions
The study analyzed five general sitting behaviors of office workers by employing the inertial sensor inbuilt in a smartphone with the help of machine learning classification techniques. Researchers have also performed a comparative analysis of different activity recognition techniques and found that 99.90% accuracy was achieved for all sitting behaviors on the office chair by the SVM classifier.
Continue reading: Wireless 3D Printed Wearable Sensor to Track Health and Body Function.
Journal Reference:
Sinha, V. K., Patro, K. K., Plawiak, P., Prakash, A. J. (2021) Smartphone-Based Human Sitting Behaviors Recognition Using Inertial Sensor. Sensors, 21(19), p. 6652. Available at: https://doi.org/10.3390/s21196652.
References and Further Reading
- Haynes, S & Williams, K (2008) Impact of seating posture on user comfort and typing performance for people with chronic low back pain. International Journal of Industrial Ergonomics. 38, pp. 35–46. doi.org/10.1016/j.ergon.2007.08.003.
- Lis, A. M., et al. (2007) Association between sitting and occupational LBP. European Spine Journal, 16, pp. 283–298. doi.org/10.1007/s00586-006-0143-7.
- Magnæs, B (1976) Body position and cerebrospinal fluid pressure. Journal of Neurosurgery, 44, pp. 687–697. doi.org/10.1109/JSEN.2013.2259589
- Xu, W., et al. (2013) A textile pressure sensor array design and calibration for sitting posture analysis. IEEE Sensors Journal, 10, pp. 3926–3934. doi.org/10.1109/JSEN.2013.2259589.
- Ma, C., et al. (2017) Activity level assessment using a smart cushion for people with a sedentary lifestyle. Sensors, 17, p. 2269. doi.org/10.3390/s17102269.
- Roh, J., et al. (2018) Sitting posture monitoring system based on a low-cost load cell using machine learning. Sensors, 18, p. 208. doi.org/10.3390/s18010208.
- Xipei, R., et al. (2019) Health - Sit: Designing posture based interaction to promote exercise during fitness breaks. International Journal of Human–Computer Interaction, 35, pp. 870–885. doi.org/10.1080/10447318.2018.1506641.
- Robertson, M., et al. (2009) The effects of an office ergonomics training and chair intervention on worker knowledge, behavior and musculoskeletal risk. Applied Ergonomics, 40, pp. 124–135. doi.org/10.1016/j.apergo.2007.12.009.
- Chanchai, W., et al. (2011) The impact of ergonomics intervention on psychosocial factors and musculoskeletal symptoms among office workers. International Journal of Industrial Ergonomics, 41, pp. 671–676. doi.org/10.3390/ijerph13050464.
- Goossens, R. H. M., et al. (2012) An office chair to influence the sitting behavior of office workers. Work, 41, pp. 2086–2088. doi.org/10.3233/WOR-2012-0435-2086.
- Menndez, C. C., et al. (2012) A replicated field intervention study evaluating the impact of a highly adjustable chair and office ergonomics training on visual symptoms. Applied Ergonomics, 43, pp. 639–644. doi.org/10.1016/j.apergo.2011.09.010.
- Taieb-Maimon, M., et al. (2012) The effectiveness of a training method using self-modelling webcam photos for reducing musculoskeletal risk among office workers using computers. Applied Ergonomics, 43, pp. 376–385. doi.org/10.1016/j.apergo.2011.05.015.
- Garcia, S., et al. (2012) Prototype Selection for Nearest Neighbor Classification: Taxonomy and Empirical Study. IEEE Transactions on Pattern Analysis and Machine Intelligence, 34, pp. 417–435. doi.org/10.1109/TPAMI.2011.142.
- Theodoridis, S. et al. (2010) Introduction to Pattern Recognition: A Matlab Approach; Academic Press: Waltham, NA, USA.
- Duda, R. O., et al. (2001) Pattern classification. International Journal of Computational Intelligence and Applications, 1, pp. 335–339.
- Zhang, S (2010) KNN-CF Approach: Incorporating Certainty Factor to kNN Classification. IEEE Intelligent Informatics Bulletin, 1, pp. 24–33.
- Zhang, S., et al. (2017) Efficient kNN Classification with Different Numbers of Nearest Neighbors. IEEE Transactions on Neural Networks and Learning Systems, 29, pp. 1774–1785. doi.org/10.1109/TNNLS.2017.2673241.
- Rosero-Montalvo, P. D., et al. (2018) Intelligent system for identification of wheel chair users posture using machine learning techniques. IEEE Sensors Journal, 19, pp. 1936–1942. doi.org/10.1109/JSEN.2018.2885323.
- Chang, C., et al. (2011) A library for support vector machines. ACM Transactions on Intelligent Systems and Technology, 2, pp. 1–27. doi.org/10.1145/1961189.1961199.
- Hall, M A (1999) Correlation-Based Feature Selection for Machine Learning. The University of Waikato. Available at: https://www.cs.waikato.ac.nz/~ml/publications/1999/99MH-Thesis.pdf (Accessed on 25 September 2021).
- Burges, C J (1998) A Tutorial on Support Vector Machines for Pattern Recognition. Data Mining and Knowledge Discovery, 2, pp. 121–167. doi.org/10.1023/A:1009715923555.
- Cortes, C & Vapnik, V (1995) Support vector networks. Machine Learning, 20, pp. 273–297. doi.org/10.1007/BF00994018.
- Gaglio, S. et al. (2014) Human Activity Recognition Process Using 3-D Posture Data. IEEE Transactions on Human-Machine Systems, 45, pp. 586–597. doi.org/10.1109/THMS.2014.2377111.
- Miron, C., et al. (2019) Hand Gesture Recognition based on SVM Classification. In: Proceedings of the 2019 E-Health and Bioengineering Conference (EHB), Iasi, Romania, pp. 21–23 November 2019. doi.org/10.1109/EHB47216.2019.8969921.
- Attal, F., et al. (2015) Physical Human Activity Recognition Using Wearable Sensors. Sensors, 15, pp. 31314–31338. doi.org/10.3390/s151229858.
- Vergara, M & Page, Á (2000) System to measure the use of the backrest in sitting-posture office tasks. Applied Ergonomics, 31, pp. 247–254. doi.org/10.1016/S0003-6870(99)00056-3.
- Zemp, R., et al. (2016) Occupational sitting behaviour and its relationship with back pain - A pilot study. Applied Ergonomics, 56, pp. 84–91. doi.org/10.1016/j.apergo.2016.03.007.
- Grandjean, E & Hünting, W (1977) Ergonomics of posture - Review of various problems of standing and sitting posture. Applied Ergonomics, 8, pp. 135–140. doi.org/10.1016/0003-6870(77)90002-3.
- Hyeong, J.-H., et al. (2014) A Trend Analysis of Dynamic Chair and Applied Technology. Journal of the Ergonomics Society of Korea, 33, pp. 267–279. doi.org/10.5143/JESK.2014.33.4.267.
- Wang, S. J., et al. (2018) The Virtual-Spine Platform - Acquiring, visualizing, and analyzing individual sitting behavior. PLoS ONE, 13, e0195670. doi.org/10.1371/journal.pone.0195670.
- Bortone, I. et al. (2014) A two-stage approach to bring the postural assessment to masses: The KISS-Health Project. In: Proceedings of the IEEE-EMBS International Conference on Biomedical and Health Informatics (BHI), Valencia, Spain, 1–4 June 2014; pp. 371–374. doi.org/10.1109/BHI.2014.6864380.
- Bortone, I. et al. (2014) The PoSE Project: An Innovative Approach to PromoteHealthy Postures in Schoolchildren. In: Proceedings of the International Conference on E-Learning, E-Education, and Online Training, Bethesda, MD, USA, 18−20 September 2014. doi.org/10.1007/978-3-319-13293-8_6.
- Arif, M & Ahmed, K (2015) Physical activities monitoring using wearable acceleration sensors attached to the body. PLoS ONE, 10, e0130851. doi.org/10.1371/journal.pone.0130851.
- Zdemir, A & Billur, B (2014) Detecting falls with wearable sensors using machine learning techniques. Sensors, 14, pp. 10691–10708. doi.org/10.3390/s140610691.
- Benocci, M. et al. (2011) Context-Aware Smart Seat. In Proceedings of the 2011 4th IEEE International Workshop on Advances in Sensors and Interfaces (IWASI), Savelletri diFasano, Italy, 28–29 June 2011; pp. 104–109. doi.org/10.1109/IWASI.2011.6004697.
- Zhang, S. et al. (2010) Optimal model selection for posture recognition in home-based healthcare. International Journal of Machine Learning and Cybernetics, 2, pp. 1–14. doi.org/10.1007/s13042-010-0009-5.
- OnePlus 6 specs, Oneplus.in. (2021). Available at: https://www.oneplus.in/6/specs (accessed on 21 September 2021).
- Arif, M., et al. (2014) Better physical activity classification using smart phone acceleration sensor. Journal of Medical Systems, 38, p. 95. doi.org/10.1371/journal.pone.0130851.
- Phinyomark, A. et al. (2010) Evaluation of EMG feature extraction for hand movement recognition based on Euclidean distance and standard deviation. In: Proceedings of the ECTI-CON2010: The 2010 ECTI International Conference on Electrical Engineering/Electronics, Computer, Telecommunications and Information Technology, Chiang Mai, Thailand, 19–21 May 2010, pp. 856–860. Available at: https://ieeexplore.ieee.org/abstract/document/5491586.
- Mannini, A & Sabatini, A M (2010) Machine learning methods for classifying human physical activity from on body accelerometers. Sensors, 10, pp. 1154–1175. doi.org/10.3390/s100201154.
- Hall, M. et al. (2009) The WEKA data mining software: An update. ACM SIGKDD Explorations Newsletter, 11, pp. 10–18. doi.org/10.1145/1656274.1656278.
- Hall, M A & Smith, L A (1999) Feature Selection for Machine Learning: Comparing a Correlation-Based Filter Approach to the Wrapper. In: Proceedings of the FLAIRS Conference, Orlando, FL, USA, 1–5 May 1999; pp. 235–239.
- Aha, D. W. et al. (1991) Instance based learning algorithms. Machine Learning, 6, pp. 37–66. doi.org/10.1007/BF00153759.
- Russell, E & Kennedy, J (1995) Particle swarm optimization. In: Proceedings of the IEEE International Conference On Neural Networks, Citeseer, Perth, WA, Australia, 27 November–1 December 1995; pp. 1942–1948. doi.org/10.1109/ICNN.1995.488968.
- Sinha, V K & Maurya, A K (2017) Calibration of Inertial Sensor by Using Particle Swarm Optimization and Human Opinion Dynamics Algorithm. International Journal of Instrumentation and Control Systems, 47, pp. 777–778. Available at: https://aircconline.com/ijics/V7N1/7117ijics01.pdf.
- Reddy, S. et al. (2010) Using mobile phones to determine transportation modes. ACM Transactions on Sensor Networks, 6, pp. 1–27. doi.org/10.1145/1689239.1689243.
- VenkataPhanikrishna, B. et al. (2021) A Brief Review on EEG Signal Pre-processing Techniques for Real-Time Brain-Computer Interface Applications. TechRxiv. Preprint. 2021. Available at: https://doi.org/10.36227/techrxiv.16691605.v1 (accessed on 20 September 2021).