Inland water ecosystems offer numerous ecosystem services useful for irrigation, human consumption, transportation, sanitation, recreation, culture, and industry. However, in recent years these ecosystems have experienced high stress due to anthropogenic activities and climate change.
Many scientists have examined lake surface water temperature (LSWT) worldwide to explore the effects of global warming on these ecosystems, identifying variable increases in water temperatures.
Water temperature is a significant component in aquatic ecosystems, directly or indirectly controlling many physicochemical mechanisms and reactions that occur within them.
Previous research has shown that global warming has affected air temperature patterns, and as a result, LSWT.
Conventional in situ monitoring is typically used to obtain LSWT data, which is often impeded by geographically complex locations, and limited human and economic resources. Traditional methods also possess spatial and temporal limitations, further complicating their use.
Recent satellite Earth Observation imagery has provided a complementary and alternative method for the monitoring of LSWT at a higher spatial and temporal resolution. Thus, the Moderate Resolution Imaging Spectroradiometer (MODIS) has been identified as a valuable satellite product for predicting LSWT, thanks to its temporal, spatial, spectral, and radiometric resolution.
Here, we discuss research reviewing satellite imagery products for regional, local, and national scale development and growth. The study analyzes the spatial and temporal trends and behavior of LSWT in 14 south-central Chilean lakes, between 2000 and 2016, using MODIS satellite imagery.
Methodology
The area for research was distributed across four regions: Maule, Bío-Bío, Araucanía, and Los Ríos. Around 18% comprises the inland water bodies selected for the research (Figure 1).
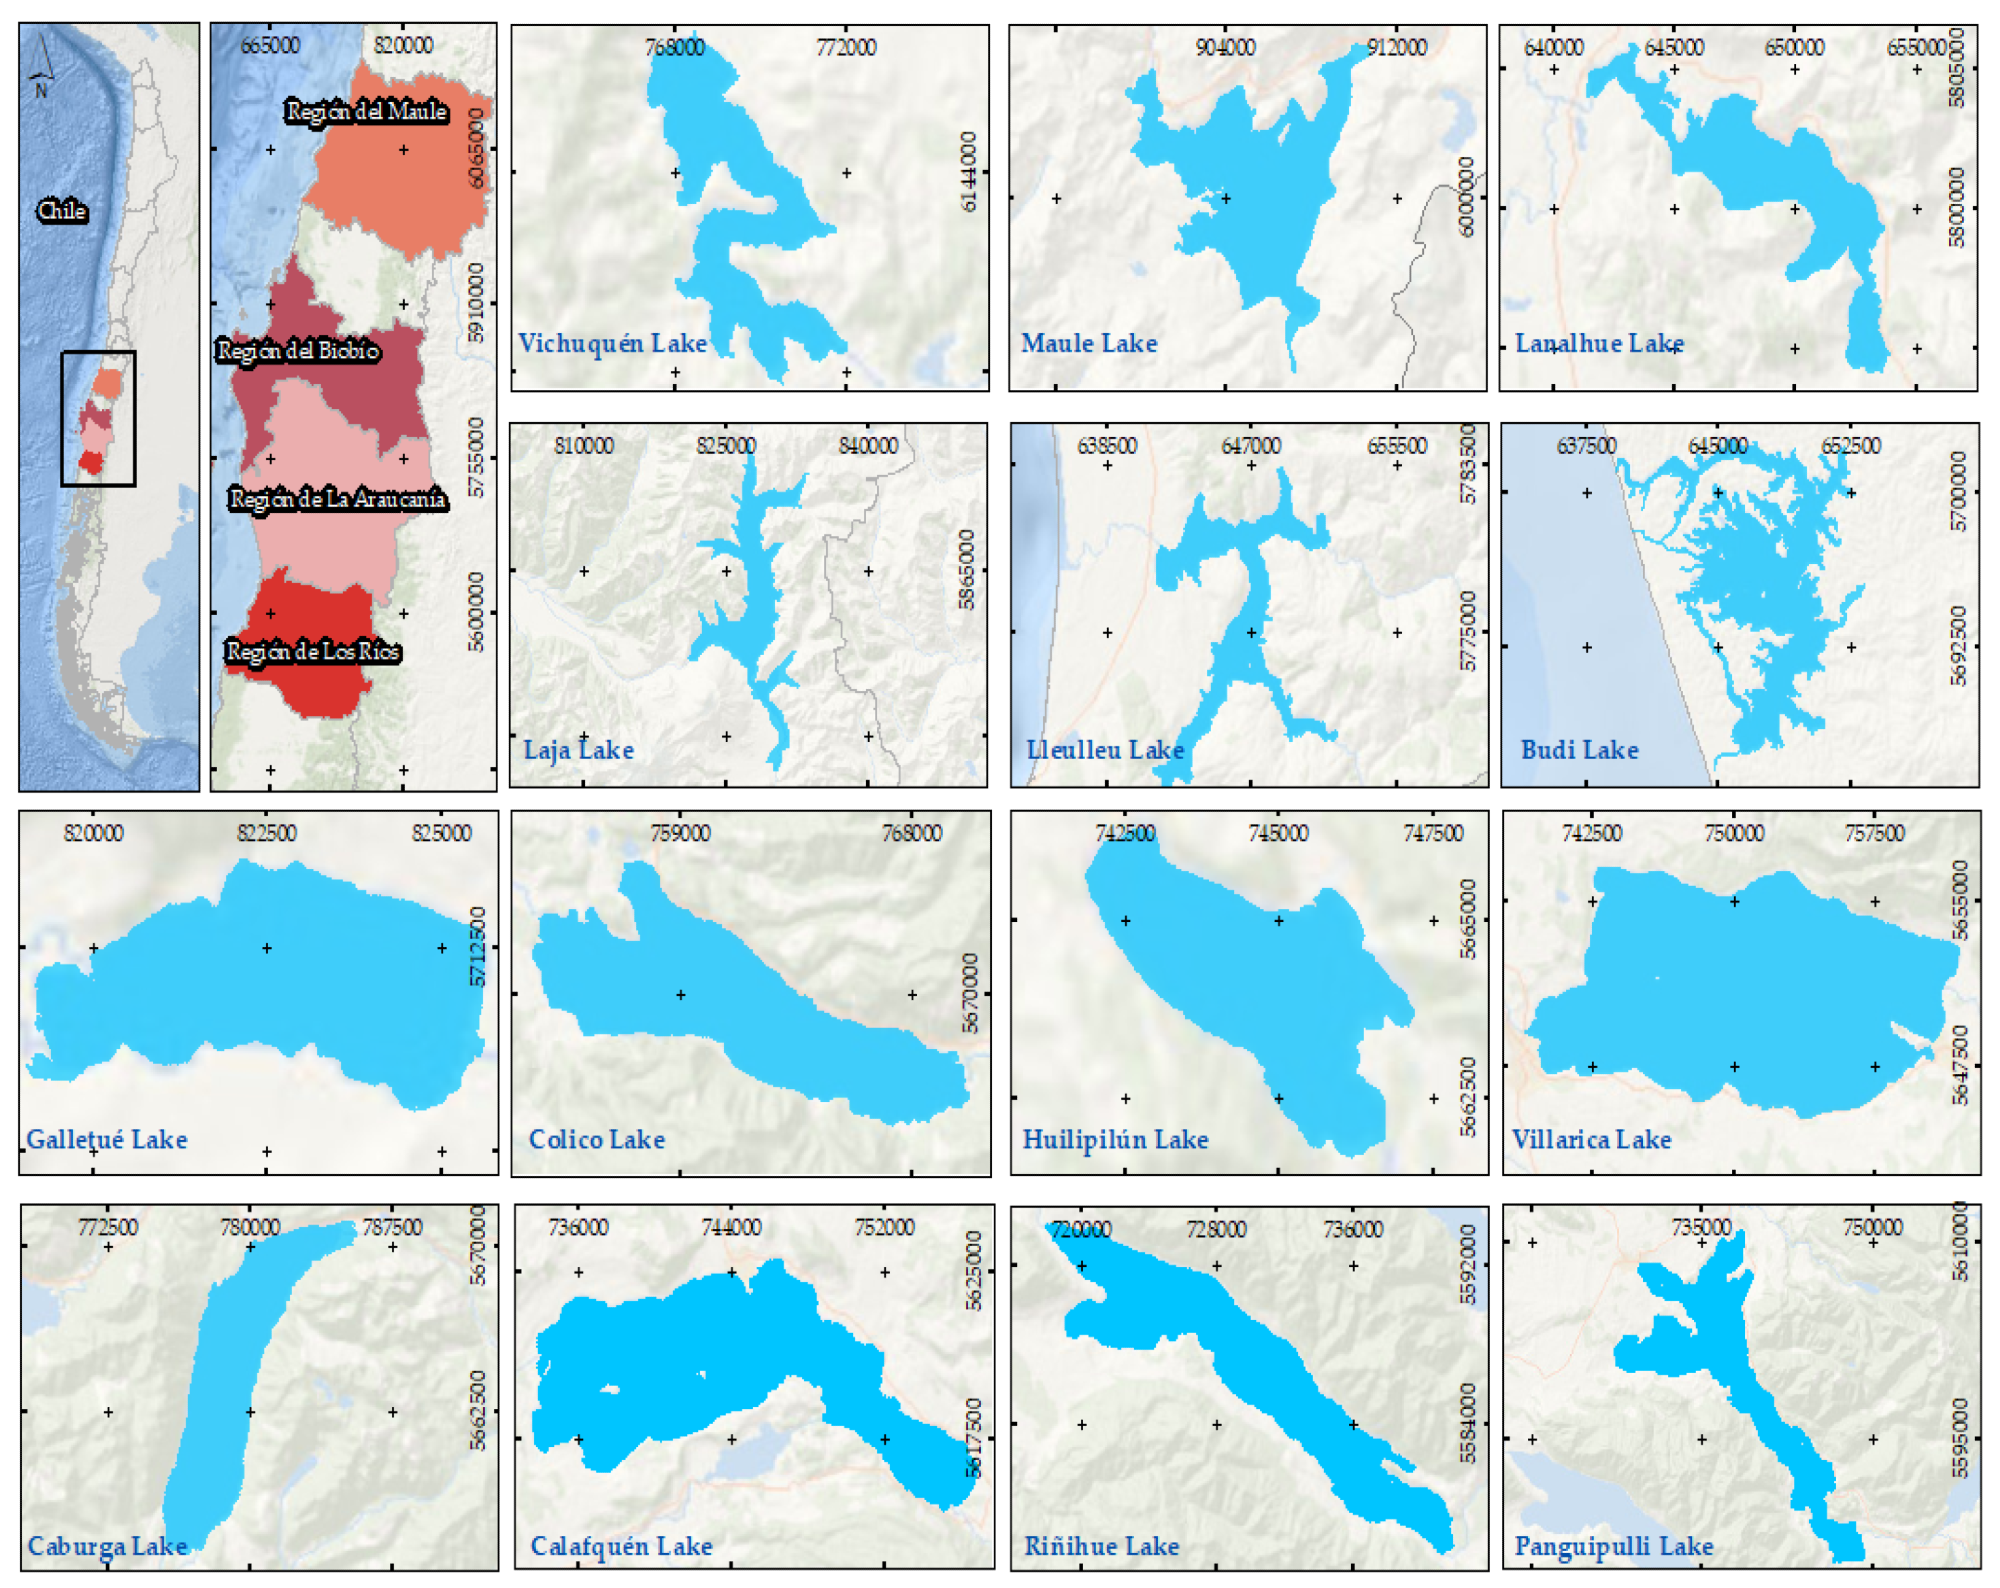
Figure 1. The Maule, Bío-Bío, Araucanía, and Los Ríos regions, located in south-central Chile and the lakes analyzed in this study. Image Credit: Aranda, et al., 2021
The study selected lakes with a surface area ≥10 km2 and the 14 selected lakes present a temperate monomictic circulation pattern, with thermal stratification during summer. Eleven of the lakes are oligotrophic, Villarrica is meso-oligotrophic, while Vichuquén and Lanalhue are eutrophic. Table 1 shows the geographical and morphometric characteristics that impact LSWT.
Table 1. Morphometric parameters that influence LSWT: location, elevation, surface area, perimeter, volume, mean depth, and maximum depth for the 14 inland lakes selected in this study. Source: Aranda, et al., 2021.
Study
Lakes |
Latitude |
Longitude |
Altitude |
Surface
Area |
Perimeter |
Volume |
Mean
Depth |
Maximum
Depth |
Trophic
State |
| (°S) |
(°W) |
m a.s.l. |
km2 |
km |
km3 |
m |
m |
|
| Vichuquén |
34°49′ |
72°04′ |
5 |
12.68 |
35.12 |
0.21 |
2.5 |
6.3 |
Eutrophic |
| Maule |
36°05′ |
70°50′ |
2166 |
58.28 |
78.98 |
170 |
NR |
NR |
Oligotrophic |
| Lanalhue |
37°55′ |
73°19′ |
12 |
32.60 |
64.76 |
0.42 |
13.1 |
26 |
Eutrophic |
| Laja |
37°19′ |
71°18′ |
1360 |
77.90 |
142.9 |
5.59 |
75 |
120 |
Oligotrophic |
| Lleulleu |
38°09′ |
73°19′ |
5 |
38.96 |
98.51 |
0.93 |
23.5 |
46.9 |
Oligotrophic |
| Budi |
37°19′ |
71°19′ |
2 |
73.29 |
328.8 |
0.22 |
4.4 |
15 |
Oligotrophic |
| Galletué |
38°41′ |
71°17′ |
1350 |
13.08 |
20.61 |
0.40 |
NR |
50 |
Oligotrophic |
| Colico |
39°05′ |
71°58′ |
500 |
54.96 |
52.28 |
NR |
416 |
NR |
Oligotrophic |
| Huilipilún |
39°08′ |
72°10′ |
343 |
11.33 |
18.74 |
NR |
NR |
212 |
Oligotrophic |
| Villarrica |
39°18′ |
72°05′ |
230 |
176.0 |
71.20 |
21 |
120 |
165 |
Meso-oligotrophic |
| Caburga |
39°07′ |
71°45′ |
505 |
52.27 |
51.73 |
8.88 |
117 |
327 |
Oligotrophic |
| Calafquén |
39°32′ |
72°09′ |
203 |
114.9 |
122.38 |
NR |
115 |
212 |
Oligotrophic |
| Riñihue |
39°50′ |
72°20′ |
117 |
77.50 |
77.00 |
12.8 |
162 |
323 |
Oligotrophic |
| Panquipulli |
39°43′ |
71°13′ |
140 |
117 |
124.05 |
NR |
126 |
268 |
Oligotrophic |
NR = not reported.
The lake's surface temperature was obtained through a free web-based hydrometeorological service. Measurements were taken between 09:00 and 15:00 at a depth of ~50 cm.
The researchers processed around 774 MODIS images from 18 February 2000 (Julian day 49) to 26 December 2016 (Julian day 361). A thermal infrared imagery database with high spatial resolution downloaded from the NASA Earth Observing System Data and Information System (EOSDIS) was also utilized.
Daytime images were used for pre-processing and the original scenes in HDF format were converted to raster GeoTIFF format. Pixels contaminated by cloud cover were reviewed and modified to remove cloud-contaminated images.
Validation was carried out using a least-squares linear fit to determine the relationship between the surface water temperature acquired by processing MODIS images and in situ data.
The Mann–Kendall non-parametric test, a statistical test commonly used for the analysis of the trend in climatology and in hydrologic time series, was employed to evaluate LSWT trends in the time series (2000–2016).
Results
The MODIS-derived one-meter below surface temperature was necessary to validate the MODIS-derived skin temperature against the one-meter below surface temperature from the in situ measurements.
A significant correlation between MODIS LSWT and in situ can be seen in Table 2, which also displays the highest correlation data which was obtained from Villarrica lake. The results from the MODIS LSWT data expressed in root mean square error (RMSE) were between 1.07 and 1.88 °C.
Table 2. Validated results for the comparison between MODIS LSWT and in situ LSWT for the six lakes that presented p-values ≤ 0.05. Source: Aranda, et al., 2021
| Study Lakes |
R2 |
RMSE |
MAE |
Slope |
n |
| (°C) |
(°C) |
| Caburga |
0.85 |
1.88 |
1.50 |
0.87 |
34 |
| Villarrica |
0.94 |
1.07 |
0.83 |
0.94 |
31 |
| Lanalhue |
0.94 |
1.04 |
0.77 |
0.87 |
34 |
| Calafquén |
0.85 |
1.79 |
1.24 |
0.85 |
29 |
| Panguipulli |
0.86 |
1.61 |
1.20 |
0.80 |
43 |
| Riñihue |
0.88 |
1.34 |
1.01 |
0.81 |
40 |
Figure 2 depicts that the trend analysis of the annual MODIS LSWT time-series found that only six of the 14 lakes present a substantial increase. Researchers noted that their results are reflected in previous research, including data exclusively obtained from the Northern Hemisphere.
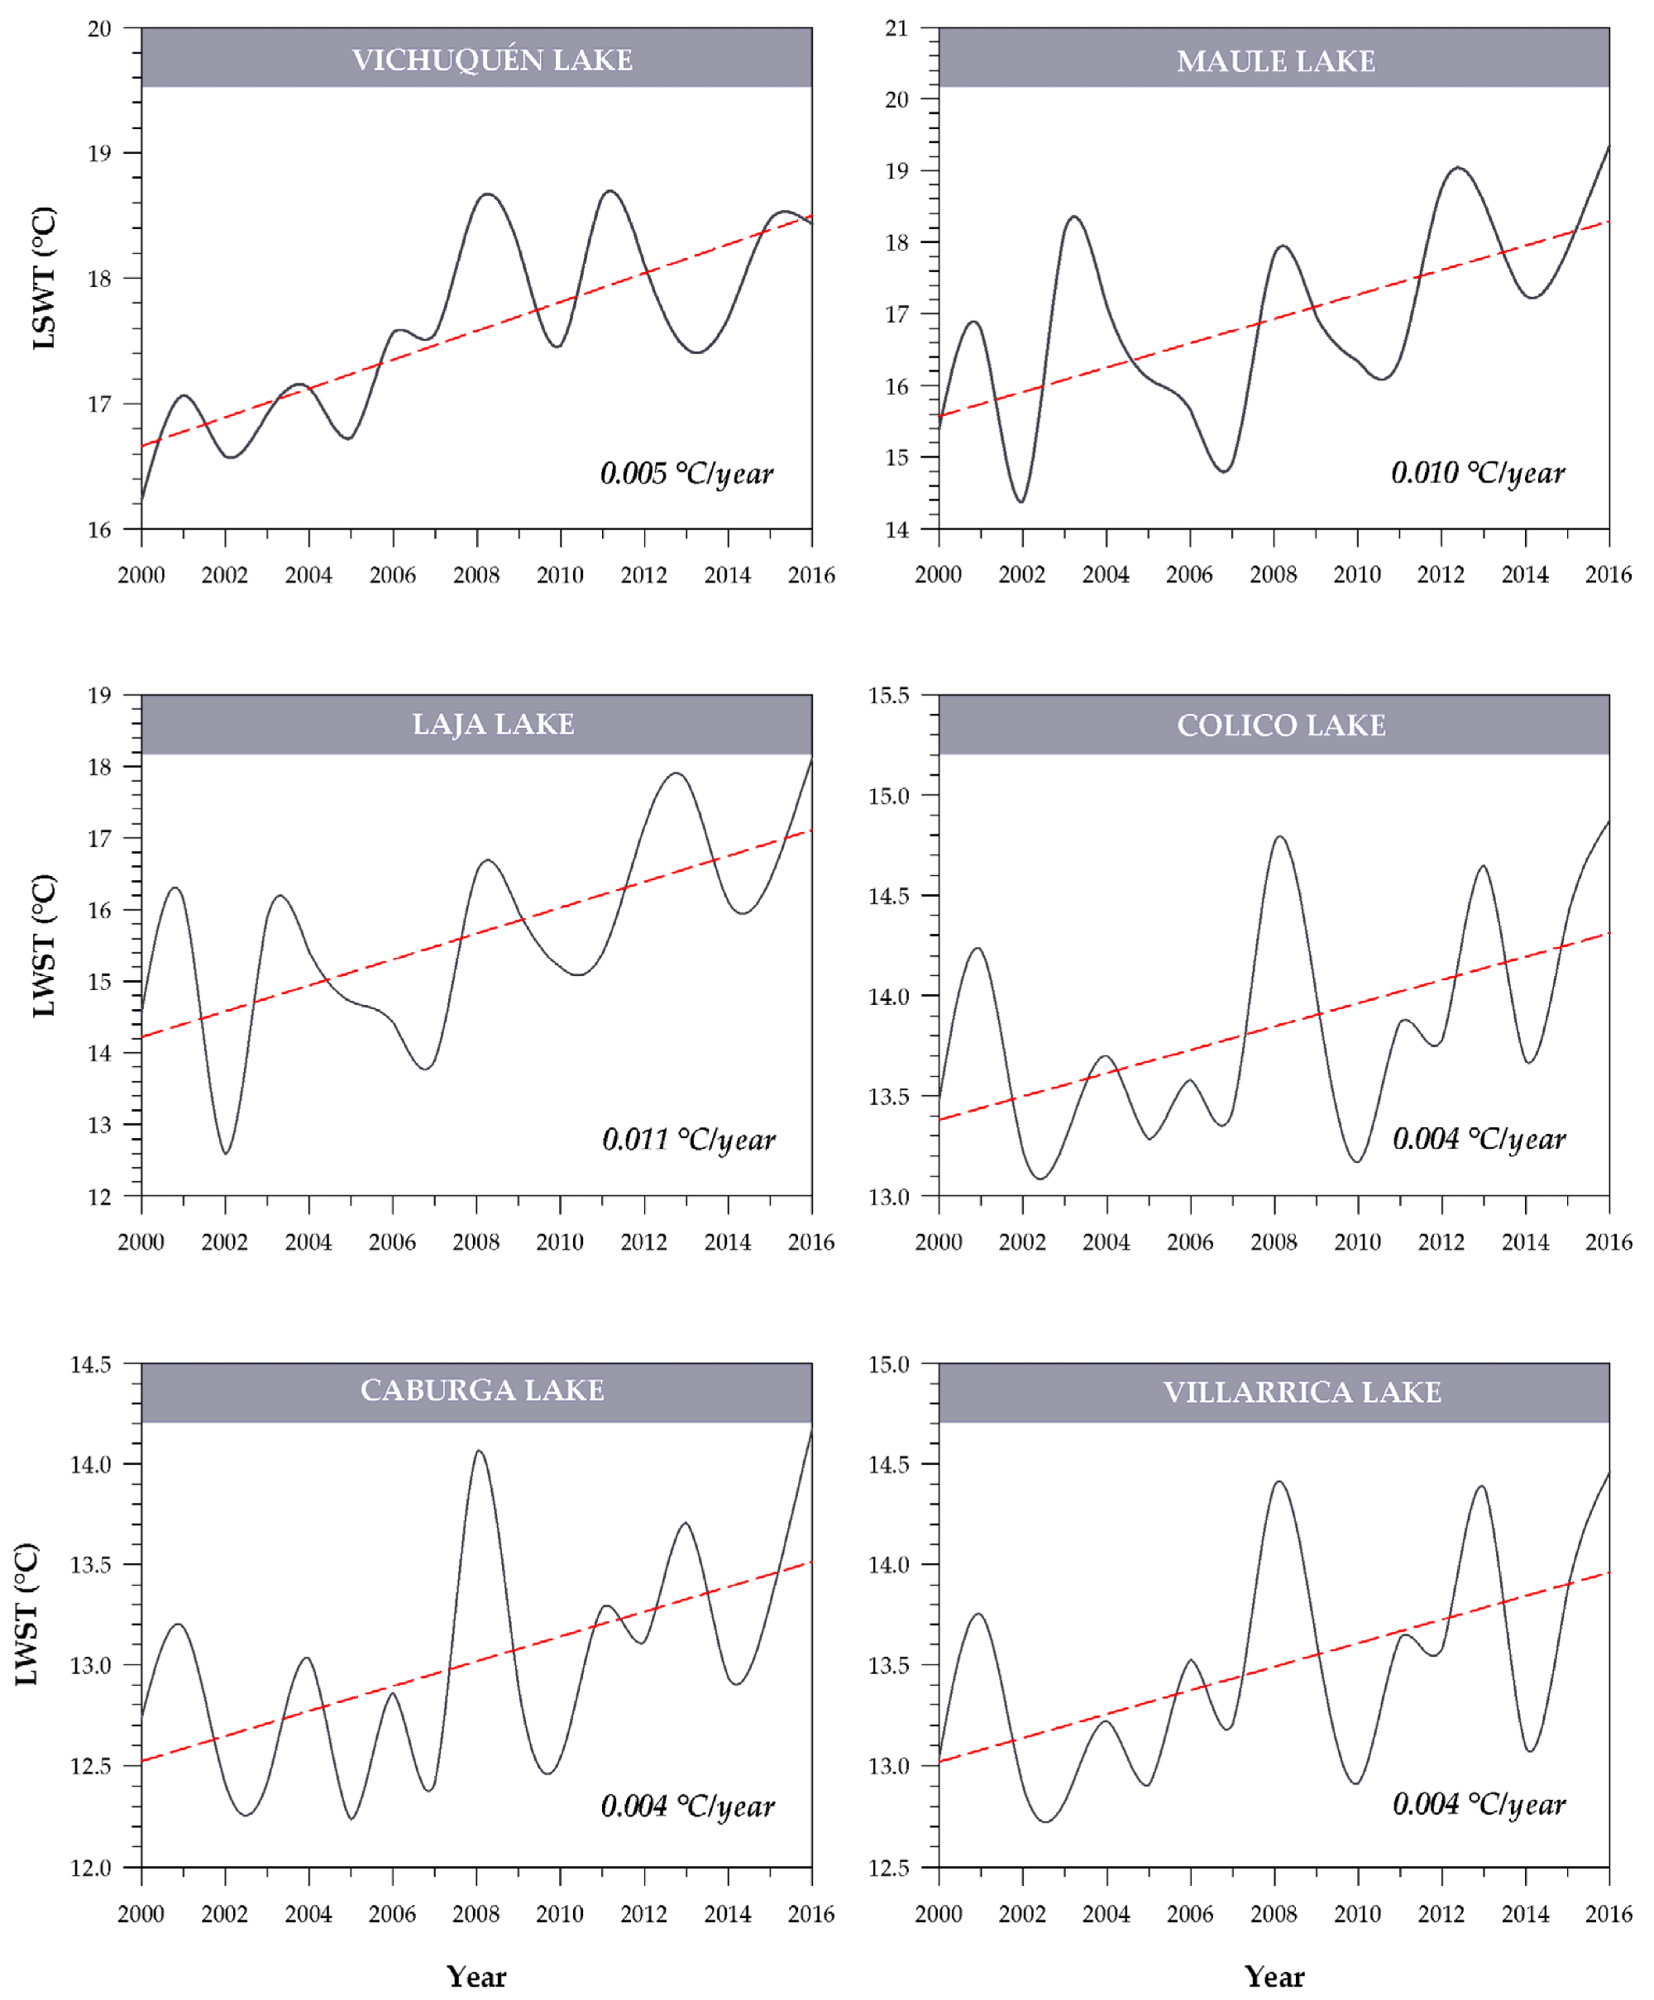
Figure 2. Temporal behavior and trends of the annual MODIS LSWT series. Image Credit: Aranda, et al., 2021.
Significant warming trends in the majority of the lakes were seen in January as shown in Table 3. As well as this, increased LSWT was found to contribute to the potentially toxic cyanobacterial blooms in Villarrica Lake. Further investigations are required to explore this relationship.
Table 3. Test results of Mann–Kendall and Pettitt tests for the month of January of the MODIS LSWT series (2000–2016). Source: Aranda, et al., 2021.
Study
Lakes |
Mann-Kendall |
Pettitt |
| S |
ZMK |
P |
Sen |
Trend
(°C/Year) |
Confidence
Interval (95%) |
Kt |
P |
Change |
| Vichuquén |
78 |
3.31 |
0.001 |
0.15 |
0.009 |
[−0.467; 0.895] |
60 |
0.005 |
2007 |
| Maule |
48 |
2.02 |
0.048 |
0.27 |
0.016 |
[−1.509; 1.896] |
58 |
0.008 |
2011 |
| Laja |
54 |
2.28 |
0.026 |
0.27 |
0.016 |
[−1.342; 1.929] |
58 |
0.009 |
2011 |
| Lleulleu |
56 |
2.36 |
0.021 |
0.16 |
0.010 |
[−0.766; 1.314] |
48 |
0.053 |
2007 |
| Galletehué |
48 |
2.02 |
0.048 |
0.19 |
0.011 |
[−1.301; 1.910] |
50 |
0.035 |
2011 |
| Budi |
50 |
2.11 |
0.039 |
0.17 |
0.010 |
[−1.712; 1.155] |
38 |
0.020 |
2007 |
| Colico |
52 |
2.19 |
0.032 |
0.17 |
0.010 |
[−0.972; 1.278] |
44 |
0.094 |
2011 |
| Caburga |
54 |
2.28 |
0.026 |
0.11 |
0.007 |
[−0.741; 1.220] |
46 |
0.075 |
2007 |
| Villarrica |
60 |
2.53 |
0.014 |
0.16 |
0.010 |
[−0.705; 1.194] |
46 |
0.069 |
2011 |
| Calafquén |
66 |
2.79 |
0.007 |
0.19 |
0.011 |
[−0.652; 1.591] |
46 |
0.070 |
2011 |
| Panguipulli |
66 |
2.79 |
0.007 |
0.18 |
0.011 |
[−0.712; 1.350] |
44 |
0.096 |
2007 |
| Riñihue |
62 |
2.62 |
0.011 |
0.19 |
0.011 |
[−0.843; 1.248] |
46 |
0.071 |
2010 |
S: S–statistic of Mann–Kendall; ZMK: Z-statistic of Mann–Kendall; P: p-value; Sen: Sen’s slope; Kt: statistic of Pettitt’s test.
A lack of significant trends at the seasonal scale was reported; however, differing temperature data as seasons changed was observed across the lakes involved in this study (Figure 3).
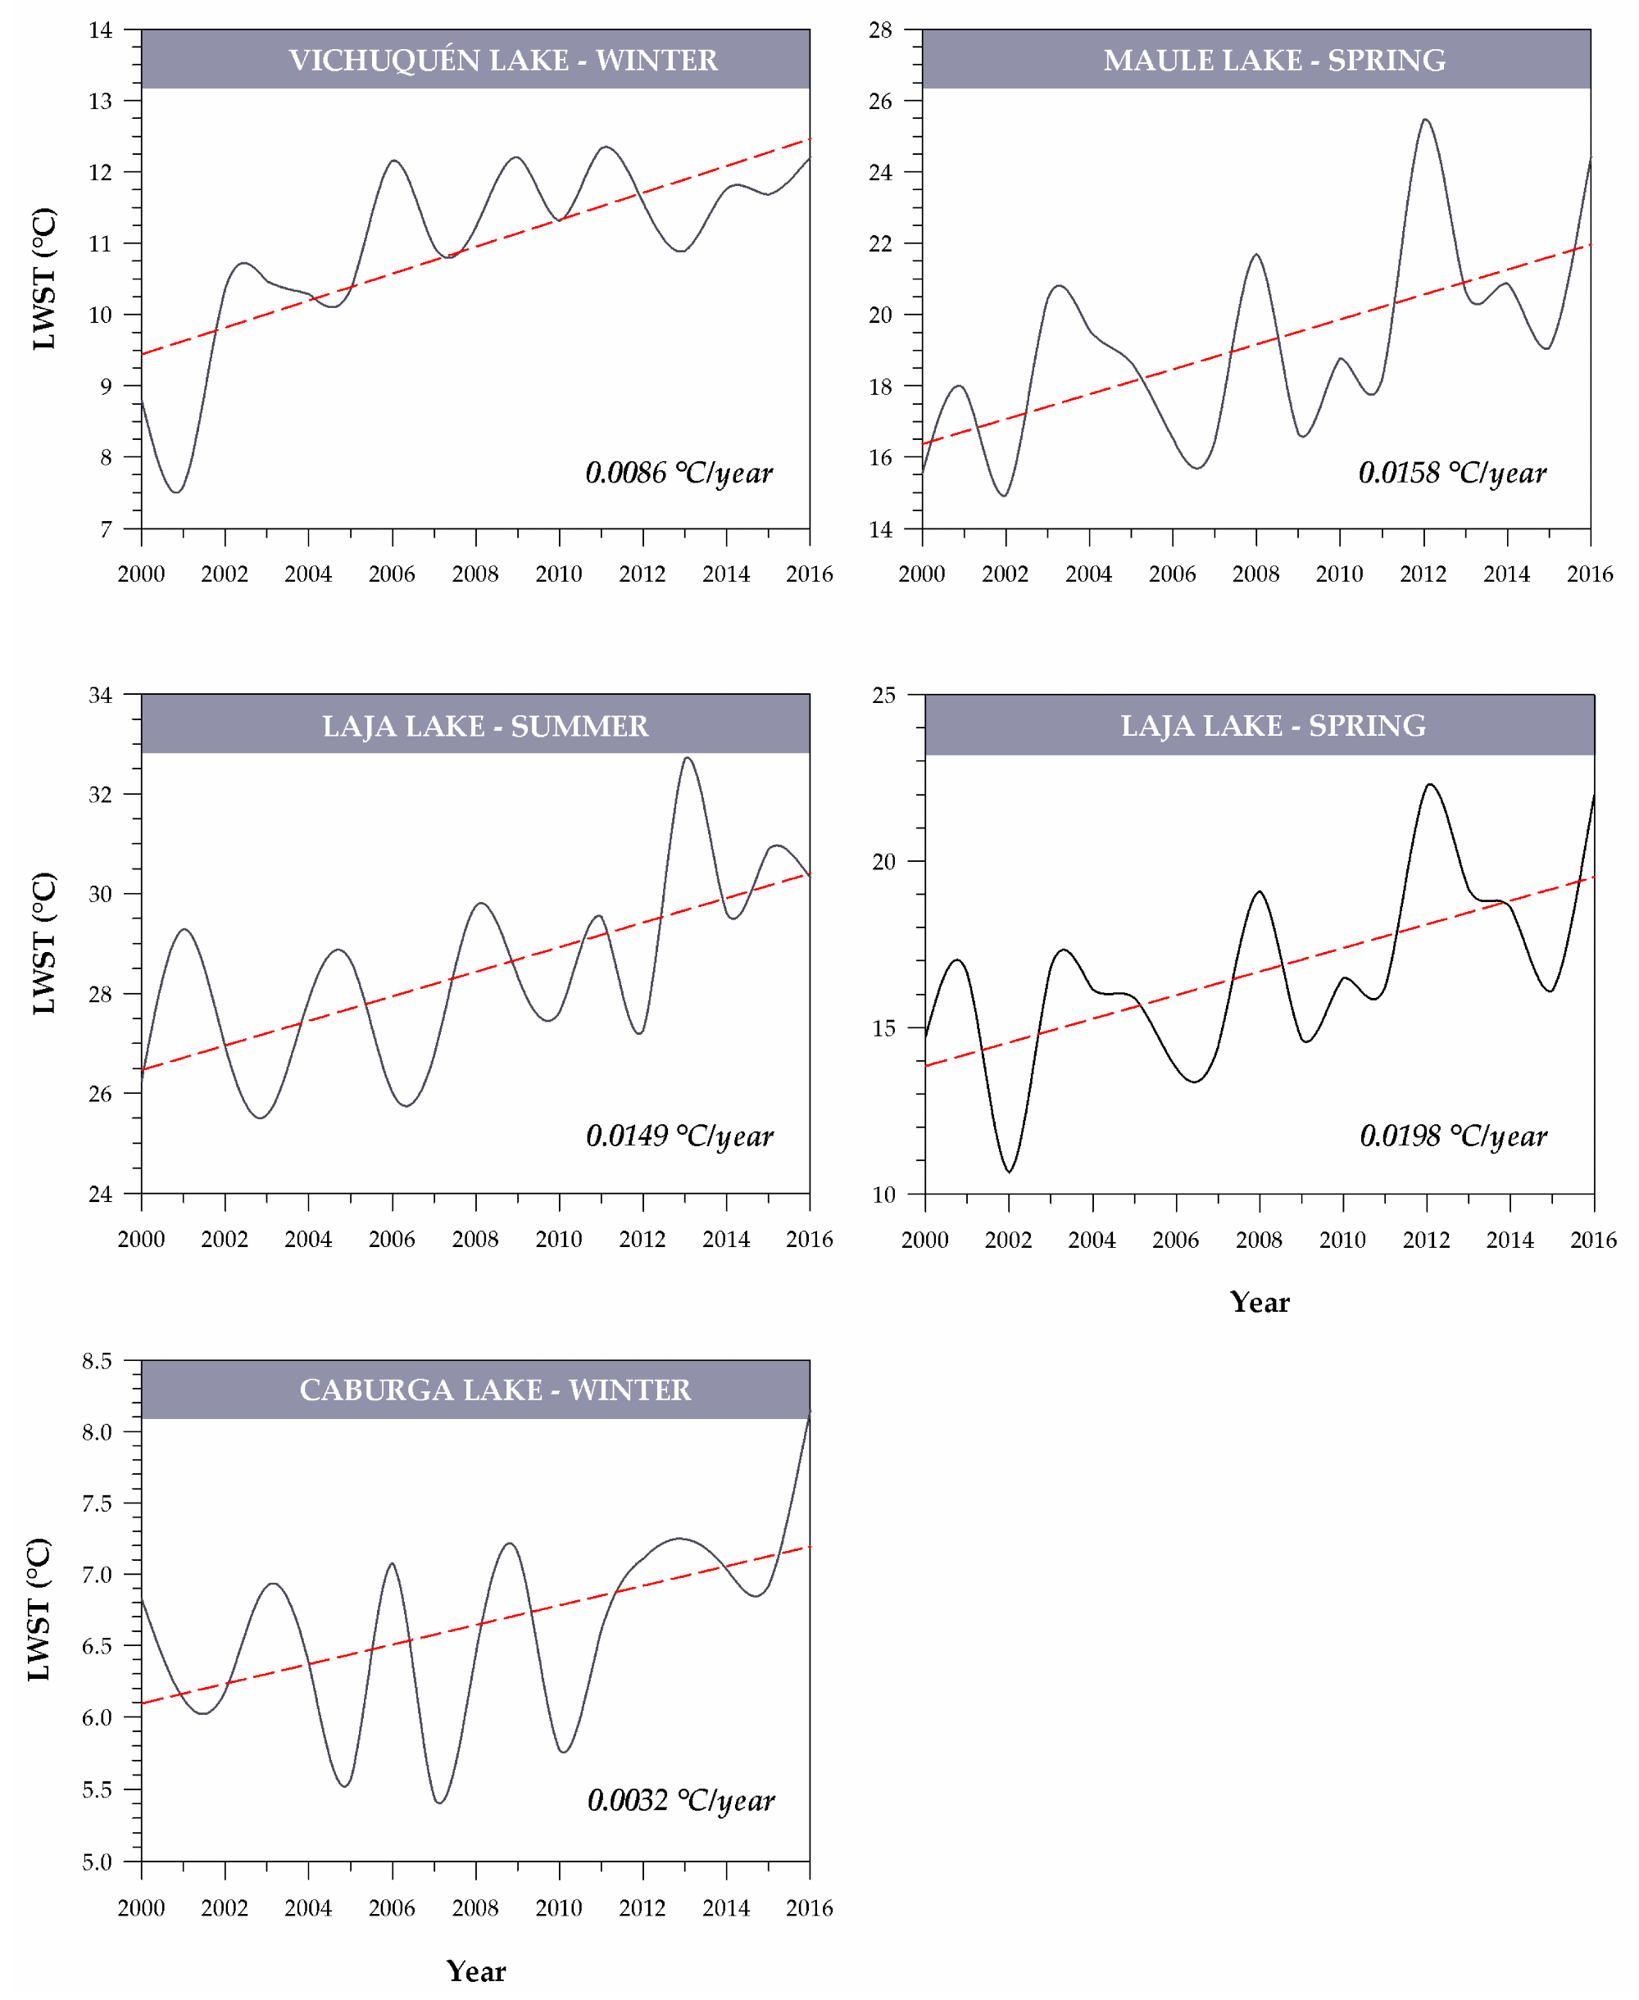
Figure 3. Temporal behavior and trends of the seasonal MODIS LSWT series. Image Credit: Aranda et al., 2021.
It is important to track the warming of lakes in all seasons. In winter, a higher temperature can favor the emergence of cyanobacteria but negatively affect habitat availability for aquatic species as stenothermal species migrate towards warmer areas. Table 4 shows the results of the Mann–Kendall and Pettitt tests (2000–2016).
Conclusion
Researchers investigated the monthly, seasonal, and annual surface temperature trends in 14 south-central Chilean lakes during the 2000–2016 period using MODIS satellite imagery. in situ LSWT was shown to be a decent methodology, suggesting its potential as an alternative for future observations of lakes >10 km2.
Overall, a significant increase in surface water temperatures was found in lakes at higher altitudes. Furthermore, the Pettitt test results show direct links between LSWT, dissolved oxygen at the surface of the lake, and land use/change.
Continue reading: Continuing NASA's Earth Observation Legacy with Landsat 9.
Journal Reference:
Aranda, A. C., Rivera-Ruiz, D., Rodríguez-López, L., Pedreros, P., Arumí-Ribera, J. L., Luis Morales-Salinas, L., Fuentes-Jaque, G., Urrutia, R. (2021) Evidence of Climate Change Based on Lake Surface Temperature Trends in South Central Chile. Remote Sensing, 13(22), p. 4535. Available at: https://www.mdpi.com/2072-4292/13/22/4535/htm.
References and Further Reading
- Giardino, C., et al. (2019) Imaging Spectrometry of Inland and Coastal Waters: State of the Art, Achievements and Perspectives. Surveys in Geophysics, 40, pp. 401–429. doi.org/10.1007/s10712-018-9476-0.
- Schröter, M., et al. (2019) Atlas of Ecosystem Services. Springer: Berlin/Heidelberg, Germany.
- Wu, D., et al. (2020) Temperature-Induced Dry Climate in Basins in the Northeastern Tibetan Plateau during the Early to Middle Holocene. Quaternary Science Reviews, 237, p. 106311. doi.org/10.1016/j.quascirev.2020.106311.
- Coats, R., et al. (2006). The Warming of Lake Tahoe. Climate Change, 76, pp. 121–148. doi.org/10.1007/s10584-005-9006-1.
- Schneider, P & Hook, S J (2010) Space Observations of Inland Water Bodies Show Rapid Surface Warming since 1985. Geophysical Research Letters, 37, p. L22405. doi.org/10.1029/2010GL045059.
- O’Reilly, C. M., et al. Rapid and Highly Variable Warming of Lake Surface Waters around the Globe. Geophysical Research Letters, 42, pp. 10–773. doi.org/10.1002/2015GL066235.
- Song, K., et al. (2016) Spatiotemporal Variations of Lake Surface Temperature across the Tibetan Plateau Using MODIS LST Product. Remote Sensing, 8, p. 854. doi.org/10.3390/rs8100854.
- Luo, Y., et al. (2019) Spatiotemporal Variations in Dianchi Lake’s Surface Water Temperature from 2001 to 2017 under the Influence of Climate Warming. IEEE Access, 7, pp. 115378–115387. doi.org/10.1109/ACCESS.2019.2935767.
- Jane, S. F., et al. (2021) Widespread Deoxygenation of Temperate Lakes. Nature, 594, pp. 66–70. doi.org/10.1038/s41586-021-03550-y.
- Ptak, M., et al. (2018) Effect of Environmental Conditions and Morphometric Parameters on Surface Water Temperature in Polish Lakes. Water, 10, p. 580. doi.org/10.3390/w10050580.
- Yang, K., et al. (2019) Spatial-Temporal Variation of Lake Surface Water Temperature and Its Driving Factors in Yunnan-Guizhou Plateau. Water Resources Research, 55, pp. 4688–4703. doi.org/10.1029/2019WR025316.
- Öğlü, B., et al. (2020) Is Fish Biomass Controlled by Abiotic or Biotic Factors? Results of Long-Term Monitoring in a Large Eutrophic Lake. Journal of Great Lakes Research, 46, pp. 881–890. doi.org/10.1016/j.jglr.2019.08.004.
- Zhang, Z., et al. (2021) Alteration of Dominant Cyanobacteria in Different Bloom Periods Caused by Abiotic Factors and Species Interactions. Journal of Environmental Sciences, 99, pp. 1–9. doi.org/10.1016/j.jes.2020.06.001.
- Peeters, F., et al. (2002) Modeling 50 years of historical temperature profiles in a large central European lake. Limnology and Oceanography, 47, pp. 186–197. doi.org/10.4319/lo.2002.47.1.0186.
- Shuter, B. J., et al. (1983) Empirical Predictors of Annual Surface Water Temperature Cycles in North American Lakes. Canadian Journal of Fisheries and Aquatic Sciences, 40, pp. 1838–1845. doi.org/10.1139/f83-213.
- Oswald, C J & Rouse, W R (2004) Thermal Characteristics and Energy Balance of Various-Size Canadian Shield Lakes in the Mackenzie River Basin. Journal of Hydrometeorology, 5, pp. 129–144. doi.org/10.1175/1525-7541.
- Aaron-Morrison, A. P., et al. (2017) State of the Climate in 2016. Bulletin of the American Meteorological Society, 98, pp. Si-S280. doi.org/10.1175/2017BAMSStateoftheClimate.1.
- Sharma, S., et al. (2008) Empirical Modelling of Lake Water-Temperature Relationships: A Comparison of Approaches. Freshwater Biology, 53, pp. 897–911. doi.org/10.1111/j.1365-2427.2008.01943.x.
- Toffolon, M., et al. (2014) Prediction of Surface Temperature in Lakes with Different Morphology Using Air Temperature. Limnology and Oceanography, 59, pp. 2185–2202. doi.org/10.4319/lo.2014.59.6.2185.
- Ekercin, S & Örmeci, C (2010) Evaluating Climate Change Effects on Water and Salt Resources in Salt Lake, Turkey Using Multitemporal SPOT Imagery. Environmental Monitoring and Assessment, 163, pp. 361–368. doi.org/10.1007/s10661-009-0840-x.
- Rani, N., et al. (2010) Assessment of Temporal Variation in Water Quality of Some Important Rivers in Middle Gangetic Plains, India. Environmental Monitoring and Assessment, 174, pp. 401–415. doi.org/10.1007/s10661-010-1465-9.
- Reinart, A & Reinhold, M (2008) Mapping Surface Temperature in Large Lakes with MODIS Data. Remote Sensing of Environment, 112, pp. 603–611. doi.org/10.1016/j.rse.2007.05.015.
- Alcântara, E. H., et al. (2010) Remote Sensing of Water Surface Temperature and Heat Flux over a Tropical Hydroelectric Reservoir. Remote Sensing of Environment, 114, pp. 2651–2665. doi.org/10.1016/j.rse.2010.06.002.
- Hook, S. J., et al. (2007) Absolute Radiometric In-Flight Validation of Mid Infrared and Thermal Infrared Data from ASTER and MODIS on the Terra Spacecraft Using the Lake Tahoe, CA/NV, USA, Automated Validation Site. IEEE Transactions on Geoscience and Remote Sensing, 45, pp. 1798–1807. doi.org/10.1109/TGRS.2007.894564.
- Dirección General de Aguas Dirección General de Aguas (2016). Red Hidrométrica. 2016. Available at: Http:Dga.Cl (Accessed on November 25th, 2020).
- Dirección General de Aguas Dirección General de Aguas (2016a) Atlas Del Agua, Chile. Available at: Http:Www.Dga.Cl (Accessed on October 29th, 2021).
- Riffler, M., et al. (2015) Lake Surface Water Temperatures of European Alpine Lakes (1989–2013) Based on the Advanced Very High Resolution Radiometer (AVHRR) 1 Km Data Set. Earth System Science Data, 7, pp. 1–17. doi.org/10.5194/essd-7-1-2015.
- Thiery, W., et al. (2015) The Impact of the African Great Lakes on the Regional Climate. Journal of Climate, 28, pp. 4061–4085. doi.org/10.1175/JCLI-D-14-00565.1.
- Austin, J A & Colman, S M (2007) Lake Superior Summer Water Temperatures Are Increasing More Rapidly than Regional Temperatures: A Positive Ice-Albedo Feedback. Geophysical Research Letters, 34, p. L06604. doi.org/10.1029/2006GL029021.
- Dirección General de Agua (DGA, 2018). Red Hidrométrica. Available at: www.Dga.Cl (Accessed on October 29th, 2021).
- Köppen, W & Geiger, R (1928) Klimate Der Erde. Gotha Verlag. Justus Perthes, pp. 91–102.
- Viale, M & Garreaud, R (2015) Orographic Effects of the Subtropical and Extratropical Andes on Upwind Precipitating Clouds. Journal of Geophysical Research, 120, pp. 4962–4974. doi.org/10.1002/2014JD023014.
- González-Rodríguez, L., et al. (2019) Tilt and Orientation of a Flat Solar Collector to Capture Optimal Solar Irradiation in Chilean Latitudes. In: Proceedings of the 2nd International Conference on BioGeoSciences. Springer International Publishing: Cham, Switzerland, pp. 215–228.
- Valdovinos, C & Pedreros, P (2007) Geographic Variations in Shell Growth Rates of the Mussel Diplodon Chilensis from Temperate Lakes of Chile: Implications for Biodiversity Conservation. Limnologica, 37, pp. 63–75. doi.org/10.1016/j.limno.2006.08.007.
- Parra, O., et al. (2003) Caracterización y Tendencias Tróficas de Cinco Lagos Costeros de Chile Central. Limnetica, 22, pp. 51–83. doi.org/10.23818/limn.22.04.
- Fuentealba, C., et al. (2010) Variabilidad Genetica Local Del Bivalvo Dulceacuícola Diplodon Chilensis (Gray 1828) Proveniente de Tres Lagos Nahuelbutanos. Gayana, 74, pp. 113–124. doi.org/10.4067/S0717-65382010000200005.
- Karrasch, B., et al. (2011) Lake Laja: Ecomicrobiology and Microbial Assimilative Capacity of the Oligotrophic Andean Lake Laja, Chile. Revista Chilena de Historia Natural, 84, pp. 433–450. doi.org/10.4067/S0716-078X2011000300010.
- Briceño, I., et al. (2018) Determination of Water Quality Vichuquén Lake, Using Satellite Images Landsat 8, Sensor OLI, Year 2016, Chile. Revista de Teledetección, 52, pp. 67–78. doi.org/10.4995/raet.2018.10126.
- Schmid, M., et al. (2014) Lake Surface Temperatures in a Changing Climate: A Global Sensitivity Analysis. Climatic Change, 124, pp. 301–315. doi.org/10.1007/s10584-014-1087-2.
- Dirección General de Aguas (DGA) (2009) Redefinición de La Red Mínima de Lagos; POCH Ambiental SA: Santiago, Chile.
- Wan, Z., et al. (2015) MOD11A2 MODIS/Terra Land Surface Temperature/Emissivity 8-Day L3 Global 1 Km SIN Grid V006, NASA EOSDIS Land Processes DAAC. USGS Earth Resources Observation and Science (EROS) Center.
- Team, R R (2016) A Language and Environment for Statistical Computing; R Foundation for Statistical Computing: Vienna, Austria.
- Crosman, E T & Horel, J D (2009) MODIS-Derived Surface Temperature of the Great Salt Lake. Remote Sensing of Environment, 113, pp. 73–81. doi.org/10.1016/j.rse.2008.08.013.
- Oesch, D. C., et al. (2005) Lake Surface Water Temperature Retrieval Using Advanced Very High Resolution Radiometer and Moderate Resolution Imaging Spectroradiometer Data: Validation and Feasibility Study. Journal of Geophysical Research: Oceans, 110, pp. 1–17. doi.org/10.1029/2004JC002857.
- Kendall, M G (1946) The Advanced Theory of Statistics, 2nd ed.; Hafner Publishing Company: New York, NY, USA.
- Wambua, R. M., et al. (2018) Detection of Spatial, Temporal and Trend of Meteorological Drought Using Standardized Precipitation Index (SPI) and Effective Drought Index (EDI) in the Upper Tana River Basin, Kenya. Open Journal of Modern Hydrology, 8, pp. 83–100. doi.org/10.4236/ojmh.2018.83007.
- Alhaji, U. U., et al. (2018) Trend Analysis of Temperature in Gombe State Using Mann Kendall Trend Test. Journal of Scientific Research and Reports, 20, pp. 1–9.
- Sen, P K (1968) Estimates of the Regression Coefficient Based on Kendall’s Tau. Journal of the American Statistical Association, 63, pp. 1379–1389.
- Pettitt, A N (1979) A Non-parametric Approach to the Change-point Problem. Journal of the Royal Statistical Society. Series C (Applied Statistics), 28, pp. 126–135. doi.org/10.2307/2346729.
- Sneyers, R (1990) Technical Note No 143 on the Statistical Analysis of Series of Observations; World Meteorological Organization: Geneva, Switzerland.
- Hunziker, S., et al. (2018) Effects of Undetected Data Quality Issues on Climatological Analyses. Climate of the Past Discussions, 14, pp. 1–20. doi.org/10.5194/cp-14-1-2018.
- Cortés, G., et al. (2011) Climatic Sensitivity of Streamflow Timing in the Extratropical Western Andes Cordillera. Journal of Hydrology, 405, pp. 93–109. doi.org/10.1016/j.jhydrol.2011.05.013.
- Rodrigo, F S & Trigo, R M (2007) Trends in Daily Rainfall in the Iberian Peninsula from 1951 to 2002. International Journal of Climatology, 27, pp. 513–529. doi.org/10.1002/joc.1409.
- Pohlert, T (2017) Non-Parametric Trend Tests and Change-Point Detection; R package version 0.2. 0. 2017. (Accessed on 29 October 2021).
- Huovinen, P., et al. (2019) Mapping of Spatial and Temporal Variation of Water Characteristics through Satellite Remote Sensing in Lake Panguipulli, Chile. Science of the Total Environment, 679, pp. 196–208. doi.org/10.1016/j.scitotenv.2019.04.367.
- Rodríguez-López, L., et al. (2021) Retrieving Water Turbidity in Araucanian Lakes (South-Central Chile) Based on Multispectral Landsat Imagery. Remote Sensing, 13, p. 3133. doi.org/10.3390/rs13163133.
- Wan, W., et al. (2017) A Comprehensive Data Set of Lake Surface Water Temperature over the Tibetan Plateau Derived from MODIS LST Products 2001–2015. Scientific Data, 4, p. 170095. doi.org/10.1038/sdata.2017.95.
- Moser, K. A., et al. (2019) Mountain Lakes: Eyes on Global Environmental Change. Global and Planetary Change, 178, pp. 77–95. doi.org/10.1016/j.gloplacha.2019.04.001.
- Falvey, M & Garreaud, R D (2009) Regional Cooling in a Warming World: Recent Temperature Trends in the Southeast Pacific and along the West Coast of Subtropical South America (1979–2006). Journal of Geophysical Research: Atmospheres, 114, p. 114. doi.org/10.1029/2008JD010519.
- Carrasco, J F (2017) Evidencia de Cambio Climático En Chile Sus Proyecciones y Consecuencias. Available at: https://www.researchgate.net/profile/Jorge-Carrasco-8/publication/314421068_EVIDENCIA_DE_CAMBIO_CLIMATICO_EN_CHILE_SUS_PROYECCIONES_Y_CONSECUENCIAS/links/590e3142a6fdccad7b10ddf6/EVIDENCIA-DE-CAMBIO-CLIMATICO-EN-CHILE-SUS-PROYECCIONES-Y-CONSECUENCIAS.pdf (Accessed on 29 October 2021).
- Burger, F., et al. (2018) Seasonal and Elevational Contrasts in Temperature Trends in Central Chile between 1979 and 2015. Global and Planetary Change, 162, pp. 136–147. doi.org/10.1016/j.gloplacha.2018.01.005.
- Vuille, M., et al. (2015) Impact of the Global Warming Hiatus on Andean Temperature. Journal of Geophysical Research: Atmospheres, 120, pp. 3745–3757. doi.org/10.1002/2015JD023126.
- Nimptsch, J., et al. (2016) First Record of Toxins Associated with Cyanobacterial Blooms in Oligotrophic North Patagonian Lakes of Chile-a Genomic Approach. International Review of Hydrobiology, 101, pp. 57–68. doi.org/10.1002/iroh.201401780.
- Almanza, V., et al. (2019) Association between Trophic State, Watershed Use, and Blooms of Cyanobacteria in South-Central Chile. Limnologica, 75, pp. 30–41. doi.org/10.1016/j.limno.2018.11.004.
- Establece Normas Secundarias de Calidad Ambiental Para La Protección de Aguas Continentales Superficiales Del; Chile, 2003.
- Lu, J., et al. (2019) Nitrogen–Phosphorus-Associated Metabolic Activities during the Development of a Cyanobacterial Bloom Revealed by Metatranscriptomics. Scientific Reports, 9, pp. 1–11. doi.org/10.1038/s41598-019-38481-2.
- Adrian, R., et al. (2009) Lakes as Sentinels of Climate Change. Limnology and Oceanography, 54, pp. 2283–2297.
- Dokulil, M. T., et al. (2006) Twenty Years of Spatially Coherent Deepwater Warming in Lakes across Europe Related to the North Atlantic Oscillation. Limnology and Oceanography, 51, pp. 2787–2793.
- Salmaso, N & Mosello, R (2010) Limnological Research in the Deep Southern Subalpine Lakes: Synthesis, Directions and Perspectives. Advances in Oceanography and Limnology, 1, pp. 29–66. doi.org/10.4081/aiol.2010.5294.
- Iestyn Woolway, R & Merchant, C J (2017) Amplified Surface Temperature Response of Cold, Deep Lakes to Inter-Annual Air Temperature Variability. Scientific Reports, 7, p. 4130. doi.org/10.1038/s41598-017-04058-0.
- Woolway, R I & Merchant, C J (2018) Intralake Heterogeneity of Thermal Responses to Climate Change: A Study of Large Northern Hemisphere Lakes. Journal of Geophysical Research: Atmospheres, 123, pp. 3087–3098. doi.org/10.1002/2017JD027661.
- Straile, D., et al. (2003) Complex Effects of Winter Warming on the Physicochemical Characteristics of a Deep Lake. Limnology and Oceanography, 48, pp. 1432–1438. doi.org/10.4319/lo.2003.48.4.1432.
- Penk, M., et al. (2015) Elevated Temperatures Interact with Habitat Quality to Undermine Survival of Ectotherms in Climatic Refugia. Diversity and Distributions, 21, pp. 200–210. doi.org/10.1111/ddi.12259.
- Woolway, R I & Merchant, C J (2019) Worldwide Alteration of Lake Mixing Regimes in Response to Climate Change. Nature Geoscience, 12, pp. 271–276. doi.org/10.1038/s41561-019-0322-x.