Identifying molecular traces present in the environment is crucial in pollutant control procedures. Several monitoring methods have been created, but they were insufficient to measure biological hazards with high sensitivity.
The Major Constituent Analyzer (MCA), is used to analyze the vital constituents in the International Space Station (ISS) atmosphere (O2, N2, CO2, H2, and CH4). Total Organic Carbon Analyzer (TOCA) and Colorimetric Water Quality Monitoring Kit are used to analyze the water quality. Many other devices monitor total volatile organic compounds, but not all of them offer fully optimal characteristics.
Nanotechnology-based sensing methods—nanoplasmonic-based surface-enhanced Raman scattering (SERS) spectroscopy along with novel nanomaterials can be used to sense substrates and can be a promising means to enhance the TOCA and AQM systems.
These can also be used to identify organic molecules on space objects (like meteorites, comets) and other planets as they detect single molecules.
In a study published in the journal CEAS Space Journal, a hybrid SERS platform, supported by a nanoplasmonic porous silicon membrane, was developed and is capable of detecting trace levels of VOCs.
Methodology
The SERS system effectively combines microscopy and spectroscopy technologies. Figure 1 depicts a schematic illustration of the setup employed in the study.
The setup has two major subsystems—a Raman spectroscopy system and an optical confocal microscope.
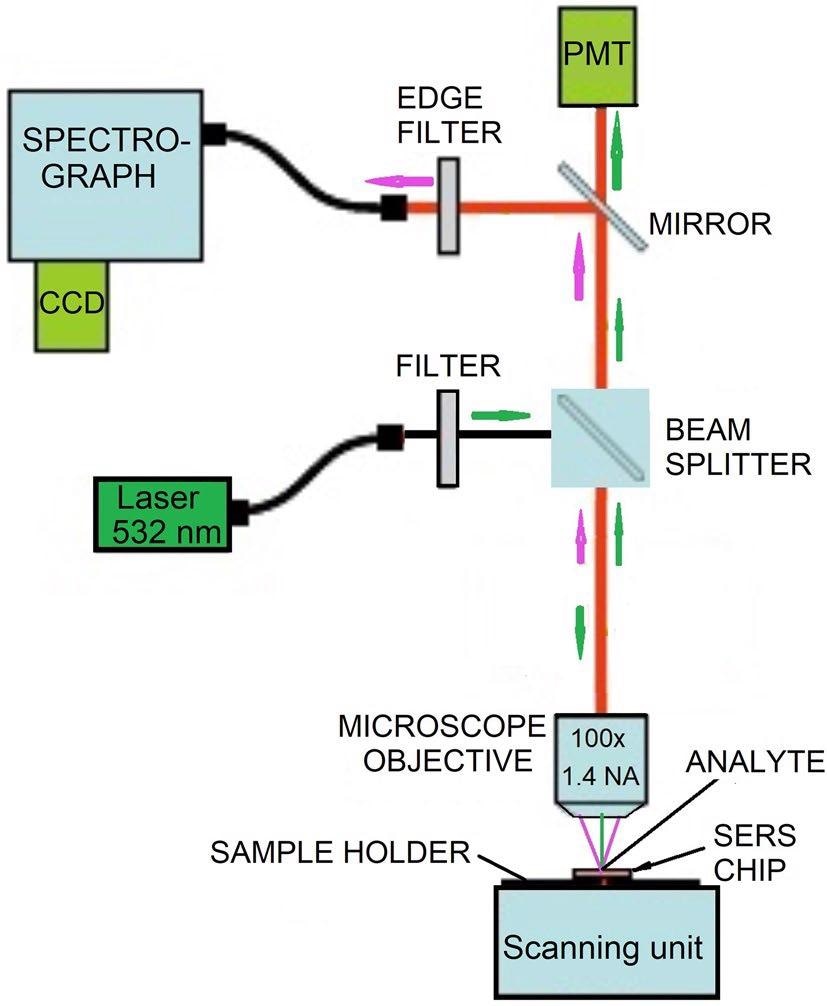
Figure 1. Schematic of the setup for the acquisition of SERS spectra. Image Credit: Snitka, et al., 2021
Numerous challenges were encountered in achieving a one molecule SERS sensitivity, including the quality of SERS substrate, heating effects, adhesion of the gas molecules, the temperature of the gas environment.
The silicon wafers purchased were cut into small pieces and abraded with silicon carbide paper to roughen the silicon surface. They were then washed with pure ethanol and dried using the nitrogen flow.
Silver SERS substrates were synthesized by direct silver ions reduction by elemental silicon. SERS samples were produced with the help of gas permeable porous membranes.
The SERS samples were structurally analyzed with a scanning electron microscope and a computer simulation experiment was used to analyze the dynamic of gas flow. Figure 2 depicts a SERS membrane sensor structure.
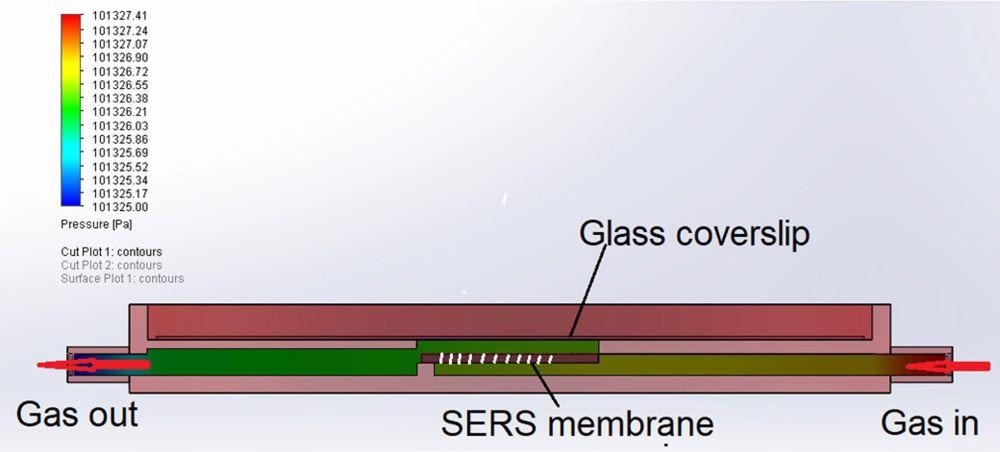
Figure 2. Structure of membrane sensor for gas flow simulation. Image Credit: Snitka, et al., 2021
The geometry of the SERS sensor was made using 3D plastic printing. Figure 3 depicts the design of the SERS membrane sensor.
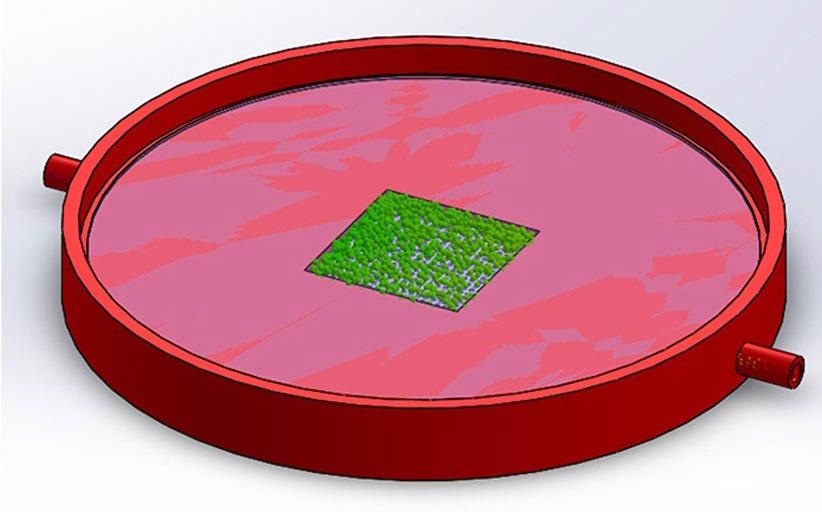
Figure 3. Computer 3D model of SERS membrane sensor. Image Credit: Snitka, et al., 2021
Gas pumping was carried out with the commercial mp6-gas micropump (see Figure 4).
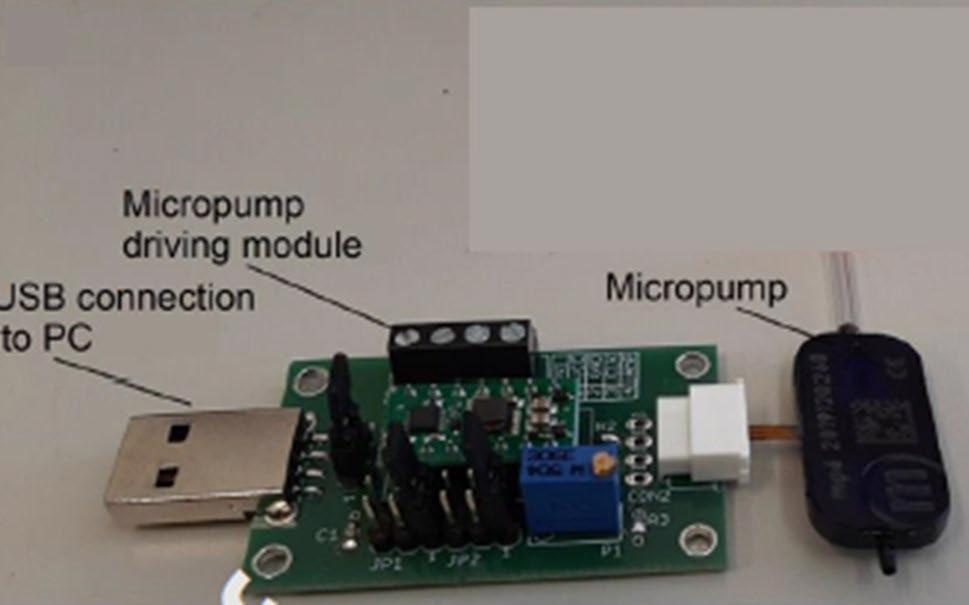
Figure 4. Micropump used for SERS membrane gas sensor test. Image Credit: Snitka, et al., 2021
Raman scattering spectra were evaluated at room temperature. Pre-processing of spectral data was carried out with the Spectragryph 1.2.10 software. Figure 5 shows the measurement setup.
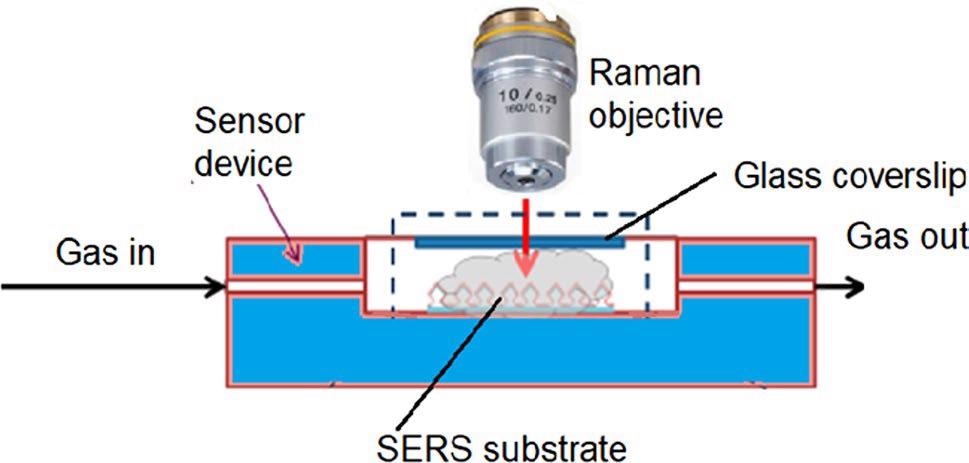
Figure 5. Experimental setup for continuous SERS measurements in the gas phase. Image Credit: Snitka, et al., 2021
Results
Ripples-type 3D silver SERS substrates (see Figure 5) were created and demonstrated good structural repeatability (see Figure 6a).
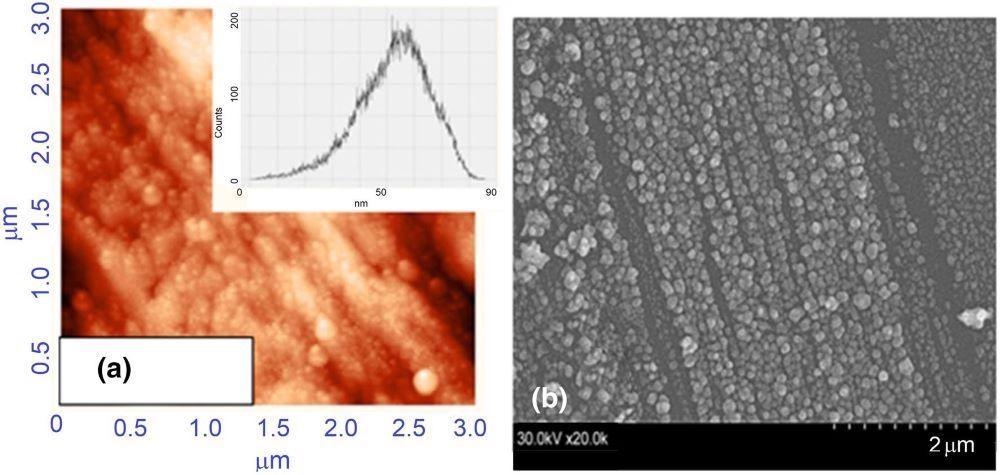
Figure 6. Images of AFM scanning area of the silver SERS (a) and SEM image (b). Image Credit: Snitka, et al., 2021
Raman signal for R6G monolayer’s relative enhancement was reported to be 107 (Figure 7).
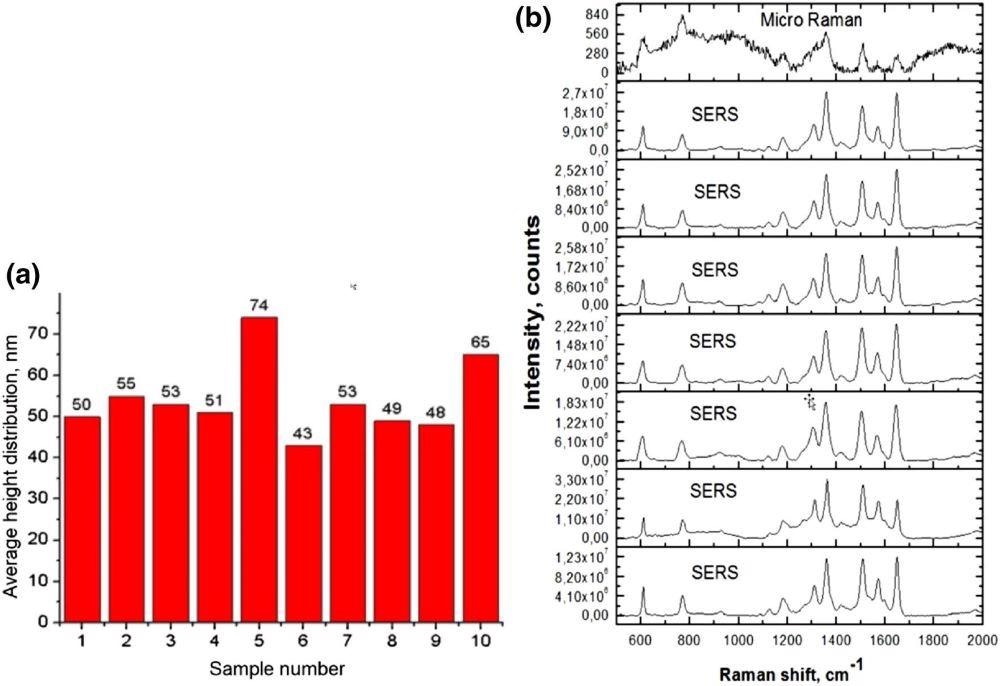
Figure 7. Ag/silicon SERS chip roughness repeatability (a), and SERS spectra of crystal violet solution at different spots (b). Image Credit: Snitka, et al., 2021
Figure 8 shows the SEM image of the developed silicon membrane with deposited nanoplasmonic silver nanoparticles.
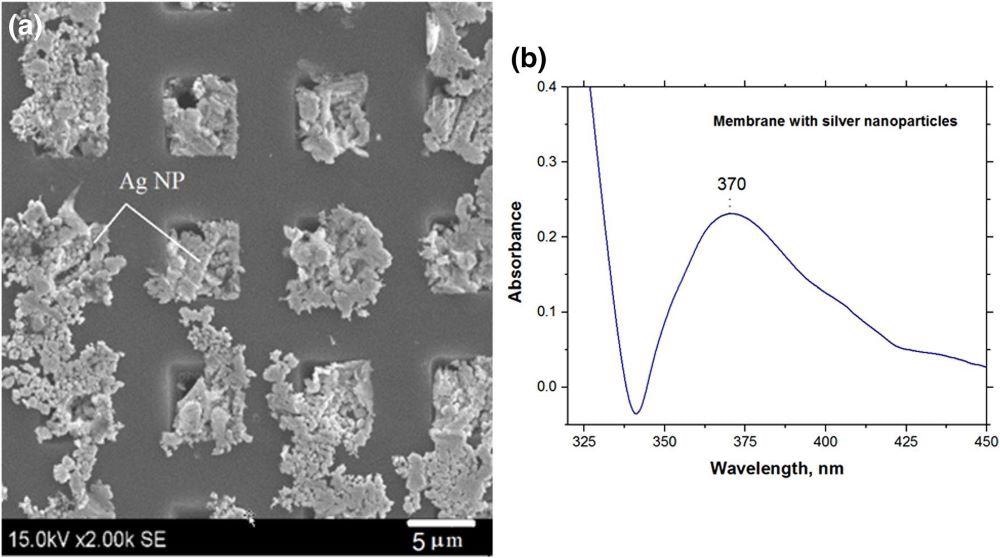
Figure 8. SEM images of Si membranes decorated with silver nanoparticles (a) and UV–Vis spectra of the membrane with silver nanoparticles (b). Image Credit: Snitka, et al., 2021
Figure 9 illustrates the scheme of the measurement experiment.
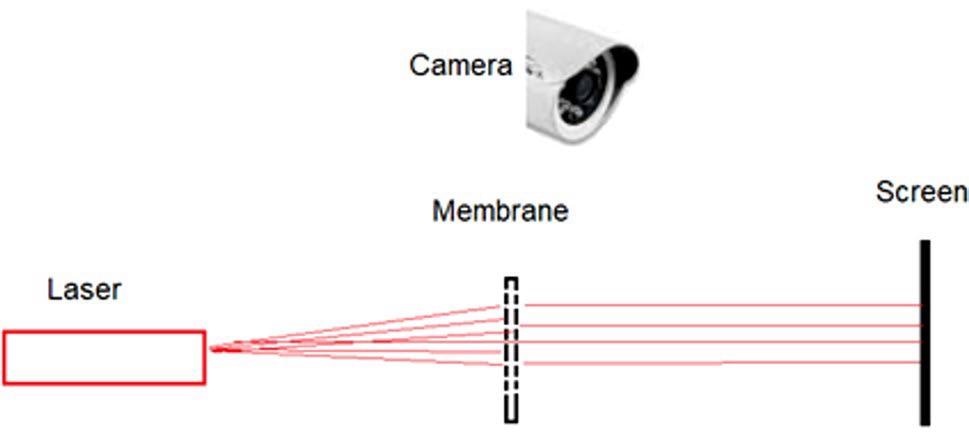
Figure 9. Scheme of an experiment to test the Ag nanoparticles growth and to control the permeability of the membrane pores. Image Credit: Snitka, et al., 2021
Prior to silver nanoparticles deposition, the laser light could be seen through the membrane on the screen (see Figure 10a).
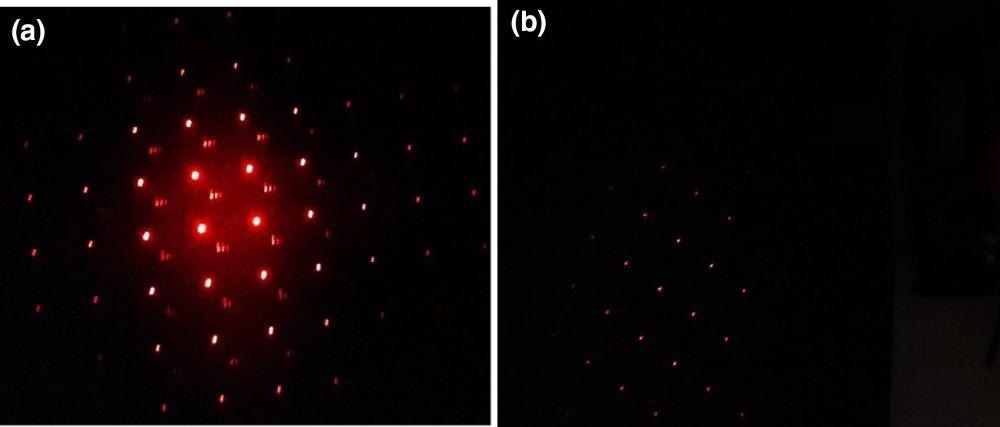
Figure 10. Photos of the permeability of the laser light of the porous Si membrane: blank membrane with the pores of 5 µm (a); membrane pores with silver nanoparticles (b). Image Credit: Snitka, et al., 2021
Once Ag nanoparticles are filled into the silicon membrane channels to create an Ag nanoplasmonic filter type layer, the nanoparticle deposition on the silicon membranes does not clog pores.
The SERS’ ability to detect trace concentrations of gas molecules was evaluated.
Hydrazine detection from the aqueous solution and the vapor phase was done with an analytical Raman platform. Figure 11 illustrates the results of the hydrazine detection.
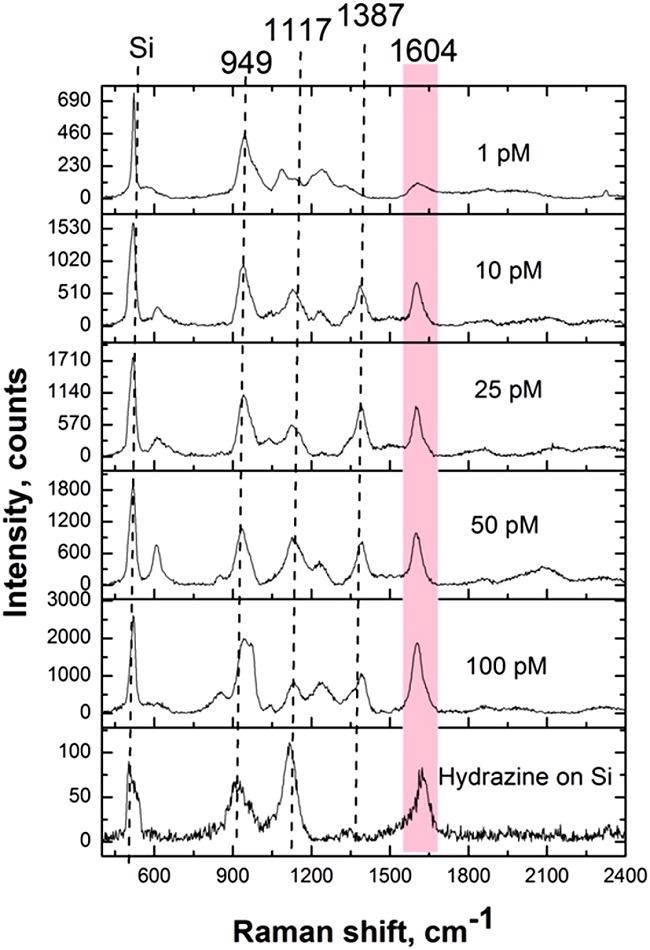
Figure 11. SERS spectra of hydrazine detected from solution on Ag/Si SERS substrate. Acquisition time: 20 seconds. Image Credit: Snitka, et al., 2021
Table 1 shows the assignments of the peaks corresponding to the hydrazine vibrations.
Table 1. Assignments of hydrazine SERS peaks. Source: Snitka, et al., 2021
| Vibrational mode |
Wavenumber cm-1 |
| NH2 rocking |
590.5 |
| N–N stretching |
949.2 |
| NH2 wagging |
1115.8 |
| NH2 twisting |
1386.2 |
| NH2 scissor |
1603.6 |
An analytical Raman platform was used to detect hydrazine from the vapor phase. Figure 12 illustrates the major peaks corresponding to hydrazine. Note that the hydrazine from the vapor phase was identified on non-functionalized silver SERS substrates.
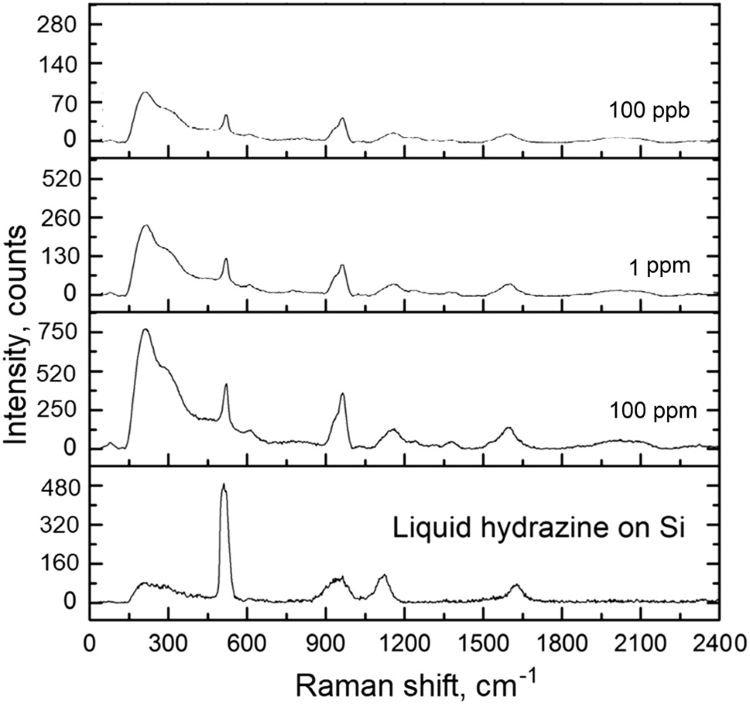
Figure 12. SERS spectra of hydrazine detected from the vapor phase on Ag/Si SERS substrate. Acquisition time: 40 seconds. Image Credit: Snitka, et al., 2021
3D Ag/Si SERS capability to detect trace concentration of non-polar gas molecules was analyzed with anisole. The results showed that the spectra of the anisole were similar to the level of measurement noise (Figure 13).
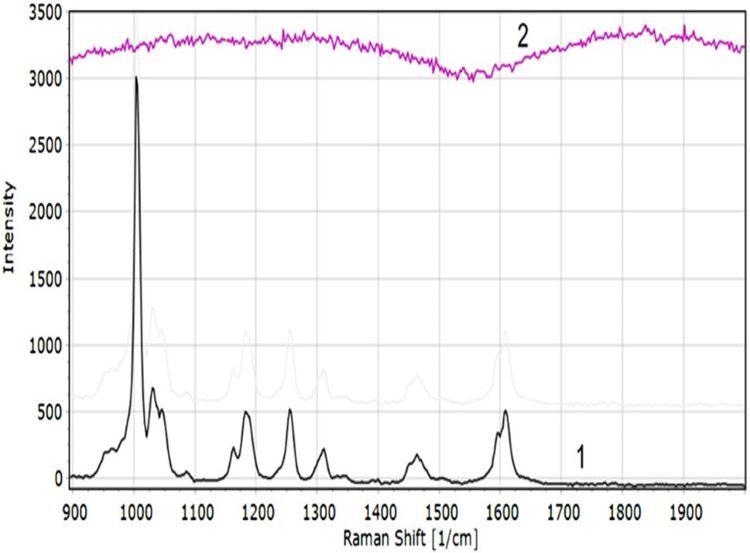
Figure 13. SERS spectrum of liquid anisole (1) and 100 ppb concentration anisole (2) on Ag/Si 3D substrate. Image Credit: Snitka, et al., 2021
The researchers further explored the reliability of the developed sensor, and the schematic representation of the test measurements is depicted in Figure 14a. Figure 14b shows the anisole vapor measurement results utilizing an Ag/Si membrane-type SERS sensor.
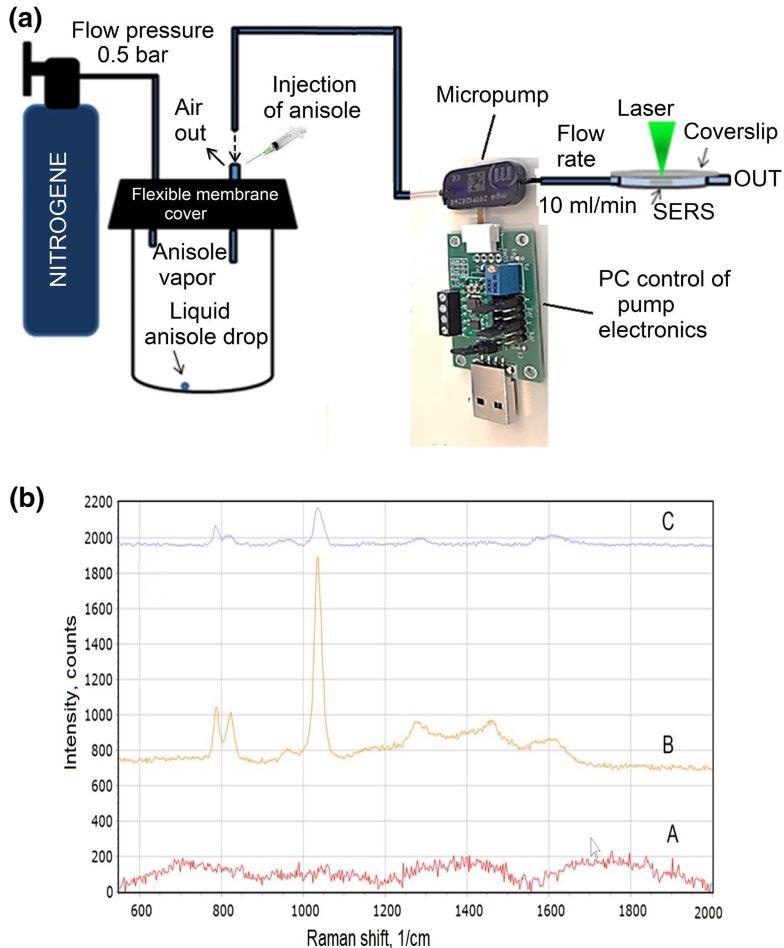
Figure 14. Experimental setup of the anisole vapor pumping and Raman scattering measuring platform (a); The SERS spectra of the anisole after the background removal (b): blank Si membrane decorated with silver nanoparticles (A); anisole vapor with the concentration of 10 ppmV. The spectra acquisition time: 20 seconds, the power of the laser on the sample: 0.17 mW (B); anisole vapor with the concentration of 0.5 ppbV. The spectra acquisition time: 60 seconds, the power of the laser on the sample: 0.17 mW (C). Image Credit: Snitka, et al., 2021.
Overall, results indicate that the created hybrid membrane-type SERS sensor has high sensitivity to organic gas molecules. It can be applied to contaminants detection in gas and liquid environments.
Conclusion
This study details the development of a novel silicon membrane decorated with silver nanoparticles on a SERS substrate. The developed molecular sensor shows high-sensitivity detection of VOCs in both gas and liquid environment.
These kinds of sensors can be used in numerous fields like space engineering and research, biomedical diagnostics, environment contamination control, gas agents’ detection, and security purposes. The Raman spectra-based fingerprinting enables the detection of molecules and also allows recognition of the molecule’s type.
Continue reading: Why Sensors are Vital for Space Exploration.
Journal Reference:
Snitka, V., Batiuskaite, D., Bruzaite, I., Lafont, U., Butenko, Y., Semprimoschnig, C. (2021) Surface-enhanced Raman scattering sensors for biomedical and molecular detection applications in space. CEAS Space Journal, 13, pp. 509–520. Available at: https://link.springer.com/article/10.1007%2Fs12567-021-00356-6#Sec1.
References and Further Reading
- Contamination Control Handbook (1969). Prepared by Sandia Laboratories, NASA SP-5076. Office of Technology Utilization, National Aeronautics and Space Administration.
- Kesselmeier, J & Staudt, M (1999) Biogenic volatile organic compounds (VOC): an overview on emission, physiology and ecology. Journal of Atmospheric Chemistry, 33, pp. 23–88. doi.org/10.1023/A:1006127516791.
- Galiana, H L (1971) University role in astronaut life-supporting systems: monitoring atmospheric contaminants. Massachusetts Institute of Technology, NASA CR-1826.
- Madzunkov, S. M., et al. (2016) Progress report on the spacecraft atmosphere monitor. In: Proceedings of 46th International Conference on Environmental Systems ICES-2016-284, 10–14 July 2016, Vienna, Austria, paper ICES-2016-284.
- Young, R. C., et al. (2003) Electronic nose for space program applications. Sensors and Actuators B: Chemical, 93, pp. 7–16. doi.org/10.1016/S0925-4005(03)00338-1.
- Walper, S. A., et al. (2018) Detecting biothreat agents: from current diagnostics to developing sensor technologies. ACS Sensors, 3, pp. 1894–2024. doi.org/10.1021/acssensors.8b00420.
- Peterson, V. B., et al. (2004) Characterization of microbial and chemical composition of shuttle wet waste with permanent gas and volatile organic compound analyses. Advances in Space Research, 34, pp. 1470–1476. doi.org/10.1016/j.asr.2003.11.005.
- Romoser, A. A., et al. (2017) Predicting air quality at first ingress into vehicles visiting the International Space Station. Aerospace Medicine and Human Performance, 88(2), pp. 104–113. doi.org/10.3357/AMHP.4702.2017.
- Perry, J L (2017) Trace Contaminant Control for the International Space Station’s Node 1—analysis, design, and verification. National Aeronautics and Space Administration, Marshall Space Flight Center, NASA/TP-2017-218235.
- Calaway, M. J., et al. (2014) Organic Contamination Baseline Study in NASA Johnson Space Center Astromaterials Curation Laboratories, NASA TP-2014-217393, pp. 1– 69.
- Wallace, W. T., et al. (2015) Electrothermal vaporization sample introduction for spaceflight water quality monitoring via gas chromatography-differential mobility spectrometry. Analytical Chemistry, 87, pp. 5981–5988. doi.org/10.1021/acs.analchem.5b00055.
- Limero, T. F., et al. (2013) In: 43rd International Conference on Environmental Systems, p. 3484, AIAA, Vail, CO.
- McCoy, J. T., et al. (2011) In: 41st International Conference on Environmental Systems, p. 5153, AIAA, Portland, OR, USA.
- Yuan, Z., et al. (2019) Approaches to enhancing gas sensing properties: a review. Sensors, 7, p. 1495. doi.org/10.3390/s19071495.
- Qian, X & Nie, S (2008) Single-molecule and single-nanoparticle SERS: from fundamental mechanisms to biomedical applications. Chemical Society Reviews, 37, pp. 912–920. doi.org/10.1039/B708839F.
- Singh, E & Meyyappan, M (2017) Flexible graphene-based wearable gas and chemical sensors. ACS Applied Materials and Interfaces, 9, pp. 34544–34586. doi.org/10.1021/acsami.7b07063.
- European Network on new sensing technologies for air-pollution control and environmental sustainability (EuNetAir). Available at: http://www.cost.eunetair.it/ (Accessed January 3rd, 2021).
- Samsung SARS-CoV-2 detection with SERS spectroscopy research. Available at: https://devpost.com/software/samsung-research-for-sars-cov-2-detection-with-spectroscopy (Accessed January 3rd, 2021).
- Ramanauskaite, L & Snitka, V (2015) The synthesis of controlled shape nanoplasmonic silver-silica structures by combining sol–gel technique and direct silver reduction. Nanoscale Research Letters, 10, pp. 133. doi.org/10.1186/s11671-015-0839-x.
- Rae, S & Khan, I (2010) Surface enhanced Raman spectroscopy (SERS) sensors for gas analysis. Analyst, 135(6), pp. 1365–1369. doi.org/10.1039/B924537E.
- Sweetenham, C S & Notingher, I (2011) Combined atomic force microscopy-Raman mapping of electric field enhancement and surface-enhanced Raman scattering hotspots for nanosphere lithography substrates. Journal of Nanophotonics, 5, pp. p. 059504. doi.org/10.1117/1.3595345.
- https://www.effemm2.de/spectragryph/ (Accessed January 3rd, 2021).
- Ramanauskaite, L., et al. (2018) SERS based monitoring of toluene vapors at ambient and elevated temperatures by using a ruffled silver nanolayer as a substrate. Microchimica Acta, 185, p. 477. doi.org/10.1007/s00604-018-3013-1.