For instance, even in loud environments, the sensors must diagnose human voices, abdominal sounds, and heart sounds by assessing skin vibration. Sensors that can supervise long-term and repeated exposure to hand-held vibration tools and whole-body vibrations can aid in the prevention of neurological, vascular, and musculoskeletal health issues such as hand-arm vibration disorder.
Rather than a heavy vibration sensor, wearable and flexible vibration sensors that are simple to connect to equipment or the human body have been established for these applications.
Moreover, conventional wearable sensors lack high-quality vibration–response performance and aesthetics. Such sensors, in particular, have primarily used piezoelectric, triboelectric, and piezoresistive mechanisms. As a result, they have a good sensitivity only at a specific resonance frequency and do not have a consistent sensitivity over a broad frequency range.
In research published in the MDPI journal micromachines, a wearable and flexible vibration sensor with high vibration response and transparency was created using a hybrid diaphragm structure that combines the benefits of organic and inorganic materials.
The device structure is composed of SU-8, a UV-curable polymer with a solution-based procedure and crosslinking property that allows for the formation of ultrathin and flexible sensor structures with complex patterns.
The polymer has less rigidity and thus a superior mechanical response than inorganic materials due to its low Young’s modulus. Furthermore, an indium tin oxide (ITO) electrode was used to compensate for SU-8’s inherent lack of conductivity while maintaining high transparency and versatility. When the vibration sensor identifies vibration, the high conductivity of ITO enables the electric signal to be output consistently.
Methodology
For a detailed description of the configuration, a flexible vibration sensor comprised of 400 patterned diaphragms with a diameter of 400 m was crafted (Figure 1a), where only 25 arrays are schematically depicted. The diaphragm, support, and substrate are made of SU-8, a UV-curable, thermally and chemically stable polymer (Figure 1b).
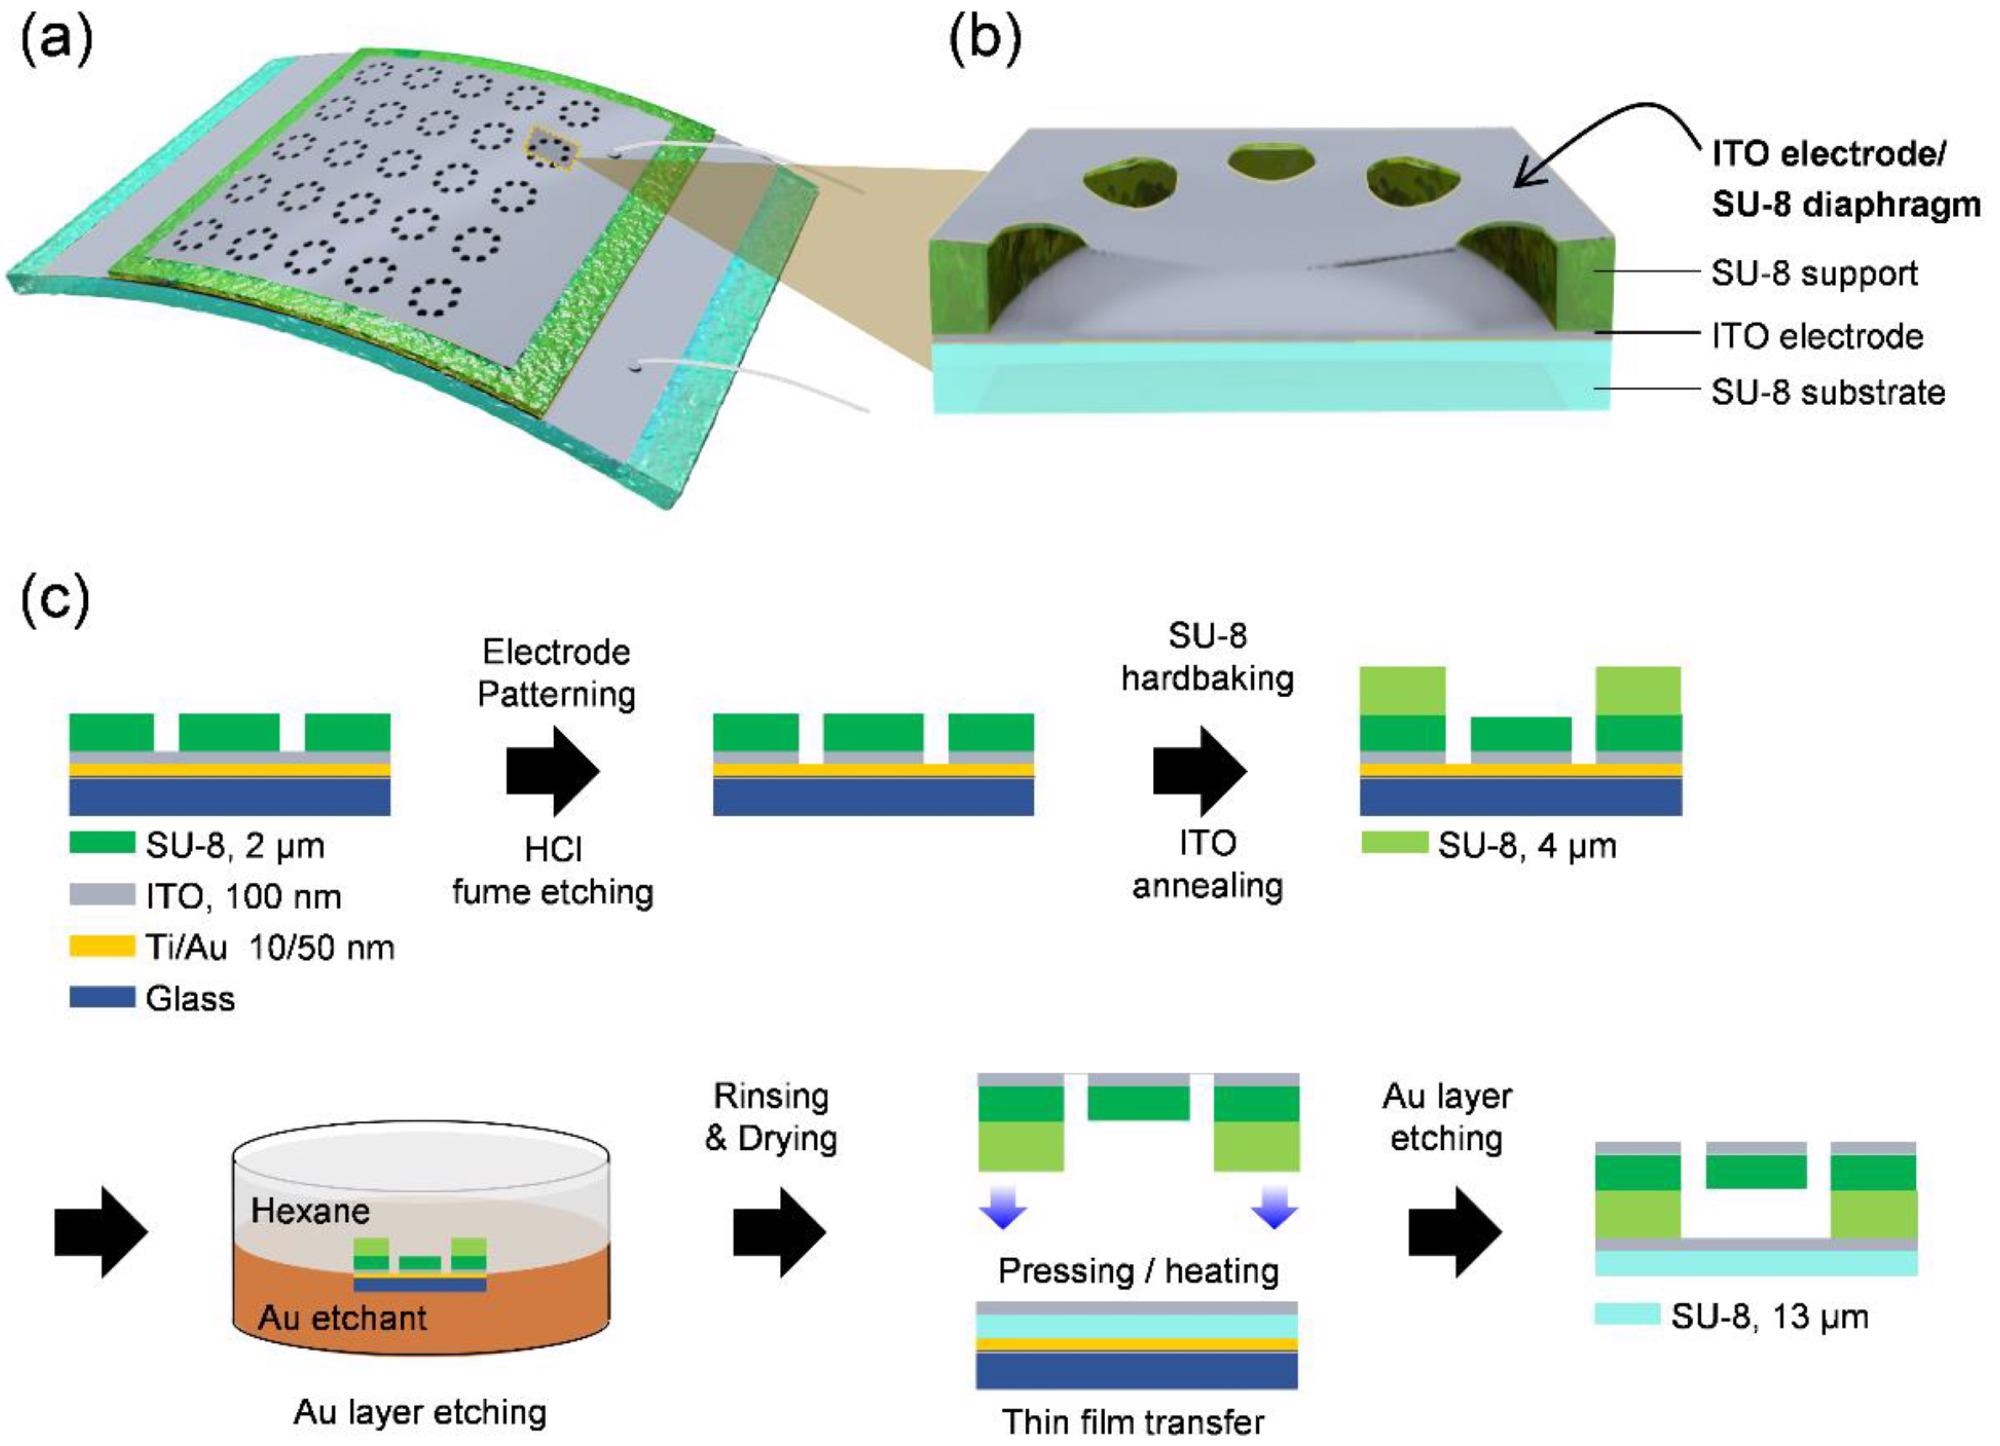
Figure 1. Design and fabrication process of the vibration sensor. (a) Schematic design of the transparent and flexible vibration sensor consisting of a diaphragm array. (b) Schematic of the cross-sectional viewed suspended diaphragm of the vibration sensor. (c) The overall fabrication process of the vibration sensor. Image Credit: Lee, et al., 2021
As a sacrificial template, a Ti/Au film (10/50 nm) was thermally evaporated onto a washed glass carrier wafer during the diaphragm structure fabrication (Figure 1c). ITO (100 nm) was faltered as the top electrode (SRN-120, SORONA).
Results and Discussion
The top electrode/diaphragm and bottom electrode/substrate layers of the sensor were crafted to be ITO/SU-8 layers. In a broad sense, after ITO formation, a post-annealing procedure at temperatures ranging from 300 to 700 °C is needed to attain high transparency and conductivity.
Conversely, ITO formed on a polymer substrate like PET cannot accomplish such a high-temperature post-annealing operation and must therefore be formed under restricted and demanding circumstances.
At a wavelength of 550 nm, the as-deposited ITO electrode on the SU-8 layer demonstrated 70% transmittance (Figure 2a). The correlation of the ITO/SU-8 bilayer (navy line) and the SU-8 monolayer (black line) demonstrates that the ITO reduces transmittance.
Many findings indicate that as the thermal annealing temperature rises, the conductivity of ITO increases since the structure of the ITO films is reorganized, allowing the Sn ions to become efficient dopants.
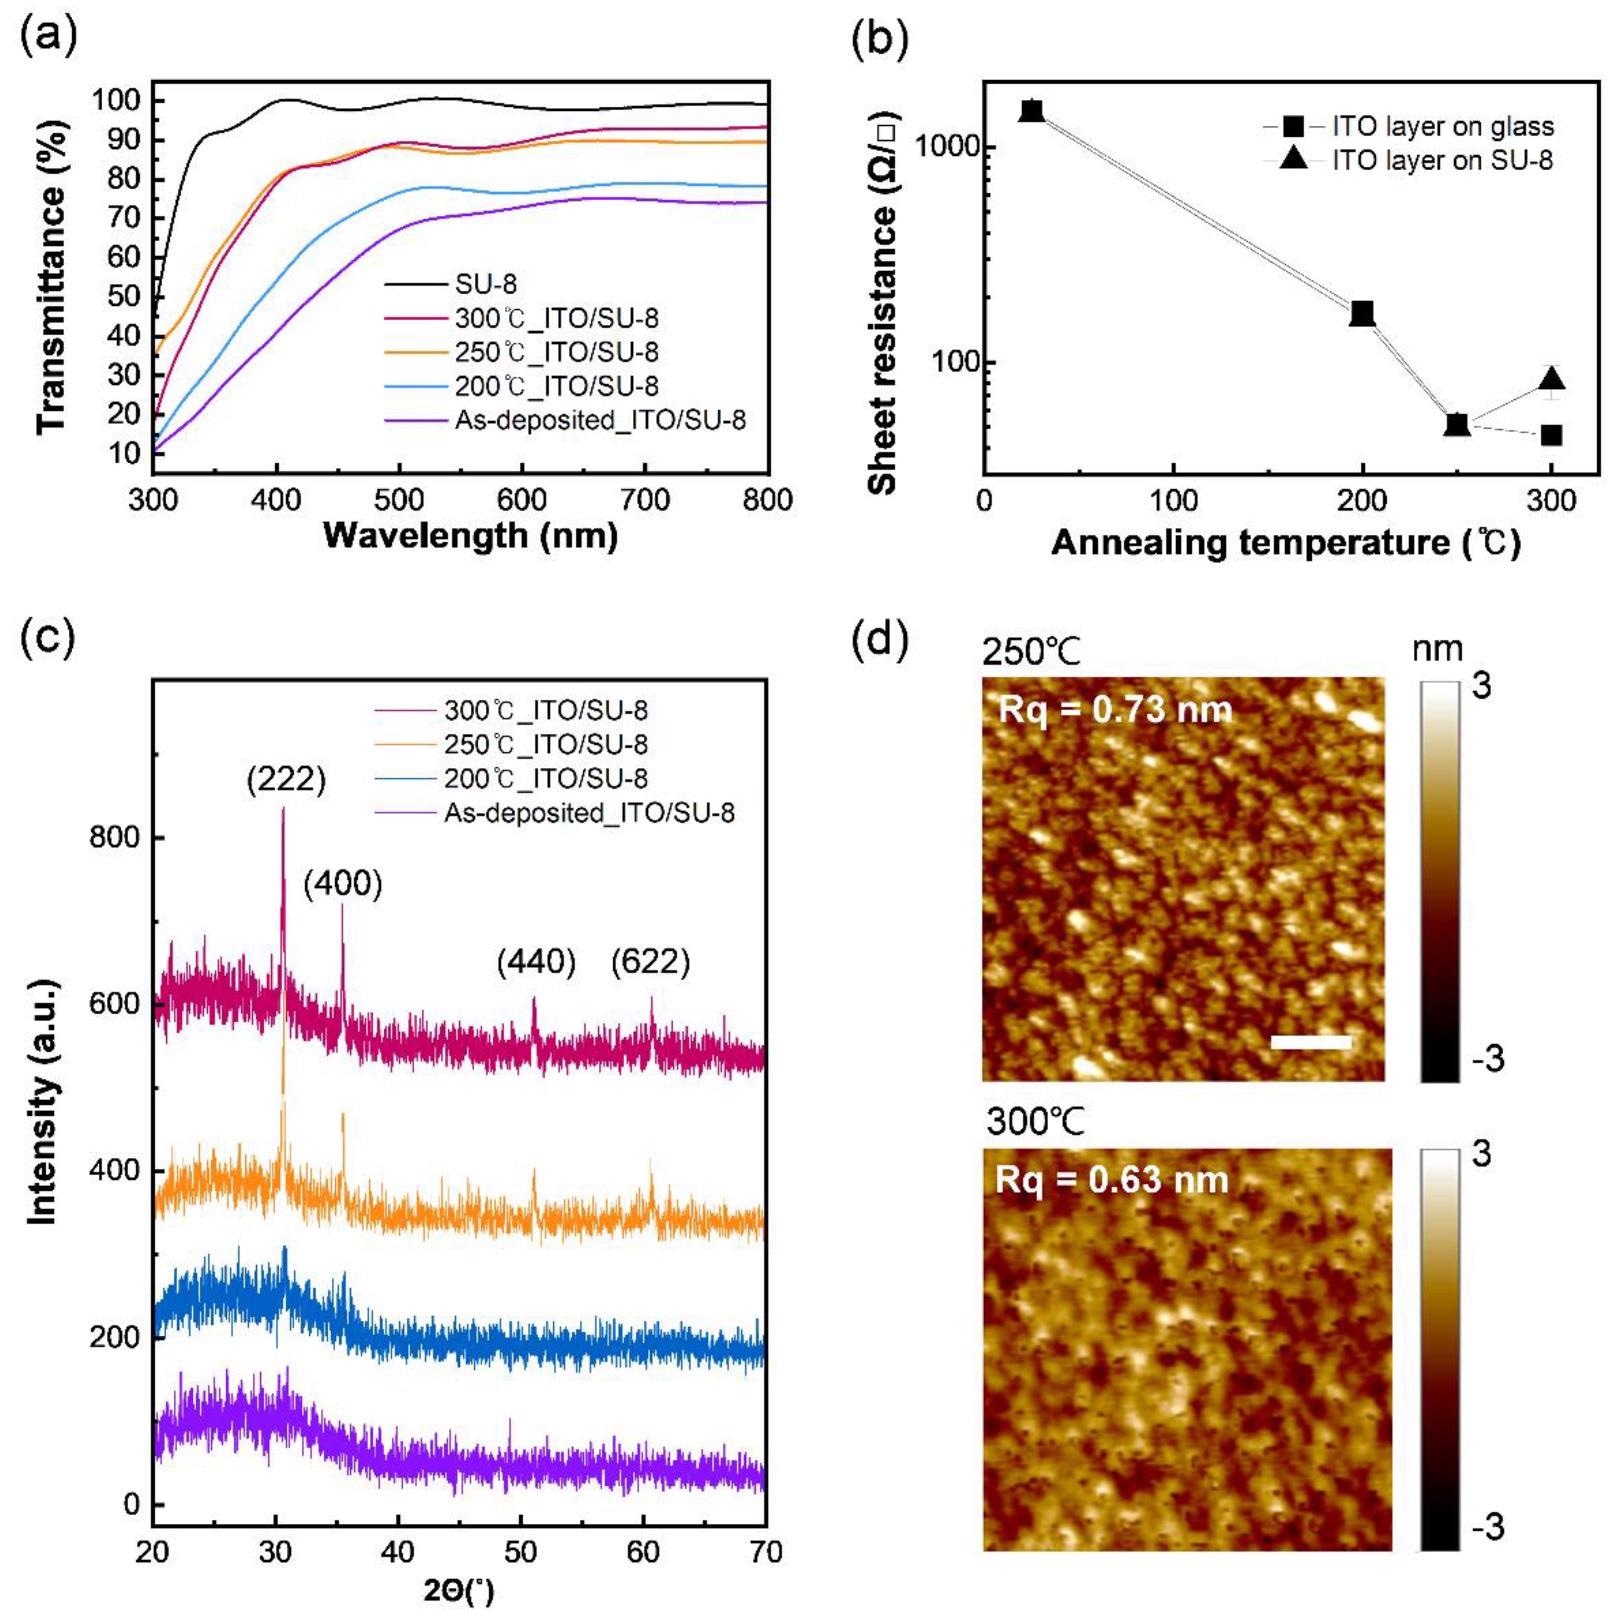
Figure 2. Optical and electrical characteristics of the ITO/SU-8 layers for the vibration sensor. (a) Transmittance of the ITO/SU-8 layer within a UV-visible wavelength range (300–800 nm) depending on the temperature of the post-thermal annealing. The black line represents a SU-8 layer without an ITO electrode. (b) The conductivity of the ITO electrode on glass and the SU-8 layer depends on thermal annealing. (c) X-ray diffraction image of ITO/SU-8 layer depending on the temperature of post-thermal annealing. (d) Surface morphology of ITO/SU-8 layer after thermal annealing at 250 °C (Top) and 300 °C (Bottom) (scale bar, 100 nm). Image Credit: Lee, et al., 2021
The crystalline properties and surface morphology of the ITO electrode on the SU-8 layer can explain the discrepancy in transmittance and conductivity caused by thermal annealing. X-ray diffraction (XRD) data was used to examine the crystalline properties (Figure 2c).
The crystallite size was calculated from the XRD pattern using Scherrer’s formula (Table 1).
Table 1. The average crystallite size (D) of the ITO electrode on the SU-8 layer was annealed at 200 °C, 250 °C, and 300 °C. Source: Lee, et al., 2021
| Temperature (°C) |
2θ (°) 1 |
β |
D (nm) |
| 200 |
30.78 |
0.0044 |
34.42 |
| 250 |
30.66 |
0.0019 |
78.21 |
| 300 |
30.64 |
0.0021 |
71.69 |
As an outcome, the surface morphology of thermally annealed ITO on SU-8 assessed using an atomic force microscope suggests that the morphology of SU-8 shifted and affected the crystallinity of ITO (Figure 2d).
It also backs up the finding that ITO on SU-8 has greater sheet resistance than glass, which does not decompose at the same temperature of 300 °C (Figure 2b).
The optimized temperature condition of post-thermal annealing for the ITO/SU-8 layer results in a sensor with high transparency, allowing the image behind the sensor to be seen precisely (Figure 3a).
At 700 μm intervals, a diaphragm with a width of 2 μm and a diameter of 400 μm was organized in an array (Figure 3b, c).
The diaphragm was stopped on the diaphragm support 4 μm from the bottom electrode, and the preliminary deflection became less than 100 nm, efficiently forming an air gap (Figure 3d).
Carbon and indium elemental mapping images obtained using energy-dispersive X-ray spectroscopy (Figure 3e) reveal that the device’s framework is created of organic material, i.e., a polymer, and that the electrode is built of an inorganic material, ITO.
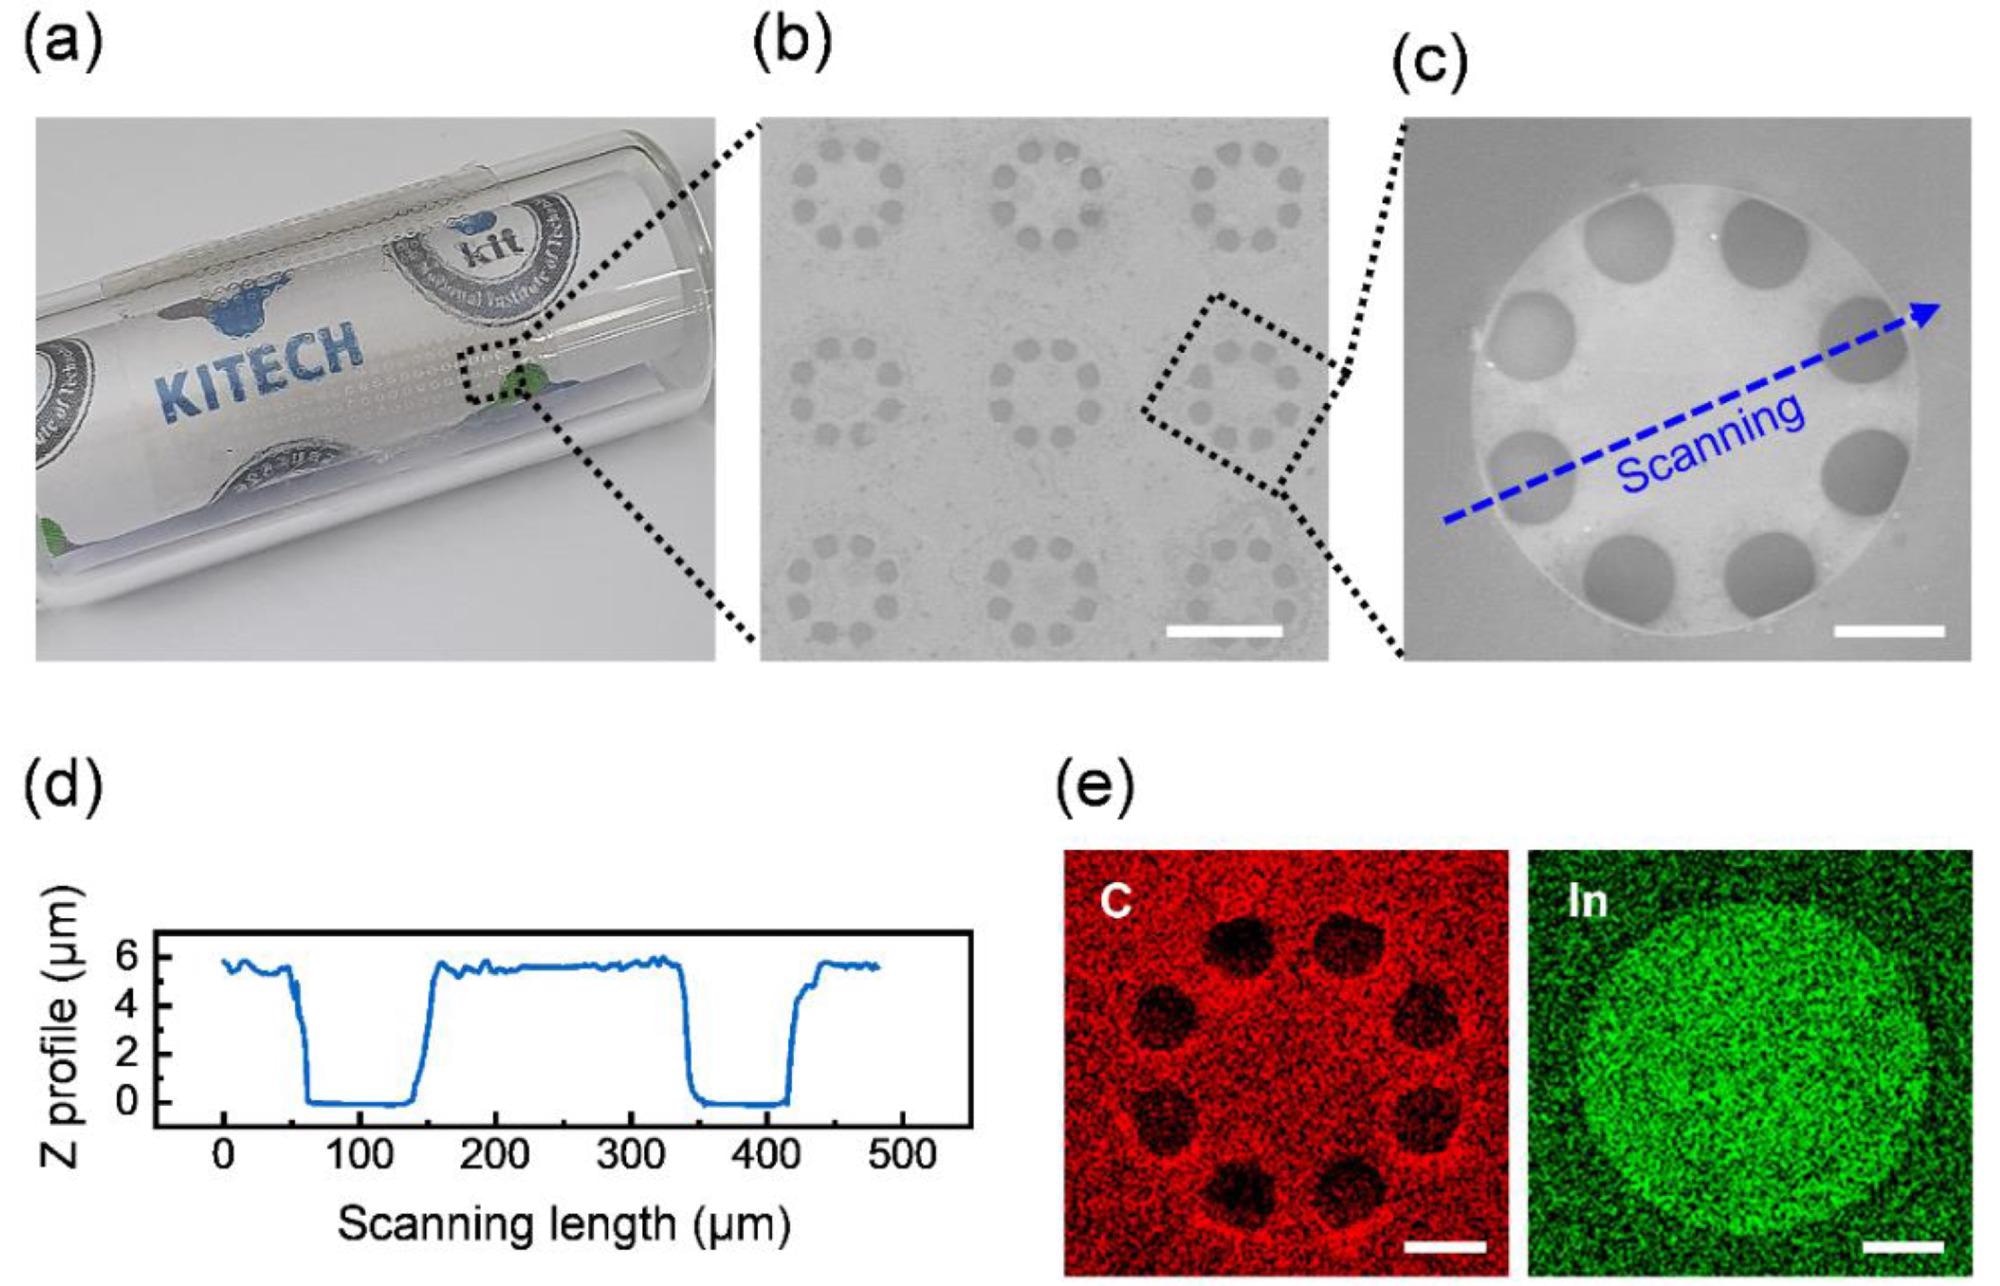
Figure 3. Configuration of the vibration sensor. (a) Photographic showing the transparency and flexibility of the vibration sensor. SEM image of (b) the diaphragm array (scale bar, 400 nm) and (c) a diaphragm structure of the vibration sensor (scale bar, 100 nm). (d) Height profile of cross-sectional view for the suspended diaphragm structure. The scanning route of (d) is shown in the dashed arrow of (c). (e) Carbon and indium elemental mapping data were obtained using energy-dispersive X-ray mapping analysis for the same diaphragm in the SEM image (c) (scale bar, 100 nm). Image Credit: Lee, et al., 2021
To evaluate the vibration response, the wearable and flexible sensor with a diaphragm structure was hooked up with an interface circuit constituted of a charge and voltage amplifier (Figure 4a).
To eliminate electromagnetic impacts from the speaker, the vibration linked to the interface circuit was preserved in a metal shielding box (Figure 4b, c).
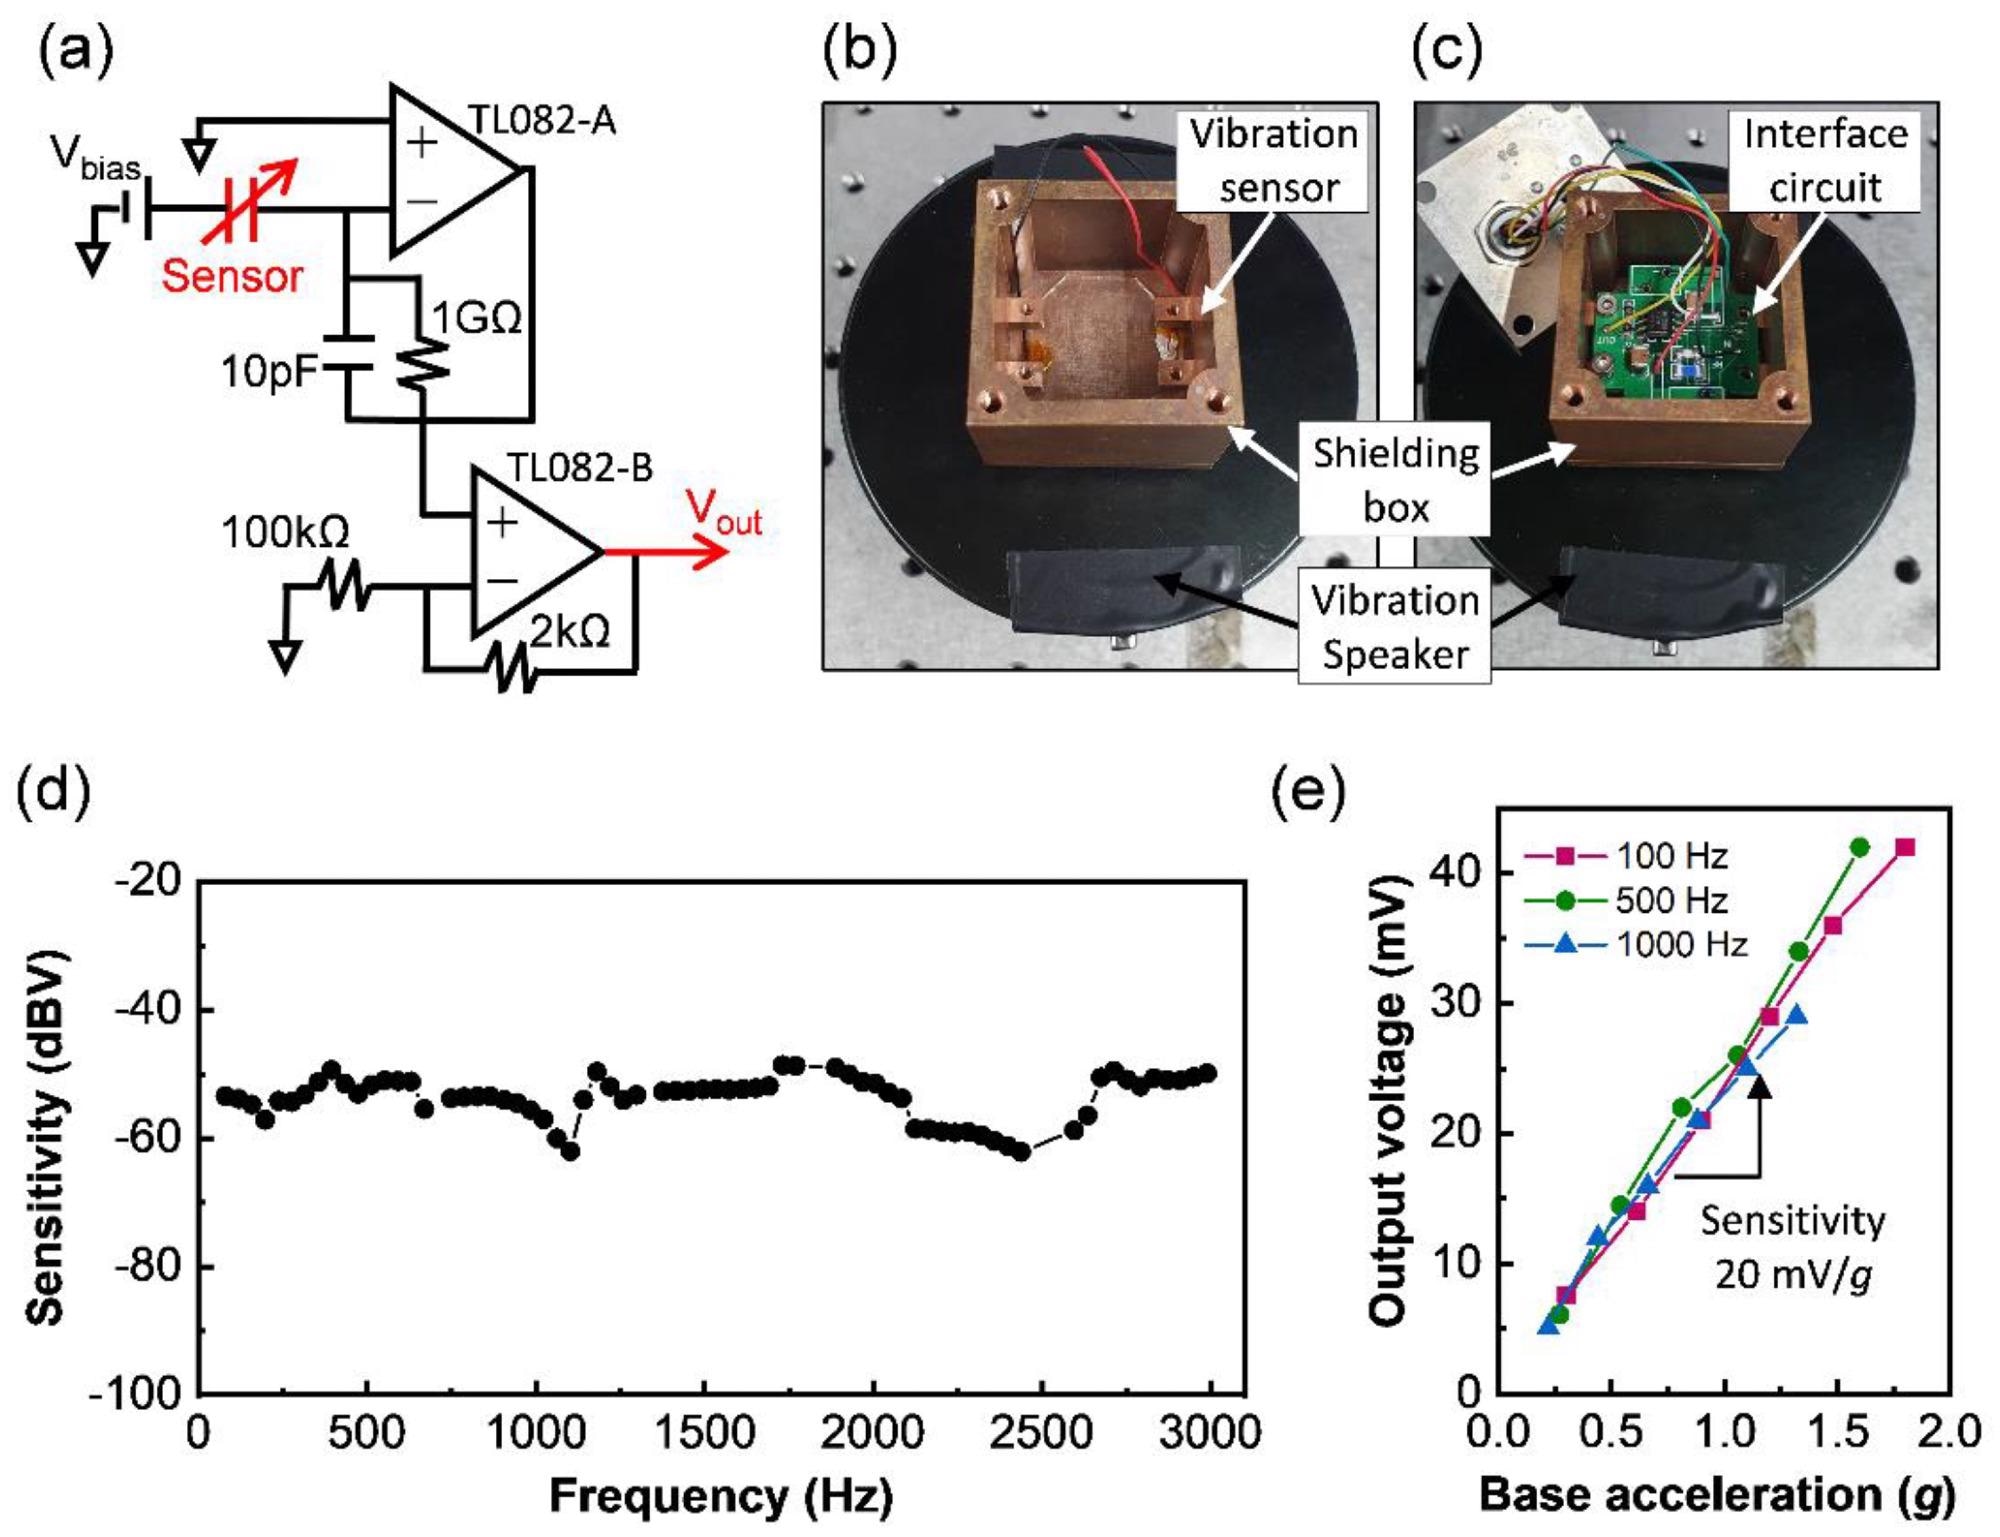
Figure 4. Experimental setup and measurement results for the vibrational response of the sensor. (a) Interface circuit diagram connected to the sensor. Photographic images of (b) the device and (c) the electric circuit located in a shielding box made of metals on the vibration speaker. (d) Frequency response and (e) linearity of sensitivity of the fabricated sensor depending on input frequencies. Image Credit: Lee, et al., 2021
The device’s sensitivity was evaluated over a frequency range of 80–3000 Hz, taking into account the fundamental voice frequency range (80–250 Hz) and standard telephony bandwidth (300–3400 Hz). The device had a flat frequency response (Figure 4d), with mildly retained sensitivity for the target frequency range.
The device has a high vibrational sensitivity of 20 mV/g (Figure 4e), which can be contributed to the diaphragm’s low stiffness due to SU-8’s low Young’s modulus and residual stress, as well as the hole-patterned and ultrathin wheel-shaped diaphragm structure for large capacitance modifications.
The fabricated sensor highlighted the ability of wearable and flexible vibration sensors for vibration-related monitoring systems and a skin-attachable microphone, with the features such as high transparency and a vibrational response like flat frequency response, linear and high sensitivity.
To begin, the sensor was attached to the end of the hand using a cordless drill, a popularly used hand-held vibration tool (Figure 5a).
The output electric signal’s waveform and frequency spectrum demonstrate that vibration signals of over 220 Hz and their harmonics were transferred to the hand throughout the drill operation (Figure 5b).
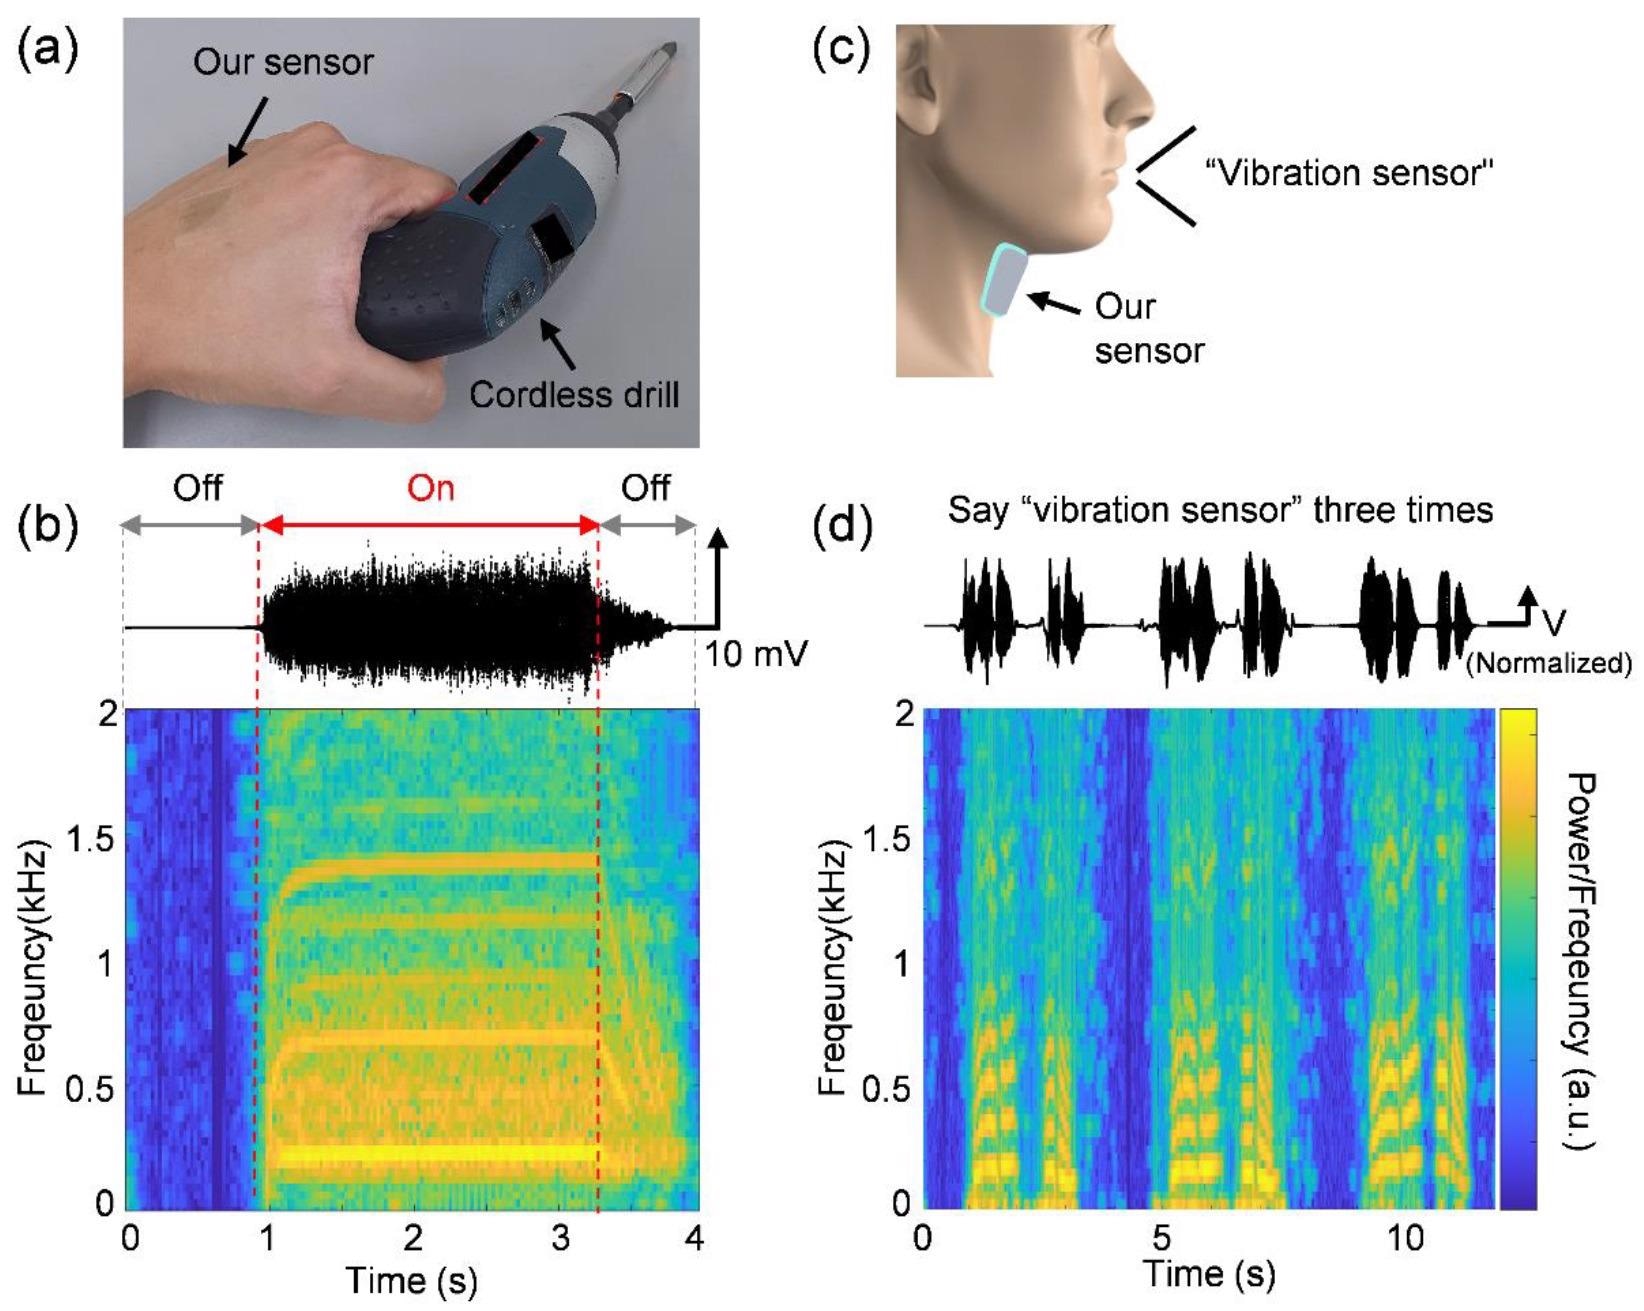
Figure 5. Vibration sensing application of the transparent and flexible vibration sensor. (a) Photographic image of the vibration sensor attached to the back of the hand, which grabbed a cordless drill. (b) Output waveform and frequency spectrum of the transmitted vibration to the hand-measured by the vibration sensor when a cordless drill is turned on and off. (c) Schematic of the vibration sensor attached to the human neck skin. (d) Output waveform and frequency spectrum of the spoken voice measured by the vibration sensor when a human said “vibration sensor” three times. The output waveforms were filtered by removing electrical noise signals owing to external electromagnetic fields. Image Credit: Lee, et al., 2021
Furthermore, the device was connected to the neck skin and was used to identify the human voice by assessing the vibration of the neck skin when the human spoke (Figure 5c).
Following a vocal sample, the waveform and frequency spectrum of the output electric signal revealed that the sensor could identify a human voice by assessing the base vibration of the neck skin (Figure 5d).
Conclusion
The benefits of organic and inorganic hybrid materials in a wheel-shaped diaphragm structure were used to create a highly sensitive, transparent, and flexible vibration sensor. The UV-curable polymer SU-8, which has greater processability and limited stiffness, allows the fabricated sensor to have a high vibrational response, including flat frequency response and high/linear sensitivity.
The high conductivity ITO electrode contributes to stable vibration detection by assisting in achieving a constant output of the electrical signal. The sensor’s high aesthetics are due to the high transparency of ITO and SU-8, which is acquired by optimizing the temperature of the post-annealing procedure.
Furthermore, the sensor can detect human speech by evaluating the vibration acceleration of the skin surface. As a result, the vibration in this study has a great potential for use as a wearable vibration sensor for vibration-related health monitoring and voice sensing.
Journal Reference:
Lee, S., Lee, E. K., Lee, E., Bae, G. Y. (2021) Transparent and Flexible Vibration Sensor Based on a Wheel-Shaped Hybrid Thin Membrane. Micromachines, 12(10), p. 1246. Available Online: https://www.mdpi.com/2072-666X/12/10/1246/htm.
References and Further Reading
- Bai, L., et al. (2019) Vibration in a multistage centrifugal pump under varied conditions. Shock and Vibration, 2019, p. 2057031. doi.org/10.1155/2019/2057031.
- Glowacz, A & Glowacz, W (2018) Vibration-based fault diagnosis of commutator motor. Shock and Vibration, 2018, p. 7460419. doi.org/10.1155/2018/7460419.
- Potočnik, P & Govekar, E (2017) Semi-supervised vibration-based classification and condition monitoring of compressors. Mechanical Systems and Signal Processing, 93, pp. 51–65. doi.org/10.1016/j.ymssp.2017.01.048.
- Du, X., et al. (2018) Bowel sounds identification and migrating motor complex detection with low-cost piezoelectric acoustic sensing device. Sensors, 18, p. 4240. doi.org/10.3390/s18124240.
- Bonde, A., et al. (2018) VVRRM: Vehicular vibration-based heart RR-interval monitoring system. In Proceedings of the 19th International Workshop on Mobile Computing Systems & Applications, Tempe, AZ, USA, 12–13 February; pp. 37–42. doi.org/10.1145/3177102.3177110.
- Lee, S., et al. (2019) An ultrathin conformable vibration-responsive electronic skin for quantitative vocal recognition. Nature Communications, 10, p. 2468. doi.org/10.1038/s41467-019-10465-w.
- Souissi, H & Hamaoui, A (2018) Effect of Human Exposure to Whole-Body Vibration in Transport. In Neuroergonomics; Elsevier: Amsterdam, The Netherlands, p. 229. doi.org/10.1016/B978-0-12-811926-6.00049-X.
- Lindsell, C J & Griffin, M J (2002) Normative data for vascular and neurological tests of the hand-arm vibration syndrome. International Archives of Occupational and Environmental Health, 75, pp. 43–54. doi.org/10.1007/s004200100277.
- Heaver, C., et al. (2011) Hand–arm vibration syndrome: A common occupational hazard in industrialized countries. The Journal of Hand Surgery (European Volume), 36, pp. 354–363. doi.org/10.1177%2F1753193410396636.
- Park, J., et al. (2014) Giant tunneling piezoresistance of composite elastomers with interlocked microdome arrays for ultrasensitive and multimodal electronic skins. ACS Nano, 8, pp. 4689–4697. doi.org/10.1021/nn500441k.
- Kang, D., et al. (2014) Ultrasensitive mechanical crack-based sensor inspired by the spider sensory system. Nature, 516, pp. 222–226. doi.org/10.1038/nature14002.
- Dinh Le, T. S., et al. (2019) Ultrasensitive anti-interference voice recognition by bio-inspired skin-attachable self-cleaning acoustic sensors. ACS Nano, 13, pp. 13293–13303. doi.org/10.1021/acsnano.9b06354.
- Kang, S., et al. (2018) Transparent and conductive nanomembranes with orthogonal silver nanowire arrays for skin-attachable loudspeakers and microphones. Science Advances, 4, p. eaas8772. doi.org/10.1126/sciadv.aas8772.
- Yang, J., et al. (2015) Eardrum-Inspired Active Sensors for Self-Powered Cardiovascular System Characterization and Throat-Attached Anti-Interference Voice Recognition. Advances Materials, 27, pp. 1316–1326. doi.org/10.1002/adma.201404794.
- Bae, G. Y., et al. (2016) Linearly and highly pressure-sensitive electronic skin based on a bioinspired hierarchical structural array. Advances Materials, 28, pp. 5300–5306. doi.org/10.1002/adma.201600408.
- Oh, S., et al. (2013) Characterization of ITO etching by spontaneously evaporated fume of hydrogen chloride. Microelectronic Engineering, 103, pp. 173–176. doi.org/10.1016/j.mee.2012.09.021.
- Ali, A. H., et al. (2018) Enhancement of optical transmittance and electrical resistivity of post-annealed ITO thin films RF sputtered on Si. Applied Surface Science, 443, pp. 544–547. doi.org/10.1016/j.apsusc.2018.03.024.
- Seong, S., et al. (2018) Enhanced uniformity in electrical and optical properties of ITO thin films using a wide thermal annealing system. Materials Science in Semiconductor Processing, 79, pp. 14–19. doi.org/10.1016/j.mssp.2018.01.015.
- Khachatryan, H., et al. (2018) Roll-to-Roll fabrication of ITO thin film for flexible optoelectronics applications: The role of post-annealing. Materials Science in Semiconductor Processing, 88, pp. 51–56. doi.org/10.1016/j.mssp.2018.07.033.
- Gunde, M. K., et al. (2009) The influence of hard-baking temperature applied for SU8 sensor layer on the sensitivity of capacitive chemical sensor. Applied Physics A, 95, pp. 673–680. doi.org/10.1007/s00339-008-4966-4.
- Pokaipisit, A., et al. (2008) Vacuum and air annealing effects on properties of indium tin oxide films prepared by ion-assisted electron beam evaporation. Japanese Journal of Applied Physics, 47, p. 4692. doi.org/10.1143/JJAP.47.4692
- Chan, S. H., et al. (2015) The Effect of annealing on nanothick indium tin oxide transparent conductive films for touch sensors. Journal of Nanomaterials, 2015, pp. 815–819. doi.org/10.1155/2015/179804.
- Thirumoorthi, M & Thomas Joseph Prakash, J (2016) Structure, optical and electrical properties of indium tin oxide ultra thin films prepared by jet nebulizer spray pyrolysis technique. Journal of Asian Ceramic Societies, 4, pp. 124–132. doi.org/10.1016/j.jascer.2016.01.001.
- González, G. B., et al. (2001) Neutron diffraction study on the defect structure of indium–tin–oxide. Journal of Applied Physics, 89, pp. 2550–2555. doi.org/10.1063/1.1341209.
- Bao, M & Yang, H (2007) Squeeze film air damping in MEMS. Sensors and Actuators A: Physical, 136, pp. 3–27. doi.org/10.1016/j.sna.2007.01.008.
- Versaci, M., et al. (2021) A Semi-Linear Elliptic Model for a Circular Membrane MEMS Device Considering the Effect of the Fringing Field. Sensors, 21, p. 5237. doi.org/10.3390/s21155237.
- Schmid, S & Hierold, C (2008) Damping mechanisms of single-clamped and prestressed double-clamped resonant polymer microbeams. Journal of Applied Physics, 104, p. 093516. doi.org/10.1063/1.3008032.
- Miniature Single Axis Accelerometers of PCB Piezotronics. Available online: https://www.pcb.com/sensors-for-test-measurement/accelerometers/miniature-piezoelectric/single-axis
- McGeoch, K. L., et al. (2005) Diagnostic criteria and staging of hand-arm vibration syndrome in the United Kingdom. Industrial Health,43, pp. 527–534. doi.org/10.2486/indhealth.43.527.
- Health and Safety Executive. Hand–Arm Vibration—The Control of Vibration at Work Regulations 2005. Available online: http://www.hse.gov.uk/vibration/hav/regulations.htm.