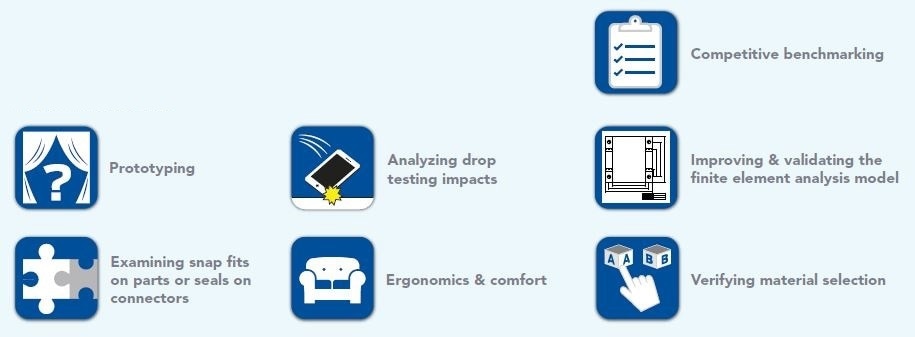
Pressure mapping is an innovative technology that provides various ways to optimize product development, and discover new ways to improve the manufacturing process are. The following concepts are just a few examples of how this technology can be used, although there are limitless possibilities for the technology to be utilized in industries and applications.
Product Development
Product designs either proceed to production or are sent back to the drawing board during the prototype phase. To move a project forward, precision is key in winning over both management and investors, especially in cases where distribution or tolerance can have an impact on the performance and quality of a product.
Pressure mapping can help enhance these product development processes:
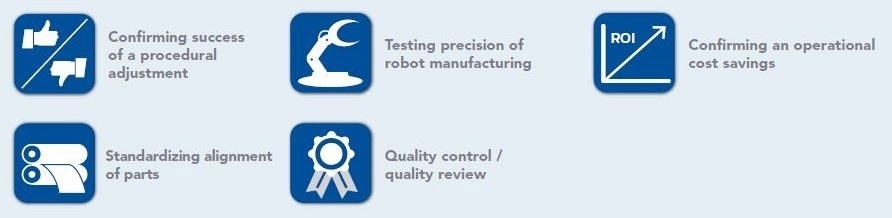
Procedure Improvement
Every industry strives towards efficiency. The company loses revenue whenever operations are suspended to address mechanical adjustments. The ability to streamline specific calibrations and machine setup processes is one possible way to save time and improve yields.
Pressure mapping can help enhance these procedure improvement processes:
Real-World R&D Uses of Pressure Mapping Technology
The following section presents five real-world examples where pressure mapping technology has been essential in improving product development and making R&D processes better.
1. Evaluating Component Press Fits and Seals
Pressure mapping can act as a magnifying glass that design engineers can use to confirm the quality of the design of a product.
There is only so much that can be seen by the naked eye of a design engineer, in terms of connecting parts or generating a tight seal or fit. Acquiring data that can be verified is important in new product prototypes or mechanical adjustments. This verifiable data can help to evaluate a press fit or seal and ensure that the mating surfaces are sufficiently connected. Pressure mapping generates actionable data within paper-thin spaces to ensure that the product matches fit and seal specifications.
CASE EXAMPLE: Enhancing Catalytic Converter Durability
New regulatory standards require that automobile manufacturers design greater surface area into the catalyst in order to dilute emissions. Designing with thinner walls is one possible way of achieving this. A drawback of this is that thinner catalytic converter walls are drastically more prone to cracking if an uneven pressure is applied in the assembly process. These defects can lower product quality, reduce yields, and ultimately result in higher emissions.
Figure 1 shows how a tactile pressure sensor was positioned around the cylindrical catalyst by the automotive R&D team to analyze peak pressures that occur when the catalytic converter can is sealed. Pressure mapping aids the team in making the necessary adjustments, saving on both time and money during design, process verification, and re-engineering processes.
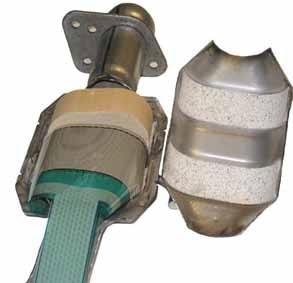
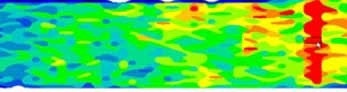
Figure 1. Identifying localized pressures on the catalytic converter wall
Other Press Fit or Seal Applications
- Hose Clamp & Crimp
- Surface Contact for Thermal Conductivity (Heat Sinks)
- Semiconductor Testing
- Printed Circuit Board Components
- Gasket Seal
- Door Seal
2. Evaluating Product Performance
Pressure mapping helps R&D teams take a glimpse into the future and assess how a product will perform over its use.
Product longevity is a key differentiator for most industries. Pressure mapping can be used as an effective tool that provides immediate feedback on how a product will respond to long-term wear-and-tear. This information can then be used by R&D teams to make modifications to product designs that raise the standards of the lifecycle of a product. This is of vital importance when producing a premium product and building customer loyalty.
CASE EXAMPLE: Optimizing Quality Testing in the Tire Industry
The ability of a tire to maintain performance under different loads and applications is what makes a good tire. In addition, qualitative data on the void ratio of a tire is crucial for understanding the water displacement potential of the design. Pressure mapping has thus far been of great importance to R&D teams and has enhanced tire performance optimization.
Figure 2 shows tire footprint pressure output captured in a dynamic roll test. The road surface wear on a tire design can be predicted by tire manufacturers. Quantitative and qualitative evaluation of tire behavior is enabled by the system’s tailored graphing and image analysis software. This information is what tire manufacturers can use to make adjustments to their design. They can evaluate tread design and contact pattern to improve the long-term durability of the tires on the road.
Before the pressure mapping technology was available, this information was acquired using ink and paper. This limited the design R&D process as designers had no way of attaining information regarding dynamic activity or pressure changes when the tire is operating under different loads.
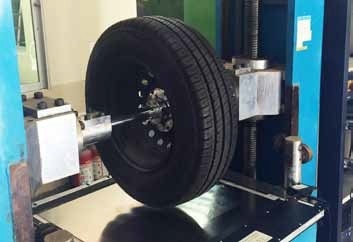
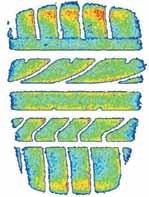
Figure 2. Tire footprint data
Other Product Performance Evaluation Applications
- Tire Bead Pressure Profile
- Wiper Blades
3. Machine Design and Setup Precision
R&D teams can standardize machine design and setup processes with the help of pressure mapping. It also ensures a consistent product after every run.
Every industry strives to become more efficient. A company loses revenue any time operations are suspended to address mechanical adjustments. R&D teams can use pressure mapping to help streamline specific calibrations and machine setup processes. This saves the customer time and improves yields, which ultimately results in a superior end product.
CASE EXAMPLE: Nip Pressure Measurement
A nip creates pressure between two rolls that are forced together and the ‘nip footprint’ is the resulting pressure profile created between the two rolls. To produce a uniform product and eliminate waste, consistent and precise nip pressure is vital. Uneven nip footprints can lead to more costs as well as machine or product damage. Uniformity evaluation can end up being very time-consuming, depending on the size of the nip. This is not ideal for time-sensitive press.
An R&D team sought a verifiable way to ensure their web handling machine could achieve a more precise nip. The integrated pressure mapping technology can assess how effective the crowning is and measure differences in pressures and contact width along the length of the nip roll.
The positioning of a tactile pressure sensor on the nip roll is shown in Figure 3. This is done to analyze nip-pinch along the surface area. Machines can be compared to other machines based on the data provided by the analysis in order to validate the impact of any manufacturing process adjustments.
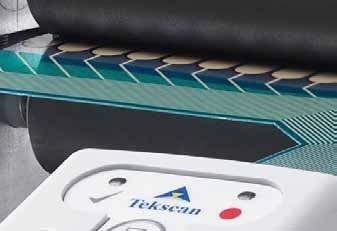
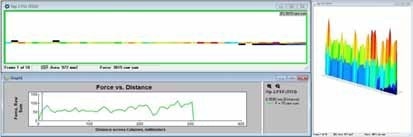
Figure 3. Nip contact evaluation
Other Machine Setup Applications
- Tool & Die
- Horn & Shoe
- Printing & Packaging
- Chemical Mechanical Polishing
- Laminating
4. Comfort and Ergonomic Assessment
R&D teams can produce a more comfortable experience for the end-user with the use of pressure mapping,
Comfort is vital in furniture, wearable, and seating manufacturing industries. However, it is often quite hard to test and evaluate comfort. Insight on peak pressure points, i.e., when a user is in contact with a product, can allow R&D teams to address important fit and comfort needs of their customers. This information can also be useful for competitive benchmarking.
CASE EXAMPLE: Confirming Car Seat Comfort
Comfort is crucial in the day-to-day experience of drivers and passengers. Ergonomic pressures change as the driver makes different movements, such as accelerating or applying brakes. Information about subtle changes such as these can be used by car seat R&D teams to develop improved seat designs that can accommodate particular driving activities.
Figure 4 shows an image of how an automotive R&D team uses pressure mapping to present the dynamic inter-relationship of the seat back and cushion pressure when the driver pushes the brake pedal. Using this data, it was possible for the team to determine peak pressure zones and predict pressure changes over time.
As a result, a more accurate assessment of the effect of stitching, bolsters, wire stays, foam stiffness, seat angles, lumbar supports, and cover materials could be carried out by the team.
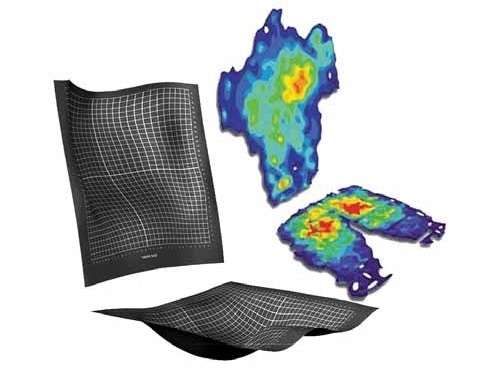
Figure 4. Example of a seat pressure distribution scan
Other Comfort and Ergonomic Assessment Applications
- Headphones
- Eyewear
- Grip
- Furniture & Mattress Design
5. High-Speed Impact Testing
Pressure mapping enables R&D teams to develop an outstanding product that resists the rigor of everyday use. Accidents, often involving drops and blunt force, happen, so the challenge that R&D teams face is to mediate the worst of these effects. Ultimately, collecting quantifiable high-speed impact data can allow R&D teams to develop a stronger product design that customers can trust.
CASE EXAMPLE: Packaging Drop Test Experiment
Product packaging R&D teams value what is on the outside. Knowledge of how a product will react in different drop testing scenarios can help manufacturers find the best way to pack the product for shipping. The potential effects of the customer dropping the product are also considered.
Figure 5 shows a drop testing experiment where the highspeed impacts of a plastic container filled with liquid dropped from different angles and heights were tested using a pressure mapping system.
A low-resolution sensor measuring at 20 KHz was used to identify the concentration of pressure. This information provided the R&D team with the assurance that the bottom of the product could handle drops without any breaks or leaks.
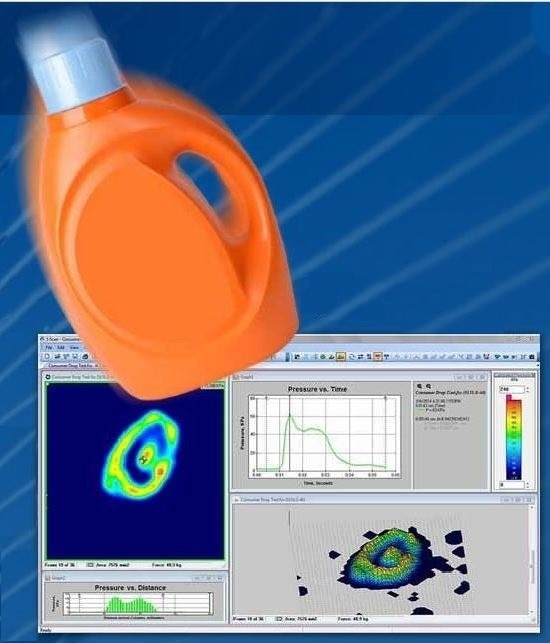
Figure 5. Drop testing results
Other High-Speed Impact Testing Applications
- Collision Testing
- Ballistics Recoil
- Machine Press
- Airbag Deployment

This information has been sourced, reviewed and adapted from materials provided by Tekscan, Inc.
For more information on this source, please visit Tekscan, Inc.