Early diagnosis is critical for effectively treating diseases, especially in oncology. However, the absence of apparent clinical symptoms and limitations of traditional screening methods pose significant challenges. In response to this gap, medical science is exploring innovative diagnostic platforms, including liquid biopsy, a promising technique.
Originally introduced to identify circulating tumor cells (CTCs) in the bloodstream, liquid biopsy now includes a broader array of body fluids, including saliva, cerebrospinal fluid, pleural effusion, and of greatest note, urine.
Why Urine?
Urine provides a unique look into human health. It is a biological fluid that is easy to obtain through non-invasive methods and is generally acceptable to patients.
Urine is being increasingly recognized for its potential in diagnostics. It can reflect the metabolic state of a variety of organs and indicate neoplastic and inflammatory processes. As metabolites and biomarkers are present, urine is the ideal candidate for spectral analysis.
Traditional Urine Analysis Methods
Urine analysis is a central element of diagnostic medicine with its use dating back to ancient times. These early methods are still widely used but have limitations in terms of precision, scope, and speed.
Culture Tests
Urine cultures are utilized for infection diagnosis, identifying bacterial species, and determining antibiotic sensitivity. However, diagnosis with this method is delayed by 24–72 hours of incubation.
Urinanalysis Dipstick Tests
In clinical settings, colorimetric tests are commonly used for fast screening. Dipsticks can detect several parameters, such as glucose, pH, protein, bilirubin, ketones, and blood. They are of good use, but semi-quantitative, subject to user error, and typically only provide a basic overview.
Urine Microscopy
Urine sediment examination using a microscope can detect cells (RBCs, WBCs), crystals, casts, and bacteria. It does provide useful information; however, microscopy is labor-intensive, demands trained personnel, and can lack sensitivity in low-abundance biomarkers.
Chemical Assays and Enzymatic Methods
This type of test measures specific substances (e.g., urea, creatinine, or albumin) with greater accuracy than dipsticks. However, it is not always ideal, as sample preparation, reagents, and laboratory infrastructure are required, and is often time-consuming.
Spectral Techniques in Urine Analysis
Recent advancements in technology have allowed for the use of optical (spectral) methods to examine urine at the molecular level. These techniques use the interaction of light with urine molecules to capture spectral signatures that reveal quantitative and qualitative information. They offer quick, accurate, and non-invasive alternatives for diagnostics.
Raman Spectroscopy
Raman spectroscopy measures the inelastic scattering of monochromatic light—usually from a laser—as it interacts with molecular vibrations. It has a high degree of sensitivity and can detect miniscule amounts of substances. This method is particularly effective for the identification of:
- Drugs of abuse (e.g., opioids, amphetamines, MDMA)
- Therapeutic agents (e.g., benzodiazepines, antipsychotics)
- Doping substances (e.g., erythropoietin, ephedrine)
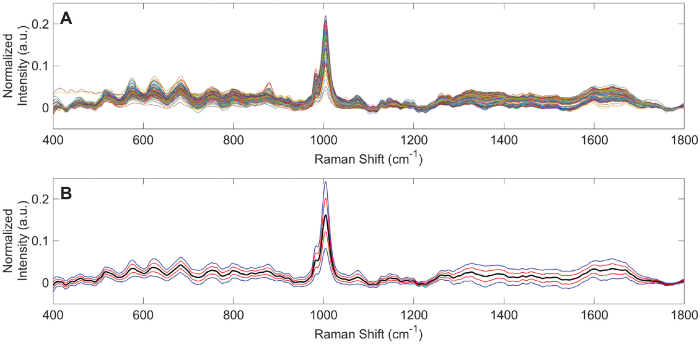
Spectral characteristics of urine specimens from healthy human volunteers analyzed using Raman chemometric urinalysis (Rametrix). Image Credit: Senger RS, Kavuru V, Sullivan M, Gouldin A, Lundgren S, Merrifield K, et al. (2019) 1
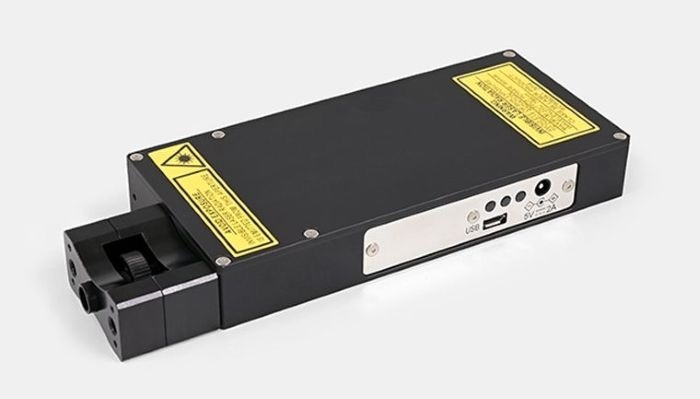
Raman spectra from 235 urine specimens obtained using 735 nm (30 mW) laser excitation. (A) Overlaid vector-normalized spectra. (B) Average urine spectrum (black) with 1 (red) and 2 (blue) standard deviation ranges. Notable peaks appear at 1006 cm–1 (Urea) and 1640 cm–1 (Water).Spectroscopic module C15471. Image Credit: Hamamatsu Photonics Europe
Fourier Transform Infrared Spectroscopy (FTIR)
FTIR captures high-resolution spectral indicators of urine, enabling the detection of proteins, cells, lipids, and even pathogens. When combined with computational techniques such as principal component analysis (PCA) and Soft Independent Modeling of Class Analogy (SIMCA), FTIR has shown impressive clinical potential, including the capability of distinguishing kidney donors with a high risk of organ rejection.

Hamamatsu's C16511-01 FTIR engine, a high-speed and compact near infrared spectrometer that can be incorporated into an inline process. Image Credit: Hamamatsu Photonics Europe
Visible (VIS) and Near-Infrared (NIR) Spectrometry
These techniques utilize a broadband light source that reflects or transmits through the urine sample. A spectrometer then detects the specific wavelengths absorbed by the sample. This enables assessment of a broad range of biomarkers, which can be indicative of a number of dysfunctions:
- Hydration and renal function: Urine osmolality, creatinine, specific gravity
- Metabolic health: Uric acid, citrate, urea, oxalate
- Infection and inflammation: White/red blood cells, albumin, bacteria, total protein
Even though inorganic ions are not capable of directly absorbing NIR light, they do affect spectral patterns through ion–water interactions. Similarly, urine saturation and crystallization (e.g., calcium oxalate) can be visually detected.
Measuring urine saturation and crystallization is crucial in the prevention, diagnosis, and management of urinary tract conditions and kidney stones. For instance, early detection of supersaturated urine can lead to well-timed hydration, dietary, or pharmacological interventions that prevent stones from forming.
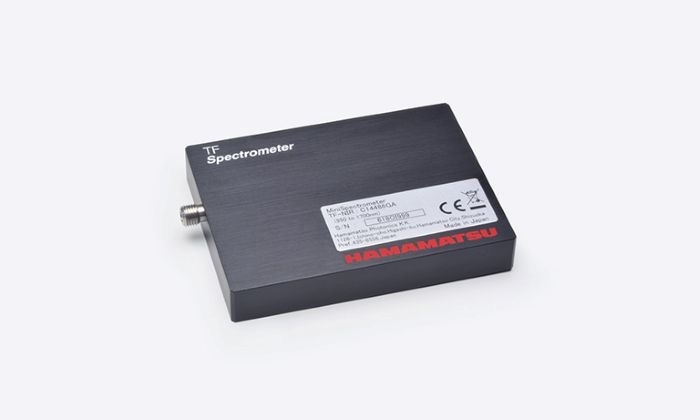
Hamamatsu's TF series C14486GA minispectrometer, for the near-infrared range, compact/thin case with an InGaAs linear image sensor mounted. Image Credit: Hamamatsu Photonics Europe
Fluorescence Spectrometry
This technique measures light emission from substances with absorbed energy, usually visible or UV light. Fluorescence spectrometry can detect endogenous fluorophores such as:
- NADH and FAD (indicators of mitochondrial function)
- Tryptophan (linked to protein metabolism and cellular activity)
- Porphyrins (associated with heme synthesis and certain cancers)
Abnormal levels of these compounds can reflect mitochondrial stress, inflammation, cellular damage, neoplastic changes, or metabolic disorders. For example, hematuria (blood in urine) can be confirmed through the detection of fluorescence emissions in the range of 450–520 nm and visible color change.

Hamamatsu's C12666MA mini-spectrometer, fingertip size, ultra-compact spectrometer head integrating MEMS and image sensor technologies. Image Credit: Hamamatsu Photonics Europe
Complementary Sensing-Conductimetry
Spectral methods are improved by combining them with conductimetry, which measures the electrical conductivity of the urine to assess the total ion concentration. This dual approach improves diagnostic accuracy and limits false negatives, particularly when adjusting for sample temperature.
Advantages of Spectral Methods Over Traditional Techniques
Source: Hamamatsu Photonics Europe
| Features |
Traditional Methods |
Spectral (Optical) Methods |
| Invasiveness |
Non-invasive |
Non-invasive |
| Speed |
Minutes to days
(e.g., cultures) |
Seconds to minutes |
| Sample preparation |
Often required |
Minimal or none |
Quantitative
precision |
Limited to lab-based tests |
High-precision, multi-parametric |
| Biomarker range |
Narrow (specific targets) |
Broad (metabolic + structural) |
Operator
dependency |
Moderate to high |
Low (automated, software-assisted) |
| Repeatability |
Variable; risk of degradation |
High; samples remain intact |
| Data richness |
Low to moderate |
High (full spectral fingerprint) |
A New Era in Diagnostics
Modern urine analyzers are drastically altering diagnostic medicine by integrating infrared, visible, and fluorescence spectrometry with conductimetry into compact analytical platforms. These devices allow clinicians to perform quick and trustworthy assessments over various biomarkers. What was previously limited to custom laboratories can now be conducted in almost real-time, providing new possibilities for early disease detection, risk assessment, and treatment monitoring, without requiring invasive procedures.
As technology evolves, there is growing potential for point-of-care and possibly home-based applications. Spectral urine analysis is positioned to move diagnostics from the lab to the bedside and further, making precision healthcare more efficient, accessible, and patient-friendly.
Hamamatsu offers sensitive, highly reliable, and miniaturized spectral solutions that are becoming integral to this transformation. By allowing for more compact and accurate sensing platforms, Hamamatsu is contributing significantly to medical diagnostic advancements, assisting in bringing innovative, non-invasive tools into everyday clinical practice
References
1 Senger, R.S., et al. (2019). Spectral characteristics of urine specimens from healthy human volunteers analyzed using Raman chemometric urinalysis (Rametrix). PLOS ONE, 14(9), p.e0222115. https://doi.org/10.1371/journal.pone.0222115.
- Vigo, F., et al. (2022). Vibrational Spectroscopy in Urine Samples as a Medical Tool: Review and Overview on the Current State-of-the-Art. Diagnostics, 13(1), p.27. https://doi.org/10.3390/diagnostics13010027.
- Li, J., et al. (2020). MicroRNAs in urine as diagnostic biomarkers for multiple myeloma. International Journal of Laboratory Hematology, 43(2), pp.227–234. https://doi.org/10.1111/ijlh.13367.
- Brouwer-Brolsma, E.M., et al. (2017). Combining traditional dietary assessment methods with novel metabolomics techniques: present efforts by the Food Biomarker Alliance. Proceedings of the Nutrition Society, 76(4), pp.619–627. https://doi.org/10.1017/s0029665117003949.
- USense, "Hand-held urine analyzer integrating spectral and electrical measurements," U.S. Patent Application US2024102987A1, Apr. 4, 2024. [Online]. Available: https://worldwide.espacenet.com/patent/search/family/074141311/publication/US2024102987A1

This information has been sourced, reviewed and adapted from materials provided by Hamamatsu Photonics Europe
For more information on this source, please visit Hamamatsu Photonics Europe.