Tekscan offers a novel technique for quantifying pressure exchanges inside a battery housing for lifecycle testing.
Technology to See how a Battery Breathes
People who are familiar with the make of a prismatic lithium-ion battery will state that it breathes. Charging and discharging result in electrochemistry, temperature changes and mechanics of the internal components that, in return, alters the internal pressures.
When manufacturers attempt to make a product that is safe, lightweight and efficient, it is crucial for designers to fully comprehend such characteristics. Irrespective of the industry, energy storage systems or consumer electronics, users demand smaller, lighter batteries with a higher energy density, faster charging and high safety, even during catastrophic events.
In general, such features can conflict with each other, making it difficult to find a balance and stay cost-competitive.
Taking the materials and construction of a battery into account, assessing the pressure dynamics tends to be crucial to retain the control gassing, material spacings and avoid surplus swelling.
Components of a Pressure Mapping System
Sensor
- Minimal invasiveness
- Thin and flexible
- High resolution

Figure 1. Image Credit: Tekscan, Inc.
Electronics
- Scan thousands of sensing points inside every sensor
- Instant data relay to PC through WiFi or USB

Figure 2. Image Credit: Tekscan, Inc.
Software
- Pressure distribution data can be displayed in multiple formats for excellent analysis
- Display pressure data graphs in 2D and 3D
- Peak pressures and center of force can be captured in real-time
- Enables video playback of pressure data

Figure 3. Image Credit: Tekscan, Inc.
What is Pressure Mapping?
Interface pressure distribution is usually not uniform inside localized areas of high pressure even between relatively flat surfaces. The technology of pressure mapping assists design engineers to understand regions that might affect design and quality.
Three components are required for pressure mapping systems — software, scanning electronics and sensors — to provide real-time, actionable data, which cannot be offered by other methods.
- The sensor converts extensive pressure loads into a change in resistance
- The scanning electronics gather analog data from the sensor and transform the data into a digital signal
- The software shows real-time activity of the sensor region, thereby enabling the user to observe force, pressure, timing data and contact area
While considerable measures have been taken by several manufacturers to retain constant stack construction at the time of manufacturing, many do not verify the stack pressure as part of their quality procedure. Many also do not measure the internal stresses on the stack when the battery is charged and discharged.
As part of a 2013 Princeton study,1 scientists discovered that high stack pressures had “a strong effect on long term cell performance, with higher levels of stress leading to higher rates of capacity fade.” Considerable internal pressures were demonstrated to result in plastic deformation, delamination and increases in internal impedance when the anode and cathode get isolated.
Lower stack pressures were able to provide improved long-term performance, but delamination might still happen when pressures are too low. Furthermore, the difficulty turns out to be in determining the “sweet spot” for housing pressure.
A load cell fixture has the ability to characterize the average pressure on the battery assembly, as illustrated in the image. This study successfully quantified average pressure in cycle testing, and the technology of pressure mapping provides engineers with a chance to gain a better understanding of this application and determine particular regions of pressure.
One Method to Measure Compressive Stack Stress
The fixture diagram in Figure 4 represents one way to quantify pressure variations at the time of the charge or discharge cycle of a prismatic cell battery. This setup is quite similar to the one employed in the 2013 Princeton study,1 where a load cell placed below the battery was utilized to capture pressure changes.
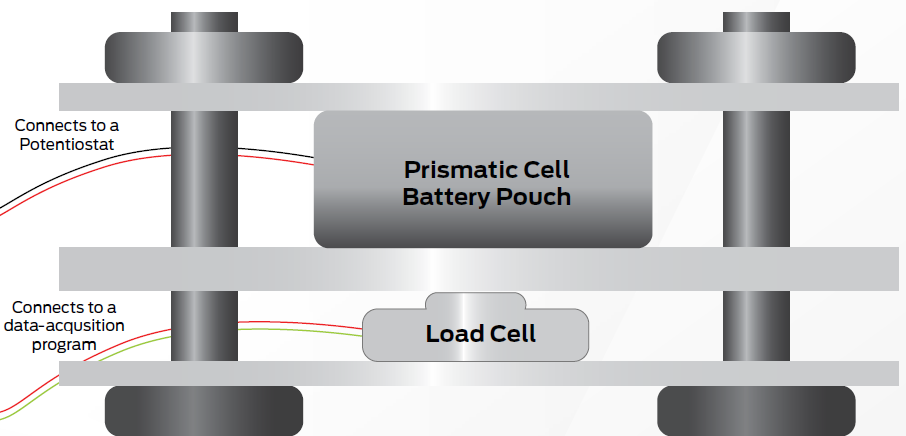
Figure 4. Image Credit: Tekscan, Inc.
Higher stack pressures can result in higher rates of capacity fade. Also, considerable internal pressures might cause plastic deformation, delamination and increases in internal impedance when the cathode gets isolated.
Lower stack pressures permit excessive movement from thermal expansion inside the housing, which can also cause plastic delamination.
Pressure mapping has been employed in multi-month studies that assess the pressure profile when thousands of charging and discharging cycles are done. These are the principles that can be used to assess battery housing materials.
The thin and flexible range of sensing elements offers extensive data of the various pressures between any two surfaces. As illustrated in Figure 5, when battery charge or discharge cycle testing is concerned, a thick sensor measuring around 0.01 mm can be cloaked around the battery to offer a 360° view of the battery.
Pressure mapping offers scientists and battery designers a wider array of evaluation tools and insights on the effects of various use parameters of their designs. Such studies have helped designers determine the right materials and construction for their requirements, thereby resulting in improved designs with repeatable results.
Moreover, this technology has been employed to assess housing designs, or find susceptible locations on a battery during impact testing.
Using Pressure Mapping Technology to Improve Upon a Tried and True Method
The thin and flexible pressure mapping sensor has the potential to match with the complete battery pouch. This enables the engineers to simulate what might occur in a real-world battery stack array.
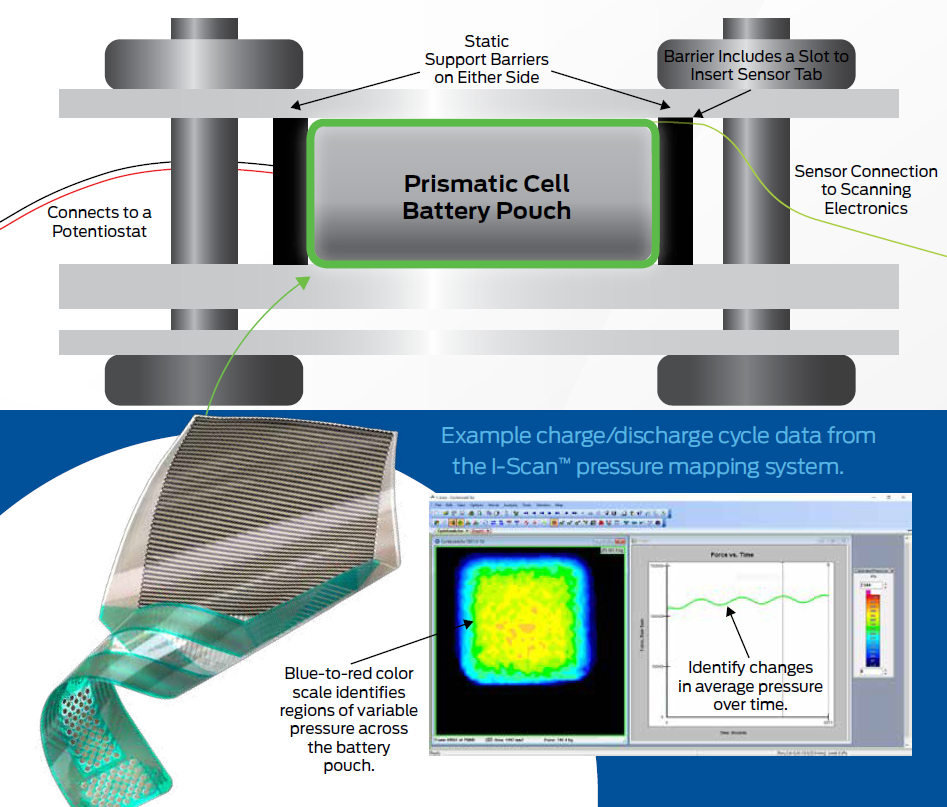
Figure 5. Image Credit: Tekscan, Inc.
Conclusion
While attempting to improve the characteristics explained on this page, designers should ensure they do not compromise on the products’ safety. The temperature that rises during charging results in lithiation, which also causes gassing. The internal pressures due to the additional gasses in the battery can be a reason for housing or separator failures, which can cause thermal runaway reactions.
The technology of pressure mapping turns out to be an essential method to help engineers determine areas of localized pressure at virtually any position of a prismatic battery cell, resulting in improved design decisions, a clear edge over competitors and longer-lasting technology.
Reference
- Cannarella, J., Arnold, C., “Stress Evolution and Capacity Fade in Constrained Lithium-Ion Pouch Cells” Journal of Power Sources. 245 (2014) 745-75. https://doi.org/10.1016/j.jpowsour.2013.06.165.