Jan 18 2013
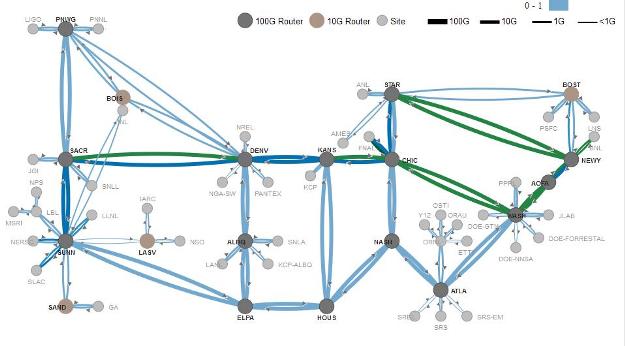
A new interactive map developed by the Department of Energy’s ESnet (Energy Sciences Network) provides a detailed, up-to-the-minute look at the level of traffic traversing the various sections of the network as it connects 40 research sites around the country.
 New Energy Sciences Network
ESnet is currently the world’s fastest coast-to-coast science network with a national backbone with 100 gigabit-per-second capability. This new network, which entered production use in November 2012, is depicted graphically at: https://my.es.net/esnet5/map.
The rates of data transfer are color-coded and by clicking on a particular connection, users can get the exact rate. By clicking on many of the end sites on the map, users can see a summary of data traffic to and from the site over the past 24 hours, as well as a table of the top 10 countries connected to the site.
“Our Tools team worked very hard to develop this map and I think the end result is as useful as it is beautiful,” said ESnet Director Greg Bell. “From being able to see overall network at a glance to drilling down into specific connections and sites, the map is a great tool for seeing what’s happening on ESnet.”
The ESnet Tools Team comprises Jon Dugan and Gopal Vaswani and is managed by Inder Monga, ESnet’s Chief Technologist and Area Lead.
“Although we rely on them to be easy to use and perform flawlessly, networks are extremely complex systems and can be difficult to represent accurately,” Monga said. “The team did an excellent job in balancing the need for critical information with legibility and ease of use.”
The map presents a simplified, high-level view of the network by combining and simplifying some aspects. One simplification is that connectivity for each site is shown as a single pair of lines which show the traffic traversing all connections to the site. This simplification means that this map does not show the fault tolerance which has been carefully engineered to provide the sites with highly available connectivity. The second simplification is that for any pair of nodes shown there is only a single pair of lines representing all of the connections between that pair of nodes.
This map is the first of several envisioned by the team, which plans to create additional maps that will focus on highlighting specific aspects of the new network.
ESnet is managed by Lawrence Berkeley National Laboratory for the Department of Energy.